
3
DETERMINANTS OF SCIENTIFIC LEADERSHIP
Leadership in materials science and engineering is influenced by several factors, that would be weighted differently in highly developed countries around the world depending on national policy, economics, and available resources (installed research infrastructure, talent base). The Panel focused on 5 determinants as particularly important to US leadership in the various subfields of materials science and engineering:
-
National imperatives: To what extent do national imperatives for defense, infrastructure development, or international competitiveness influence science and technology policy?
-
Innovation: What investment and technology development mechanisms facilitate introduction of new materials and processes into the marketplace?
-
Major facilities: What facilities exist to elucidate atomic and subatomic materials structure and phenomena?
-
Centers: What research centers exist to facilitate interdisciplinary research?
-
Human resources: What infrastructure exists to educate and train scientists and engineers in the various disciplines that support materials science and engineering? Does this infrastructure provide a tiered community of leaders for technology research and development?
-
Funding: Are sources of support balanced and adequate to sustain leadership in the areas of research that support the national imperatives?
Although possession of these elements does not guarantee leadership, without a majority of them, leadership would be difficult to maintain. Based on panel assessments, the United States does currently enjoy a leadership position—or is among the leaders—in a majority of the subfields of materials science and technology. The panel focused on the status and trends of the determinants listed above and found that they have not only made the US position of leadership possible, but they also will be critical for sustaining leadership in the future. Although presenting a balanced, comprehensive, comparative analysis of these determinants for all of the regions of the world would take more time than is available for this study, comparisons are made where they are particularly salient and information is readily available.
3.1. National Imperatives
Several forces coalesced after World War II to bring about what, during the 1950s, was known in the United States as the National Materials Program. The global spread of nuclear weapons capabilities, the growing intensity of intercontinental ballistic missile development, and the space race placed demands on the materials science and engineering communities for advanced materials that would give the United States a strategic edge. Also in the 1950s, leading industrial laboratories had a growing interest in materials research and development and set up well-equipped interdisciplinary laboratories that contributed to economic growth.
The euphoria over developments in synthetic polymers, uses of the transistor, and optical fibers and the emergence of rudimentary composite materials spurred interest in the White House Science Office, the Office of Naval Research (ONR), the National Aeronautics and Space Administration (NASA), the Atomic Energy Commission (AEC), the National Science Foundation (NSF), and the Department of Defense (DOD) for the establishment in 1960 of what became known as the Defense Advanced Research Projects Agency (DARPA) Interdisciplinary Laboratories (IDLs). Later in 1972, the DARPA IDLs were transferred to NSF to become the Materials Research Laboratories (now the Materials Research Science and Engineering Centers). Also, beginning in the 1960s, AEC and NSF invested in major instrumentation facilities at national laboratories and research universities to probe more deeply the atomic and subatomic properties of matter.
The national imperative for materials research and development was sustained until the mid-1980s by the intensifying cold war, the space race, and growing concern over global competitiveness of US manufacturing. Materials have been named on all the various “critical technologies ” lists, in particular those of the Department of Commerce, DOD, and Rand's Critical Technology Institute. Development of the infrastructure for materials research and development, the increased unification of the field by bringing together materials subdisciplines and by integrating science with engineering and theory with experimentation, is attributable to the momentum created by national imperatives. Thus national imperatives can be credited for much of our current leadership. The major contracts government provides to industry are also, to a large degree, in response to national imperatives. Federally funded programs have contributed to industrial leadership in the semiconductor, civilian aircraft, computer, and optical–electronic industries, among others. Therefore, an understandable concern in the materials research and development community is whether leadership can be sustained in the absence of nationally focused imperatives.
3.2. Innovation
Beauty and elegance can describe a scientific discovery, but its power lies in its effect on our lives. A key factor in its effect is how rapidly and easily ideas can be tested, developed, and extended. The process by which research ideas are developed and funded in the United States—our “innovation system”—is unique. The factors that influence the process—pluralism, partnerships, regulation, and professional societies—are discussed below.
3.2.1. Pluralism
The funding of our innovation system is characterized by many options, whether in academic research or in the entrepreneurial work supported small and large companies. NSF and DOE also support the work. Programs are funded by mission agencies, such as DARPA, or the defense science offices (ONR, Army Research Office, and Air Force Office of Scientific Research). This variety of sources, with different emphases, creates a spectrum of opportunities. For example, DOD might be interested in giant magnetoresistance for radiation-hard nonvolatile memories; NSF might want to encourage collaboration in this area between universities and the magnetic storage industry. The peer review process that underlies research funding and the extensive networking associated with advisory boards contributes to the high quality of federally funded research.
In addition, large and small industries conduct basic and applied research independently. Industry needs influence funding by the federal government, and history shows that pluralism is an important influence of research leadership. Thus, the direction of research should never be dictated solely by industry.
3.2.2. Partnerships
Collaboration of university and industry researchers is an important aspect of the US innovation system. In other countries, such as Germany, similar connections exist, and European economic development programs support these relationships. Many Japanese companies support materials research in US universities because of our ready access to new technology. Whereas US industry funds only about 10% of the research carried out in universities, the mobility of individuals between academic and industrial laboratories is especially vital in the transfer of new concepts and technology. Many faculty members have industrial experience, and often they serve as consultants to industry. University faculty also participate in the formation of high-tech companies. These relationships provide university researchers with an understanding of problems that are relevant to industry, and they provide a channel for the transfer of knowledge and new approaches developed in academia with funding from the federal government. There are few true two-way university–industry collaborations, for example, where industry funds the research and influences its direction through joint activities, such as two-way personnel exchanges.
A good example of one industry–university–government collaboration can be found in NSF's Engineering Research Centers. The data storage center at Carnegie-Mellon University in Pittsburgh is actively supported by the US industry, as represented by IBM, Seagate, Quantum, and others. One limiting factor in high-density recording has been the noise associated with thin-film magnetic media. Collaborative studies by industry and Carnegie-Mellon scientists have identified the source of the noise, and these studies led to the development of a Nickel– Aluminum film underlayer that promotes the growth of low-noise media. The material is being adopted by the industry, and it will provide US companies with a competitive advantage.
Partnerships in general, whether between universities and industry or among companies, have become critical to improving the effectiveness with which industry commercializes research. Some corporations now rely as much on academic research as they do on work conducted in their own laboratories. Many researchers worry that the abandonment of forward-looking exploratory research by some large companies will lead to weakness in materials science
and engineering research in the United States. This seems particularly true in cases where materials fabrication and characterization are capital intensive. Direct involvement of materials producer and user communities in the early stages of research and development at universities and national laboratories can be essential to the use of new materials technology in the design and manufacture of new products.
3.2.3. Regulation
Government regulations are another factor in the innovation process. The objectives of safety, and of environmental, occupational, and health protection can add time and expense to the development of new materials. In general, long lead times—sometimes exceeding 15 years—are required to bring a new material to the marketplace. This delay is caused not only for these objectives but also because of the time needed to develop processing methods, reduce property variations, develop design data bases, and develop standards for the testing and use of new materials. Government regulations also can motivate the need for materials. Examples include catalysts used to control hydrocarbon and nitrogen oxide emissions and on-board sensors required by the Clean Air Act for monitoring automobile emissions.
The materials subfields that are especially affected by regulation are biomaterials, metals, polymers, ceramics, and composites used in safety-critical structures (airframes, nuclear reactors, jet engines). Regulatory barriers that unduly extend lead times to market in these materials subfields can directly affect the US global position.
Environmental control regulations affect research on such materials as polymers, adhesives, and coatings, and in the study of volatile organic compounds, hazardous elements, and biodegradation.
|
Box 3.1 The Federation of Materials Societies The Federation of Materials Societies (FMS) is an umbrella organization whose member societies and affiliates represent professional societies, universities, and National Research Council organizations involved with materials science, engineering, and technology. FMS constituent societies have more than 700,000 members. Constituent Societies
Affiliates
Represented by Liaison Members
Source: http://www.foms.org/ |
3.2.4. Professional Societies
Another factor in
achieving leadership is the information infrastructure provided by professional societies. The US materials science and engineering community has benefited from the diversity of professional societies, which facilitate communication, organize and focus attention on new topics via symposia, produce world-class journals and publications, and sponsor international conferences and workshops that bring researchers together (Box 3.1). Prominent professional societies in many disciplines also have materials-related divisions (the Institute of Electrical and Electronics Engineers [IEEE], the American Physical Society [APS], the American Chemical Society [ACS], the American Institute of Chemical Engineers [AIChE], the American Agricultural Economics Association [AAEA], and the American Society of Mechanical Engineers [ASME]). Many researchers in a variety of disciplines actively pursue materials research. The establishment of scholarly and professional societies in the United States is dynamic. The Materials Research Society (MRS) was established in 1973 to provide professional representation for materials scientists working on electronic, photonic, and other functional materials. MRS now has more than 12,000 members in the United States and in more than 50 other countries; it has been broadly emulated by other nations under a confederation of International Council of Scientific Unions (ICSU) materials societies (Box 3.2). Materials scientists and engineers are also prominently represented in learned societies here and abroad. For example, 2.8% of the members of the National Academy of Sciences (NAS) and 15.5% of the members of the National Academy of Engineering (NAE) can be identified with materials research. They also often enjoy cross-membership in learned societies around the world. Such associations and collaborations greatly facilitate awareness and global exchange of fast-breaking developments in the field.
|
Box 3.2 International Union of Materials Research Societies The International Union of Materials Research Societies was established in 1991 as an association of technical groups and societies that have an interest in promoting interdisciplinary materials research. The Union's objectives are as follows:
Current members:
Source: http://mrcemis.ms.nwu.edu/iumrs |
3.3. Major Facilities
Research on materials depends on the ability to fabricate and characterize materials. To be a leader, one must have access to state-of-the-art facilities. An important component of federal support for basic research is the development and maintenance of the major facilities needed to carry out that research. By “major facilities,” we mean facilities that have unique research capabilities that are too expensive for any one entity to support. In the case of materials research, these facilities include sources of neutrons, synchrotron radiation, high-energy electrons, and high magnetic fields.
Major facilities serve as an intellectual focus, and science develops as the interplay between experiment and theory. State-of-the-art facilities attract the world's leading scientists, so excellent facilities often make for award-winning research. Table 3.1. lists awards given to scientists for their work in neutron-scattering research.
Table 3.1 Major Scientific Awards for, or Strongly Influenced by, Neutron-Scattering Research
|
Year |
Name |
Award |
Research Area |
|
1957 |
Clifford Shull (MIT) |
APS Buckley Prize |
Neutron diffraction, magnetic structure |
|
1963 |
Bertram Brockhouse (AECL) |
APS Buckley Prize |
Phonons, magnons |
|
1973 |
John Axe, Gen Shirane (BNL) |
ACA Warren Diffraction Award |
Soft modes, phase transitions |
|
1973 |
Gen Shirane (BNL) |
APS Buckley Prize |
Phonons, soft modes |
|
1974 |
Paul Flory (Cal Tech) |
Nobel Prize, Chemistry |
Polymer structure |
|
1978 |
Henri Benoit (Strasbourg) |
APS High Polymer Prize |
Neutrons, polymer structure |
|
1982 |
Edwards (Cambridge) and Pierre de Gennes (Col. Paris) |
APS High Polymer Prize |
Reptation theory |
|
1984 |
Charles Han (NIST) |
APS Dillon Medal |
Polymer structure and dynamics |
|
1986 |
Muthu Kumar (U. Mass.) |
APS Dillon Medal |
Theory of polymer structure |
|
1987 |
Robert Birgeneau (MIT) |
APS Buckley Prize |
Magnetism |
|
1988 |
Robert Birgeneau (MIT), Paul Horn (IBM) |
ACA Warren Diffraction Award |
Low-dimensional systems |
|
1988 |
Jean Guenet (Saclay) |
APS Dillon Medal |
Gel formation |
|
1989 |
Frank Bates (AT&T) |
APS Dillon Medal |
Block copolymers |
|
1990 |
Pierre de Gennes (Col. Paris) |
Nobel Prize |
Theory of polymers, liquid crystals |
|
1990 |
James Jorgensen (ANL) |
ACA Warren Diffraction Award |
Structure of ceramic superconductors |
|
1990 |
Dieter Richter (KFA) and John Huang (Exxon) |
Max Planck Research Prize |
Dynamics of polymers and microemulsions |
|
1991 |
Ken Schweitzer (Sandia) |
APS Dillon Medal |
Polymer RISM theory |
|
1992 |
Glenn Frederickson (UCSB) |
APS Dillon Medal |
Theory of microsphere polymer structure |
|
1992 |
Phil Pincus (UCSB) |
APS High Polymer Prize |
Theory of complex fluids |
|
1992 |
Alice Gast (Stanford) |
Colburn Award (American Institute of Chemical Engineering) |
Colloids and polymers |
|
1994 |
Schull and Brockhouse |
Nobel Prize, Physics |
Neutron-scattering methods for structures |
|
1996 |
Frank Bates (U. Minn.) |
APS High Polymer Prize |
Structure of copolymers |
|
1996 |
Nitash Balsara (N.Y. Polytech.) |
APS Dillon Prize |
Properties of polymer blocks |
|
1997 |
David Price (ANL) |
ACA Warren Prize |
Structure of disordered systems |
|
Source: Adapted from, Neutron Sources for America's Future: Report of the Basic Energy Sciences Advisory Committee Panel on Neutron Sources, Department of Energy, DOE/ER-0576P, 1993. |
|||
3.3.1. Neutron Scattering Facilities
Table 3.2, Table 3.3, Table 3.4 and Table 3.5 show neutron sources in the US and the rest of the world.
Table 3.2 US Research Reactors
|
Facility |
Agency |
Year |
Thermal Flux/Power |
Operation Cost ($ million FY 1996) |
|
HFBR (BNL) + |
DOE |
1965 |
1015/60 MW |
25 (60 MW) |
|
HFIR (ORNL) |
DOE |
1966 |
1015/85 MW |
27 |
|
HFIR upgrade |
2001 |
Cold source 4 cold instruments |
||
|
NBSR (NIST) |
DOC |
1969 |
4.1014/20 MW |
7 |
|
NBSR upgrade |
2000 |
New cold source (X2) 5 thermal/cold instruments |
||
|
MURR (U. Mo.) |
1965 |
1014/10 MW |
6 |
+ This facility is closed. Plans are to bring it up to 50% power 30 MW.
Source: Presentation by John Rush of NIST to Panel in 8/97.
Table 3.3 Research Reactors Abroad
|
Facility |
Year |
Therma Flux/Power |
Operation Cost ($ million FY 1996) |
|
ILL (France) |
Refurb. 1995 |
1.2.1015/57 MW |
26 |
|
Orphée (France) |
1980 |
3.1014/15 MW |
~16 |
|
KFA (Germany) |
Refurb. 1994 |
2.1014/23 MW |
~17 |
|
Berlin (Germany) |
Refurb. 1991 |
2.1014/10 MW |
~15 |
|
Riso (Denmark) |
1963 |
1.5.1014/12 MW |
~12 |
|
JRR-3M (Japan) |
1991 |
3.1014/20 MW |
18 |
|
HANARO (Korea) |
1994 |
20 MW |
? |
|
RSG-GAS (Indonesia) |
1990 |
3.1014/30 MW |
? |
|
Under Construction: |
|||
|
FRM-II (Munich) |
8.1014/20 MW |
~18, cost ~500M$* |
|
|
Under Planning: |
|||
|
TRRII (Taiwan) |
~3.1014/20 MW |
cost ~300M$ * |
|
|
Australia |
~3.1014/20 MW |
cost ~300M$ * |
|
|
IRF (Canada) |
~3.1014/20 MW |
cost ~300M$ * |
* Construction; ?, information unknown.
Source: Presentation by John Rush of NIST to Panel in 8/97.
Table 3.4 US Spallation Sources
|
Facility |
Agency |
Year |
Current Energy/Target |
Operation Cost ($ million FY 1996) |
|
IPNS (ANL) |
DOE |
1981 |
6 kW/U |
10 |
|
LANSCE (LANL) |
DOE |
1985 |
80 kW/W 11 |
? |
|
LANSCE upgrade |
DOE |
2002 |
6 new instruments, 160 kW |
|
|
Under Planning: |
||||
|
SNS at ORNL |
1-2 MW spallation source |
cost ~1.3B$* |
* Construction; ?, information unknown.
Source: Presentation by John Rush of NIST to Panel in 8/97.
Table 3.5 Spallation Sources Abroad
|
Facility |
Year |
Current Energy/Target |
Operation Cost ($ million FY 1996) |
|
ISIS (UK) |
1985 |
160 kW |
~25-30 |
|
KENS (Japan) |
1980 |
3 kW |
6 |
|
SINQ (Switzerland) |
1996 |
800 kW (steady state) |
? |
|
Under Planning: |
|||
|
N-arena (Japan) |
600 kW (pulsed) |
cost ~800 M$ * |
|
|
ESS (EEC, site to be determined) |
~5 MW |
cost 1B+$ |
|
|
AUSTRON (Austria) |
~200 kW |
cost ~400M$ * |
* Construction; ?, information unknown.
Source: Presentation by John Rush of NIST to Panel in 8/97.
As shown in Table 3.2, Table 3.3, Table 3.4and Table 3.5, US sources, if not upgraded, soon will have less capability than found in sources abroad. Many US facilities also are oversubscribed. The National Institute of Standards and Technology (NIST) cold neutron facility receives up to 3 times as many research proposals as it can accommodate, and responses to proposals can take 6 months. The situation is similar at Argonne National Laboratory, where oversubscription is 2–2.5, occasionally as high as 7. The review time for proposals is 6 months at minimum, and some proposals are never considered because peer reviewers rate their quality as too low for inclusion (Personal communication, from Bruce Brown, ANL). It is not clear that Argonne National Laboratory's peer review standard are equivalent to those elsewhere.
3.3.2. Synchrotron Sources
Table 3.6 provides statistics on the synchrotron sources in the United States and other G-7 countries based on a recent report from a DOE advisory committee (DOE, 1997).
Table 3.6 Synchrotron Light Source Operations in G7 Countries
|
G7 Country |
Number of Synchrotron Light Rings |
Total SR Operations, million $ |
Operations, Cost/GNP, x 106 |
Operations Cost per Capita, $ |
|
USA |
9 |
183 |
27 |
0.73 |
|
Japan |
9 |
126 |
27 |
1.01 |
|
Germany |
6 |
55.5 |
29 |
0.68 |
|
France |
3 |
41 |
31 |
0.71 |
|
Italy |
2 |
32.6 |
29 |
0.57 |
|
UK |
2 |
41.8 |
40 |
0.72 |
|
Canada |
1 |
8.7 |
15 |
0.30 |
|
SOURCE: Adapted from Table D-1 of the Report of the Basic Energy Sciences Advisory Committee Panel on DOESynchrotron Radiation Sources and Science, DOE, November 1997. |
||||
NOTES:
• The number of synchrotron light rigs is the number of Synchrotron light source rings in operation, under construction, and expected to be approved. For European countries contributing to the European Synchrotron Light Source (ESRF) in Grenoble, France, ESRF is counted once for each country (Germany, France, Italy, UK). Industrially operated rings are not included.
• US Total includes the four DOE-funded facilities (Advanced Light Source (ALS) at Lawrence Berkeley National Laboratory, Advanced Photon Source (APS) at Argonne National Lab, National Synchrotron Light Source (NSLS) at Brookhaven National Lab, and Stanford Synchrotron Radiation Laboratory (SSRL) at Stanford University), two NSF-funded facilities (University of Wisconsin Synchrotron Radiation Center (Aladdin) and Cornell High Energy Synchrotron Source (CHESS), the CAMD facility at Louisiana State University and the SURF facility at NIST.
• Japan total includes the Photon Factory in Tsukuba, Spring-8 in Kamigori, and UVSOR in Okazaki. No operations costs were available for facilities at the Electrotechnical Laboratory (INIJI II, NIJI IV, and Teras) in Tsukuba, HISOR in Hiroshima, and Suburu in Himeji. Costs for industrially operated facilities (Sumitomo, NTT, Mitsubishi, IHH) not included.
• Germany total includes DELTA at the University of Dortmund and HASYLAB at Hamburg, projected costs of ANKA at Karlsruhe (estimated to be operational in 2000) and BESSY II in Berlin (estimated to be operational in 1999) and the ESRF contribution. It does not include expenses for BESSY I in Berlin which will be replaced by BESSY II. It also does not include the synchrotron at the University of Bonn. HASYLAB is an integral Part of the DESY laboratory, which is primarily a high-energy physics laboratory; the HASYLAB costs were estimated as a percentage of total DESY operations.
• France total includes operations/improvement expenses for the LURE source at Orsay and the ESRF contribution. it does not include expenses for the Soleil source (projected to become operational in 2003 but site not yet determined), which will largely, but not completely, replace LURE. The Soleil operations costs are expected to exceed those of LURE somewhat.
• Italy total includes Sincrotrone Trieste (ELETTRA) and the ESRF contribution. Costs for the Synchrotron radiation operations at the Daphne facility at the Frascati laboratory in Rome, from whom no data were received, are not included.
• UK total includes the Synchrotron Radiation Source (SRS) at the Daresburg Laboratory and the ESRF contribution.
• Canada total includes projected costs of the Canadian Light Source (CLS) at Saskatoon, Saskatchewan. Additional costs for Canadian beamlines at the University of Wisconsin Synchrotron Center (Aladdin) at Stoughton and the APS at Argonne are not included.
Synchrotron radiation (Ultraviolet and X-ray) is used in a variety of techniques (absorption, scattering, spectroscopy, and microscopy) to examine the intricate electronic, atomic, and geometric structures of many of materials. Such diverse problems as magnetic phenomena in thin films, the chain structure in polymer blends, and the electronic and bond structure of catalysts are being examined by synchrotron sources. There is some concern within the synchrotron radiation source community that the development of third-generation sources in Europe (such as ESFR and Elettra) will attract users away from second-generation sources in the United States, although such a reduction in demand has not yet occurred. Third-generation sources will not necessarily improve many experiment-limiting factors, such as flux limitations, detector capability, and source stability. Therefore, some argue that useful science can be expected from US synchrotron facilities for some years to come (Hart 1997). Furthermore, in many cases, Americans have access to facilities in Europe.
The DOE report assesses the cost -effectiveness of this research at DOE facilities and makes recommendations on funding priorities for these facilities.
3.3.3. Nanofabrication
Of particular interest to those involved in electronic materials is fabrication of nanostructures. For many years, university microelectronic designs have been tested by having MOSIS (the Metal-Oxide Semiconductor Implementation Service) build prototypes (Box 3.3). Although research and development programs for microelectromechanical systems (MEMS) exist at the National Center for Manufacturing Sciences (NCMS) and Sandia National Laboratory and are developing elsewhere, there is a growing demand for funding similar facilities for MEMS.
|
Box 3.3: The MOSIS Service The Metal-Oxide Semiconductor Implementation Service (MOSIS), based out of the Jet Propulsion Laboratory, is a low-cost prototyping and small-volume production service for custom and semicustom (VLSI) circuit development. Since its start, MOSIS has processed more than 30,000 integrated-circuit designs through several fabricators and technologies. MOSIS collects designs from different sources, so individual designers can purchase small quantities by sharing the cost of fabrication. Instead of paying more than $50,000 for a dedicated run, users can get four packaged parts for a few hundred dollars. These prices dramatically lower the risk of VLSI prototyping. Third-and fourth-year university undergraduates, and sometimes first-year graduate students, can design circuits to send to a MOSIS organization, which makes the “chips” and sends them back. The small businesses that use MOSIS have complete design security, even though the chip is shared. By subcontracting for fabrication, MOSIS provides designers with a single interface to the US semiconductor industry, an industry known for its variety of interfaces and rapid technological changes. Using MOSIS drastically reduces the risk, time and cost of system development based on custom and semi-custom integrated circuits. Source: Personal communication, B. Crowe, Defense Advanced ResearchProject Agency, November 1997. |
3.3.4. Computing
Computational research and engineering involving large-scale supercomputers and computer networks is of growing importance in solving materials problems at all scales from the subatomic to the macroscopic. Considerable progress has been made in developing models and simulations of complex materials phenomena based on first principles. Models and simulations are finding increasing use in supercomputer performance simulations of large-scale systems. Box 3.4 provides an example. However, important simulation and modeling research can be done even without a
supercomputer.
3.3.5. Smaller Scale Facilities
Large facilities are an important leadership determinant, but the availability of smaller scale facilities also is critical, especially when they can be located near top researchers in that field. Some examples of small-scale facilities are x-ray characterization, surface analytic (ESCA, Auger), scanning probe instruments (STM, STS), crystal growth, and optical characterization. Many international awards, including Nobel prizes in physics and chemistry have been earned by researchers who used small-scale equipment. The plight of research universities in maintaining their facilities and instrumentation has been well documented. There continues to be concern among top university researchers that facilities and equipment for materials research in several foreign universities now outclass those at most universities in the United States. Of particular concern is the need for modern equipment for materials synthesis and processing, where the United States is lagging behind Europe and Japan.
|
Box 3.4 A Cure for Composites Manufacturing an airplane wing or fuselage is expensive, requiring materials, time, and energy to produce. If a wing or fuselage is flawed, it can exact a high cost. A group at the National Center for Supercomputing Applications (NCSA) at the University of Illinois, Urbana-Champaign, is attempting to reduce costly mistakes by improving one step in most manufacturing process—composite curing. The curing process is like a baseball game: It can be dull until there is a home run. The bulk of the curing chemical reaction occurs in a relatively short period (146–150 minutes), during which the temperature jumps sharply and so does the degree of cure. Researchers at NCSA use a supercomputer to simulate a curing process called thermosetting to detect causes of common weaknesses, such as delaminations, in fiber–epoxy composites. If they know what causes structural failures in these materials, they can determine how to modify manufacturing to eliminate weaknesses. Composites are put into service in flight vehicles, automobiles, boats, pipelines, buildings, roads, bridges, and dozens of other products. In addition to experimenting with manufacturing and curing processes, researchers are finding ways to improve other qualities of composites to make them strong, lightweight, durable, and inexpensive to produce. Successfully manufacturing a composite requires the correct combination of temperature, pressure, and curing time. To find the best process for each material and service condition, several curing processes are tried and the materials are tested. Curing tests can be simulated on supercomputers in relatively less time than is needed for laboratory tests. Simulations also save on the costly consumption of materials in the laboratory. Physical tests must still be performed, but less often, and their role is trimmed to determining material properties and validating computer simulations. Aside from saving time and money, the simulations allow scientists to use helpful but complex mathematical methods, such as finite-element analysis, that would be almost impossible to use efficiently without parallel processing. Scientists use parallel processing to calculate temperatures, pressures, and displacements in thousands of composite sites simultaneously. Also, the simulations can provide scientists with information, about such things as a composite's internal stresses, that is difficult to obtain from actual tests. In the future, composites will be simulated by virtual reality—an interactive, three-dimensional form of visualization—so that researchers can manipulate the manufacturing environment for optimum results. These simulations will offer the same advantages as those currently in use, but they will offer the advantage of an up-close, hands-on experience. Source: Adapted from A Cure for Composites by Angela Bottum, supercomputing center website, University of Illinois. http://access.ncsa.uiuc.edu/Features/Composites/Composite.htm |
3.4. Centers
Centers have become a key mechanism for supporting materials science and engineering research as they bring together researchers from many disciplines in one location. Several are supported by NSF:
-
Materials Research Science and Engineering Centers (MRSECs),
-
Science and Technology Centers (STCs),
-
Engineering Research Centers (ERCs), and
-
Institute for Mechanics and Materials (IMM).
MRSECs support interdisciplinary and multidisciplinary materials research and education. These centers have strong links to industry and other sectors and their goal is to establish a national network for university-based research. There are several major research areas:
-
Surfaces (dynamics, reactions, catalysis);
-
Structural materials, interfaces, grain boundaries, nanomechanics;
-
Polymeric materials, polymer science;
-
Electronic and optical–photonic materials;
-
Superconductivity, low temperature phenomena;
-
Magnetic materials and structures;
-
Nanophase and nanostructured materials, mesoscopic systems;
-
Phases, phase transformations, order–disorder;
-
Biomolecular materials, self-assembly, colloids;
-
Advanced computation, modeling, materials theory; and
-
Materials design synthesis and processing.
Eleven MRSECs were established in 1994; 13 more were established in 1996.
In addition to direct funding of materials research, universities can enter an NSF-wide competition to establish STCs and ERCs. Past COSEPUP (1996) and NAE (1989) reports have evaluated these activities. These programs are still soliciting new proposals.
Several STCs that focus on materials science and engineering research:
-
Center for Quantized Electronic Structures (Quest),
-
Center for Superconductivity,
-
Advanced Liquid Crystalline Optical Materials (ALCOM), and
-
Center for High Performance Polymeric Adhesives and Composites.
Current ERCs include
-
Center for Particle Science and Technology,
-
Center for Interfacial Engineering,
-
Center for Advanced Electronic Materials Processing, and
-
Center for Plasma Aided Manufacturing.
IMM was established in 1992 by NSF to promote interaction between the mechanics and materials communities by fostering activities of industrial relevance. The institute's office is at
the University of California-San Diego but its activities and resources are scattered around the nation and the world. IMM's activities include workshops, short courses, and summer schools; scientific visits; planning meetings; and outreach and educational programs focused on a different theme each year. Recent themes have included scale-dependent mechanical phenomena in materials; aging, deterioration, and accelerated testing of materials; and material behavior in product and structural design.
All of these centers have strong multidisciplinary components, and they aid essential university–university and university–industry interactions at the doctoral and postdoctoral level.
3.5. Human Resources
As materials have taken on a more critical role in communications, transportation, and weapons, for example, the need for highly trained scientists has increased. Figure 3.1 shows the number of doctoral degrees awarded by US institutions for materials science and engineering from 1986 to 1995. However, as noted earlier, although materials science and engineering has grown as a distinct academic discipline, many researchers in the field have degrees in other areas.
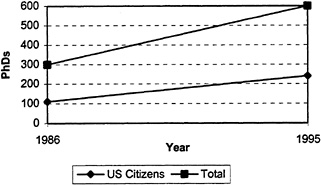
Figure 3.1 Materials Science and Engineering PhDs Awarded, 1986-1995
The chart shows the number of doctorates awarded overall and those awarded to US citizens. The percentage going to citizens has remained at 40% for the period. Much has been written about dependence on noncitizens and whether it should be of concern. With the growth of high-tech education and industry in the Asian countries from which many of these noncitizens come, it seems probable that opportunities will expand for their return to their own countries, thereby reducing the net supply of trained scientists in the United States.
Table 3.7 and Table 3.8 provide information on employment and occupational status, respectively, of PhDs in materials science in the United States. Figure 3.2 shows employment status. More than 60% of graduates consistently go to work in industry.
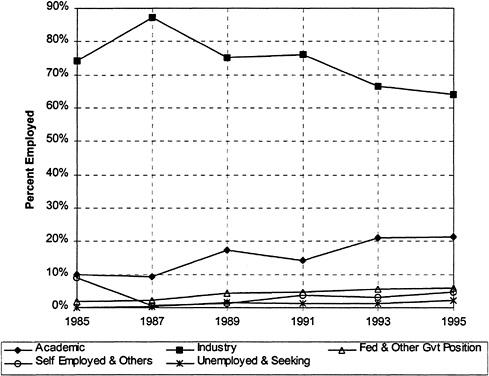
Figure 3.2 Employment Status of PhD Materials Scientists, 1985 1995
Source: Analysis conducted by the National Research Council's Office of Scientific and Engineering Personnel
ASM-International has compiled a listing of materials faculties (ceramics, materials, metallurgy, and polymers) at educational institutions around the world (except for those in the former Soviet republics). Of these faculties, 169 are in North America (126 in the United States, 32 in Mexico, 11 in Canada), 117 are in Western Europe (40 in France, 28 in Great Britain), 27 are in Eastern Europe (not including the former Soviet republics), 84 are in Asia (29 in Japan, 19 in China), and 21 are in South America (dominated by Brazil with 20). The 85 Accreditation Board for Engineering and Technology (ABET) accredited undergraduate programs in the United States are divided into three main groups. Fifty are in the materials engineering group (28 of these are designated materials science and engineering), 22 are in the metallurgy group, and 11 are in the ceramic engineering group. One university has an accredited undergraduate program in welding engineering and there is 1 in plastics engineering. Two-thirds of the materials-related faculties at US institutions offer undergraduate degree programs.
Table 3.7 US Employment Status of Materials Science and Engineering PhDs, 1985-1995
|
Survey Year |
||||||
|
1985 |
1987 |
1989 |
1991 |
1993 |
1995 |
|
|
Tenured and tenure track faculty |
92 |
95 |
249 |
209 |
337 |
426 |
|
Tenured Faculty |
46 |
52 |
146 |
89 |
173 |
248 |
|
Tenured Track Faculty |
46 |
43 |
103 |
120 |
164 |
178 |
|
Other Academic Positions |
30 |
33 |
40 |
134 |
198 |
269 |
|
Postdoc Appointments-Academic |
2 |
33 |
44 |
17 |
120 |
166 |
|
2 Year College Faculty |
0 |
0 |
0 |
0 |
0 |
0 |
|
Industry |
944 |
1495 |
1443 |
1946 |
2073 |
2592 |
|
Fed & Other Gvt Positions |
23 |
38 |
85 |
121 |
171 |
234 |
|
Self Employed & Others |
115 |
10 |
22 |
97 |
95 |
192 |
|
Postdoc Appointments-Other |
67 |
9 |
11 |
0 |
88 |
82 |
|
Unemployed & Seeking |
0 |
4 |
27 |
34 |
35 |
90 |
|
Elementary & High School Teachers |
0 |
0 |
0 |
0 |
0 |
0 |
|
Total |
1273 |
1717 |
1921 |
2558 |
3117 |
4051 |
|
Tenured and Tenure Track Faculty |
7.2% |
5.5% |
13.0% |
8.2% |
10.8% |
10.5% |
|
Tenured Faculty |
3.6% |
3.0% |
7.6% |
3.5% |
5.6% |
6.1% |
|
Tenured Track Faculty |
3.6% |
2.5% |
5.4% |
4.7% |
5.3% |
4.4% |
|
Other Academic Positions |
2.4% |
1.9% |
2.1% |
5.2% |
6.4% |
6.6% |
|
Postdoc Appointments-Academic |
0.2% |
1.9% |
2.3% |
0.7% |
3.8% |
4.1% |
|
2 Year College Faculty |
0.0% |
0.0% |
0.0% |
0.0% |
0.0% |
0.0% |
|
Industry |
74.2% |
87.1% |
75.1% |
76.1% |
66.5% |
64.0% |
|
Fed & Other Gvt Positions |
1.8% |
2.2% |
4.4% |
4.7% |
5.5% |
5.8% |
|
Self Employed & Others |
9.0% |
0.6% |
1.1% |
3.8% |
3.0% |
4.7% |
|
Postdoc Appointments-Other |
5.3% |
0.5% |
0.6% |
0.0% |
2.8% |
2.0% |
|
Unemployed & Seeking |
0.0% |
0.2% |
1.4% |
1.3% |
1.1% |
2.2% |
|
Elementary and High School Teacher |
0.0% |
0.0% |
0.0% |
0.0% |
0.0% |
0.0% |
|
Source: Analysis conducted by the National Research Council's Office of Scientific and Engineering Personnel of data from surveyof Doctorate Recipients (SDR) for this study. |
||||||
Table 3.8 US Occupational Status of Materials and Engineering PhDs, 1985-1995
|
Survey Year |
||||||
|
1985 |
1987 |
1989 |
1991 |
1993 |
1995 |
|
|
Total Research |
857 |
1062 |
1200 |
1507 |
2127 |
2379 |
|
Basic Research |
79 |
93 |
206 |
186 |
245 |
229 |
|
Applied Research |
713 |
801 |
793 |
914 |
1209 |
1244 |
|
Development |
65 |
168 |
201 |
407 |
673 |
906 |
|
Research Management |
251 |
250 |
244 |
349 |
N/A |
N/A |
|
Management Other |
26 |
0 |
4 |
29 |
N/A |
N/A |
|
Management |
N/A |
N/A |
N/A |
N/A |
351 |
501 |
|
Teaching |
10 |
39 |
79 |
90 |
187 |
284 |
|
Professional Services |
0 |
0 |
0 |
0 |
5 |
26 |
|
Consulting |
2 |
10 |
0 |
98 |
N/A |
N/A |
|
Computing |
N/A |
N/A |
N/A |
6 |
18 |
111 |
|
Other Work Activities/No Response |
127 |
352 |
367 |
445 |
394 |
660 |
|
Federal Support |
521 |
777 |
994 |
1107 |
970 |
1436 |
|
No Federal Support/No Response |
752 |
936 |
900 |
1417 |
2112 |
2525 |
|
Total |
1273 |
1713 |
1894 |
2524 |
3082 |
3961 |
|
Total Research |
67.3% |
62.0% |
63.4% |
59.7% |
69.0% |
60.1% |
|
Basic Research |
6.2% |
5.4% |
10.9% |
7.4% |
7.9% |
5.8% |
|
Applied Research |
56.0% |
46.8% |
41.9% |
36.2% |
39.2% |
31.4% |
|
Development |
5.1% |
9.8% |
10.6% |
16.1% |
21.8% |
22.9% |
|
Research Management |
19.7% |
14.6% |
12.9% |
13.8% |
N/A |
N/A |
|
Management Other |
2.0% |
0.0% |
0.2% |
1.1% |
N/A |
N/A |
|
Management |
N/A |
N/A |
N/A |
N/A |
11.4% |
12.6% |
|
Teaching |
0.8% |
2.3% |
4.2% |
3.6% |
6.1% |
7.2% |
|
Professional Services |
0.0% |
0.0% |
0.0% |
0.0% |
0.2% |
0.7% |
|
Consulting |
0.2% |
0.6% |
0.0% |
3.9% |
N/A |
N/A |
|
Computing |
N/A |
N/A |
N/A |
0.2% |
0.6% |
2.8% |
|
Other WorkActivities/NoResponse |
10.0% |
20.5% |
19.4% |
17.6% |
12.8% |
16.7% |
|
Federal Support |
40.9% |
45.4% |
52.5% |
43.9% |
31.5% |
36.3% |
|
No Federal Support/NoResponse |
59.1% |
54.6% |
47.5% |
56.1% |
68.5% |
63.7% |
|
Source: Analysis conducted by the National Research Council's Office of Scientific and Engineering Personnel of data from Surveyof Doctorate Recipients (SDR) for this study. |
||||||
The figures and tables presented here do not tell the complete story about graduates in materials-related programs, however. At the graduate level, some materials research and development programs occur in joint departments; others are department nonspecific. Part of the reason for this is the increasing role of computation in materials science and engineering, which often is carried out in other departments. Many PhD programs with a strong focus on materials are found in departments where materials is not the sole focus. This is particularly true for polymers, biomaterials, composites, catalysts, and electronic materials, among others. For example, there are 16 programs in polymer science in the United States, but most graduate students in polymers study in departments of chemistry and chemical engineering. Electrical engineering departments produce most of the graduates in semiconductor, magnetic, and optical– photonic materials. This makes an accurate accounting of the size and trends in graduate education difficult, but it does provide a picture of the diversity that enriches the field.
Data on women and minorities are shown in Table 3.9 and in Figure 3.3, Figure 3.4 and Figure 3.5. Table 3.7 shows that the percentage of women PhDs in materials-related subfields in the physical sciences is greater (17.4%) than is the percentage of women PhDs in materials-related subfields in engineering (15.9%). As a percentage of the total number of women PhDs in the physical sciences and engineering, the percentage of PhDs in materials-related subfields in the physical sciences (6.1%) is lower than is the corresponding percentage (15.3%) in engineering.
Table 3.10 shows that, among the G-7 nations,
-
Italy ranks first for percentage of first degrees to women in the natural sciences;
-
France ranks first for percentage of first degrees to women in engineering;
-
The United States ranks third for percentage of first degrees to women in the natural sciences as well as in the percentage of first degrees to women in engineering; and
-
Japan ranks last in percentage of first degrees to women in the natural sciences and engineering.
As shown in Figure 3.3, metallurgical–materials engineering has a significantly lower representation of black, non-Hispanic graduate students than do all-engineering (Figure 3.4) and the sciences (Figure 3.5). Metallurgical–materials engineering has a substantially greater representation of noncitizens among graduate students than do all-engineering and the sciences. The percentage of foreign students is only 7.1% lower than that of white, non-Hispanic graduate students.
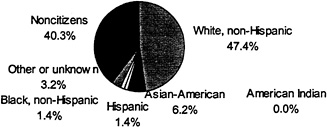
Figure 3.3 Metallurgical-Materials Engineering Graduate Students in All Institutions, by Race-Ethnicity and Citizenship, 1993
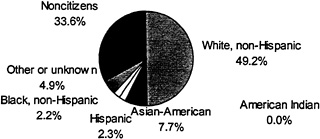
Figure 3.4 All Engineering Graduate Students in All Institutions, by Race-Ethnicity and Citizenship, 1993
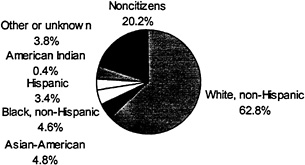
Figure 3.5 All Science Graduate Students in All Institutions, by Race-Ethnicity and Citizenship, 1993
Source: National Science Foundation, Women, Minorities, and Persons with Disabilities in Science and Engineering: 1996, NSF 96-311.
Table 3.9 Number of Doctorate Recipients by Gender and Subfield
|
Field and Subfield |
Number |
Percentage |
|||
|
Total |
Men |
Women |
Men |
Women |
|
|
Physical Sciences |
6,806 |
5,307 |
1,499 |
78.0 |
22.0 |
|
• Physics |
|||||
|
Polymer |
23 |
20 |
3 |
87.0 |
13.0 |
|
Solid-state and low temperature |
371 |
314 |
57 |
84.6 |
15.4 |
|
• Chemistry |
|||||
|
Polymer |
116 |
88 |
28 |
75.9 |
24.1 |
|
• Earth, atmosphere, and marine |
|||||
|
Minerology and petrology |
19 |
15 |
4 |
78.9 |
21.1 |
|
Totals |
529 |
437 |
92 |
82.6 |
17.4 |
|
Percentage of physical sciences |
7.8 |
8.2 |
6.1 |
||
|
Engineering |
6,007 |
5,313 |
694 |
88.4 |
11.6 |
|
• Ceramic sciences |
39 |
34 |
5 |
87.2 |
12.8 |
|
• Materials sciences |
476 |
392 |
84 |
82.4 |
17.6 |
|
• Metallurgical |
73 |
68 |
5 |
93.2 |
6.8 |
|
• Mining and mineral |
19 |
19 |
0 |
100 |
0 |
|
• Polymer and plastics |
58 |
46 |
12 |
79.3 |
20.7 |
|
Totals |
665 |
559 |
106 |
84.1 |
15.9 |
|
Percentage of engineering |
11.1 |
10.5 |
15.3 |
||
|
Source: Appendix A, Table A-1 from the NRC Survey of Earned Doctorates. |
|||||
Table 3.10 Percentage of First Degrees in Science and Engineering to Women, G-6 Nations
|
Country |
Natural Sciences |
Engineering |
|
Italy |
54 |
8 |
|
United Kingdom |
44 |
26 |
|
United States |
42 |
16 |
|
Germany |
40 |
11 |
|
France |
35 |
19 |
|
Japan |
19 |
4 |
|
Source: Table derived from S&E Indicators, Appendix Table 2-5 |
||
3.6. Funding
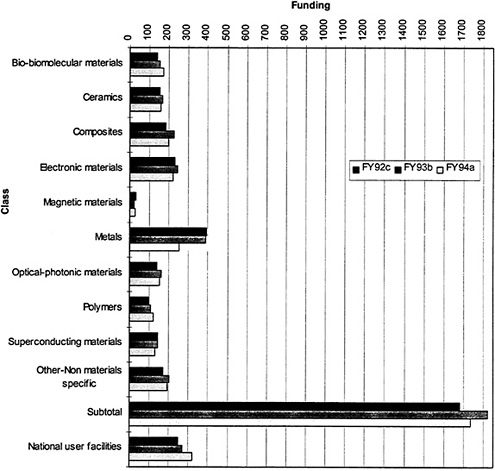
Figure 3.6 Federal R&D Budget by Materials Class, * US $ Millions
* Excludes classified research and development and most development activities funded under DOD's specific systems R&D programs.
-
President's budget request;
-
congressional appropriations;
-
actual expenditures
Table 3.11 Federal R&D Budget for Materials Research by Agency, US $1 Millions
|
Agency |
Year |
Total Program |
|
Department of Commerce |
FY94 a FY93 b FY92 c |
56.7 48.4 42.6 |
|
Department of Defense d |
FY94 FY93 FY92 |
421.7 557.7 530.9 |
|
Department of Energy d |
FY94 FY93 FY92 |
941.5 914.0 862.5 |
|
Department of the Interior |
FY94 FY93 FY92 |
21.5 24.9 25.2 |
|
Department of Transportation |
FY94 FY93 FY92 |
12.7 14.9 11.0 |
|
Environmental Protection Agency |
FY94 FY93 FY92 |
4.5 4.5 3.5 |
|
Health and Human Services |
FY94 FY93 FY92 |
92.9 85.9 79.6 |
|
National Aeronautics and Space Administration |
FY94 FY93 FY92 |
131.1 102.8 76.3 |
|
National Science Foundation |
FY94 FY93 FY92 |
328.0 303.6 265.6 |
|
United States Department of Agriculture |
FY94 FY93 FY92 |
45.8 37.4 36.3 |
|
Total program includes construction and operating costs for major national user facilities. a President's budget request. b Congressional appropriations. c Actual expenditures. d Excludes classified research and development and most development activities funded under DOD's specific systems R&D programs. |
||
Obviously, adequate funding is a necessary element of any research effort. Because the US innovation system has many funding sources and because materials science is a diverse field, it is difficult to determine the amount of funding, much less judge its adequacy. During the Bush Administration, the Federal Coordinating Council for Science, Engineering, and Technology (FCCSET) undertook a broad analysis of federal support in several research areas, one of which was materials. The results for all agencies for fiscal years 1992, 1993, and 1994 are shown in Figure 3.6 and Table 3.11. Updated information for NSF's Division of Materials Research is
shown in Figure 3.7. The average annualized award size for that division compared with others within NSF's mathematics and physical sciences directorate is shown in Figure 3.8. At about $125,000 each, awards for materials research were exceeded only by physics awards at about $170,000 each. Figure 3.9 shows the budget for permanent equipment, which in 1996, was about $18 million. Approximately 20% of the fiscal year 1998 request from NSF was for facilities.
Materials research and development is defined broadly here to include scientific and engineering research on substances in any form and at any stage of preparation, fabrication, manufacture, recycle, or disposal. Program types vary and include basic research and technology development, device or process development, and the gathering or analysis of data on various materials. The fiscal year 1994 budget contains significant activities in synthesis and processing and in theory, modeling, and simulation. These two components were emphasized in a major National Research Council (1989) study on materials science and engineering that incorporated considerable input from industry. The FCCSET study concludes that the budget provided adequate funding to achieve breakthroughs in energy, environment, health and safety, information and communication, infrastructure, national security, and transportation. However, this conclusion was reached before more recent drawdowns in federal investment in research and development (OSTP 1995).
The percentage of research and development investment for materials and industrial technology within the European Union increased from 11% in 1984 to 16% in 1987 and has stayed constant. Materials technologies constituted 9.1% of Eureka projects in 1992. Eureka is a cooperative effort in research and development (outside the European Union program) geared toward industrial and applied research and development (NSF 1996).
In general, it is important to note that several successful nations in high-tech industries (e.g. Japan) follow a different paradigm and strategy in allocating research resources.
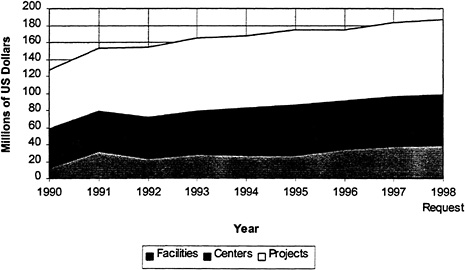
Figure 3.7 National Science Foundation Division of Materials Research Budget, 1990-1998, US $ Millions
Source: http://www.nsf.gov/mps/dmr/chart1.htm with updated information.
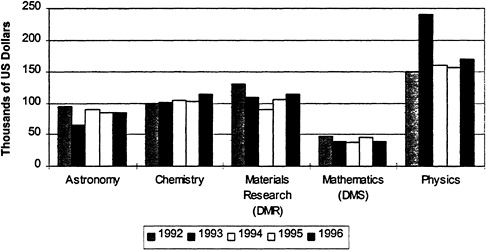
Figure 3.8 National Science Foundation Directorate for Mathematical and Physical Sciences, Average Annualized Award Size, Competitive Research Grants, 1992-1996, US $ Thousands
Includes instrumentation awards and programs such as PFF, NYVPYI, and CARCCR.
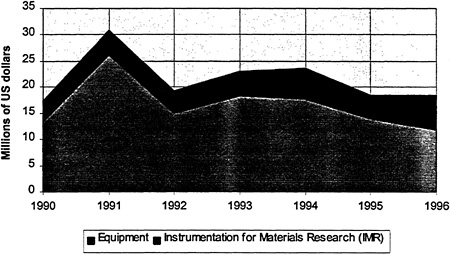
Figure 3.9 National Science Foundation Division of Materials Research, Permanent Equipment Budget, 1990-1996, US $ Millions
Source: http://www.nsf.gov/mps/dmr/chart1.htm with updated information.


