
2
BENCHMARKING RESULTS
2.1 Methods
The assessment of a country's relative standing in research performance is subject to multiple complexities. Many measures could be used to evaluate the position of US-based research in immunology, but each suffers from generic or specific limitations. Such limitations include the collaborative and international scope of immunological research, which makes the drawing of national lines somewhat arbitrary; the inequality inherent in of comparing a large, common enterprise with multiple smaller ones; and the difficulties of sifting information on the specific field of immunology from that on related research fields in large, aggregate databases. In addition, in the case of this panel's operations, budget and time constraints effectively ruled out any major undertakings to generate new data sets.
Within those constraints, the panel's strategy was to use three mainstream performance measures: reputation survey, citation analysis, and journal publication analysis it then relied on the convergence of findings to compensate for the specific shortcomings of each measure. Although these measures have some independence, the degree of independence could not be assessed because the panel could not compensate for all of the shortcomings of the methodology.
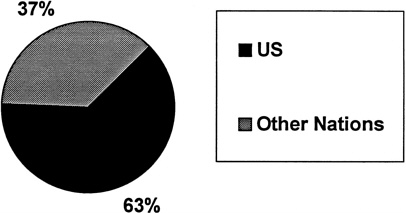
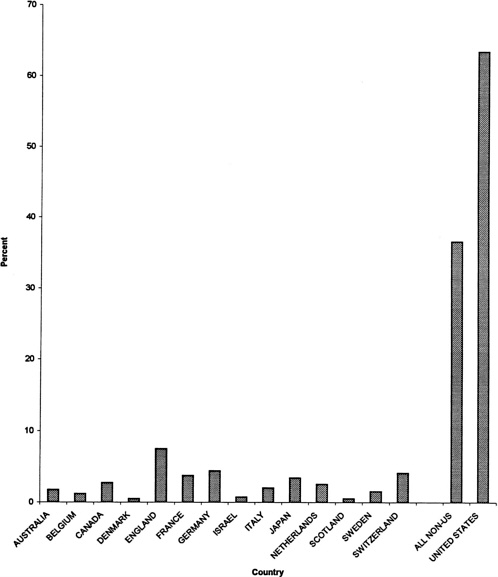
As shown in Figure 2.1 and Figure 2.2, the United States is clearly dominant in number of papers published in immunology. It produced 63% of the world's papers in immunology in 1981–1996; no other country produced 10%, and only one produced even 5%. Thus, comparisons are made in terms of the United States versus the rest of the world instead of country by country basis.
2.1.1 Reputation Survey
To estimate reputation, the panel conceived a virtual congress in which leading experts in immunology were asked to identify potential participants. Specifically, the field was divided into four major subfields–cellular immunology, molecular immunology, immunogenetics, and clinical aspects of immunology–and each was subdivided into four to 10 sub-subfields. The panel (composed of 11 US-based and three non-US-based scientists) then identified five to 15 respected leaders in each sub-subfield, based in the United States and in other countries, and polled each in person, by telephone, or by mail. The pollees were asked to imagine that they were about to organize an international congress session on their particular sub-subfield and to furnish a list of five to 20 potential speakers.
When the initial lists were considered, it became clear that there was a bias related to the laboratory location of the pollees: US-based investigators routinely named a higher percentage of Americans than did non-US-based investigators. The nationality of the poller also appeared to have an influence: the three non-US pollers often obtained a list moreenriched in non-US speakers. Thus, additional subfield leaders were polled to approximate a 50:50 US: non-US ratio.
An advantage of our approach is that it incorporates the opinions of a variety of respected members of the immunology community: up-and-coming leaders as well as established ones, investigators from all over the world, and leaders of all sub-subfields, both basic and clinical. The disadvantages are multiple: variable modes of polling, a variable sample size that was usually too small to allow statistical treatment of the data, lack of objective criteria, and nonproportionate sampling of researchers in countries outside the United States.
2.1.2 Citation Analysis
To identify the most frequently cited authors of immunologic research articles, a “high-impact” immunology database was commissioned from the Institute for Scientific Information (ISI). (See http://www.isnet.com/products/rsg/impact.html for more information on “high-impact” paper methodology.) The ISI database was scanned over the years 1990-1997. For each year, the 200 most-cited papers in journals relevant to the field of immunology were listed. The authors having more than five papers on the list were ranked according to average number of citations per paper (174 authors ranging from 70.2 to 638.5/paper), and the country of the laboratory of each was listed. In addition, panel staff determined whether each author was also cited on the virtual-congress lists.
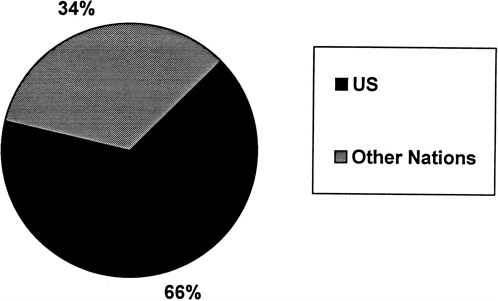
The contribution of the United States and other nations to immunology citations from 1981-1997 is shown in Figure 2.3. Of the 174 authors identified in the scan of the ISI database, 72% including the top 112 authors identified were in US-based laboratories. The ISI database indicates that US laboratories produced 63% of the papers, which garnered 66% of the citations, in journals relevant to immunology during the period 1981-1997.
The major strengths of this mode of analysis are its relative objectivity and its providing a basis of comparison with the virtual-congress polling data. However, the analysis suffers from some flaws related to the organization of the ISI database. Data from several of the top-level general journals (such as Cell) and immunology journals (such as Journal of Experimental Medicine) were not included. The panel found that the most serious limitation caused by interpreting the results obtained with this type of database is that the cited-paper analysis lists only the first author of each paper. The traditional author order in immunology puts the principal investigator last, so a graduate student or technician could have a better chance of appearing on the list of the most frequently cited papers than a principal investigator. The manner of referencing also males it difficult to know which country the particular research was done in. In addition, the list of authors is truncated after the first 15 names, possibly excluding authors who participated in large clinical trials. An additional limitation imposed by the database was that there was no breakdown according to subfield and sub-subfield of immunology.
2.1.3 Journal Publication Analysis
The panel identified four leading general journals (Science, Cell, Nature, and Blood) and one of the top journals focused specifically on immunology (Immunity). Panel members scanned the tables of contents of each of the journals for 1995-1997, identifying immunology papers in the general journals and the laboratory nationality of the principal investigator and the subfield in all the journals. In addition, a small sample from the Journal of Experimental Medicine was analyzed.
Additional journals–such as Nature Medicine, Lancet, Journal of Clinical Investigation, and New England Journal of Medicine–could have been analyzed as well but such an analysis was beyond the resources of this panel. Others–such as the European Journal of Immunology, Journal of Immunology (US), International Immunology (Japan), and Immunology (UK)–reflect mainly the country of research origin and so are not appropriate here.
This approach appears to be procedurally the least biased of the three. It does suffer from the usual weaknesses of any analysis based on publication data, including the dominance of English as the language of international discourse and the vagaries of the peer-review journal-acceptance process.
2.2 Results
Although the three criteria for evaluating US research efforts in immunology were quite distinct and had different strengths and flaws they led to basically the same conclusion: immunology research in the United States is pre-eminent in the world. The data supporting that conclusion are summarized below and in the following tables.
2.2.1 Reputation Survey
The data-collection measures for the different sub-subfields proved highly variable, including the number of pollees (3-17), the fraction of US-based pollees (41% - 83%), and the number of names cited per pollee (a few to more than 20). In addition, the database for the individual sub-subfields was far too small to permit any kind of statistical analysis. Those points are partially illustrated by some of the entries in Table 2.1. The panel decided to emphasize the data pooled by subfields in which there was generally much less variation in the data-collection measures, although attention was still paid to findings in the context of the sub-subfield groupings for any nuances of interest.
In all four subfields, a clear majority of the names cited were investigators directing US laboratories 60 - 70% in all cases. However, the position of leadership was not so evident in some domains, for example:
-
In cellular immunology, the sub-subfields of lymphocyte development and self-nonself recognition.
-
In molecular immunology, the sub-subfield of NK receptors.
-
In immunogenetics, the sub-subfield of inherited immunodeficiency.
-
In clinical aspects of immunology, the sub-subfields of tumor immunology and transplantation and immunosuppressive drugs.
In those domains, the proportion of US-based investigators was closer to 50%. The statistical significance of the differences could not be tested, but in general they correspond well to the collective opinion of the panel numbers.
Table 2.1 Immunology International Reputation Survey Results
|
Pollees |
Virtual-Congress Speakers |
||||||||||
|
Subfield |
Sub-subfield |
No. of Polles |
No. U.S. |
% US |
# Non-US |
No. Non-US |
No. |
No. US |
US |
No. Non-US |
% Non-US |
|
Cellular immunology and immunobiology |
1. Lymphocyte development |
17 |
7 |
41.2 |
10 |
58.8 |
189 |
98 |
51.9% |
89 |
47.1% |
|
2. Cellular interactions |
10 |
6 |
60 |
4 |
40 |
62 |
46 |
74.2% |
16 |
25.8% |
|
|
3. Self-nonself recognition |
11 |
6 |
54.5 |
5 |
45.5 |
122 |
59 |
48.4% |
62 |
50.8% |
|
|
4. Cellular traffic adhesion |
4 |
3 |
75 |
1 |
25 |
75 |
47 |
62.7% |
28 |
37.3% |
|
|
5. Host-parasite interactions |
x |
x |
x |
x |
x |
x |
x |
X |
x |
X |
|
|
6. Innate immunity |
5 |
3 |
60 |
2 |
40 |
67 |
49 |
73.1% |
18 |
26.9.% |
|
|
7. Mucosal immunity |
4 |
3 |
75 |
1 |
25 |
99 |
70 |
70.7% |
29 |
29.3% |
|
|
Molecular aspects of Immunology |
1. B- and T-cell genes |
8 |
3 |
37.5 |
5 |
62.5 |
113 |
65 |
57.5% |
47 |
41.6% |
|
2. NK receptors |
11 |
6 |
54.5 |
5 |
45.5 |
124 |
76 |
61.3% |
48 |
38.7% |
|
|
3. Receptors and tolerance |
8 |
6 |
75 |
2 |
25 |
71 |
51 |
71.8% |
20 |
28.2% |
|
|
4. Transcription |
8 |
4 |
50 |
4 |
50 |
88 |
72 |
81.8% |
16 |
18.2% |
|
|
5. Antigen uptake |
5 |
4 |
80 |
1 |
20 |
79 |
46 |
58.2% |
32 |
40.5% |
|
|
6. Structural analysis |
7 |
5 |
71.4 |
2 |
28.6 |
34 |
26 |
76.5% |
8 |
23.5% |
|
|
7. Apoptosis |
4 |
3 |
75 |
1 |
25 |
28 |
22 |
78.6% |
6 |
21.4% |
|
|
Immunogenetics |
1. Evolution of MHC |
x |
x |
x |
x |
x |
x |
x |
x |
x |
x |
|
2. Autoimmune disease |
4 |
2 |
50 |
2 |
50 |
63 |
41 |
65.1% |
22 |
34.9% |
|
|
3. Inherited immunodeficiency |
10 |
6 |
60 |
4 |
40 |
145 |
74 |
51.0% |
71 |
49.0% |
|
|
4. Neoplastic immune disorders |
6 |
5 |
83.3 |
1 |
16.7 |
61 |
41 |
67.2% |
20 |
32.8% |
|
|
Clinical aspects of immunology |
1. Immunopathologies and immune interventions |
13 |
8 |
61.5 |
5 |
38.5 |
258 |
157 |
60.9% |
99 |
38.4% |
|
2. Tum or immunology |
4 |
2 |
50 |
2 |
50 |
34 |
26 |
76.5% |
8 |
23.5% |
|
|
3. Transplantation and immunosuppressive drugs |
13 |
7 |
53.8 |
6 |
46.2 |
189 |
108 |
57.1% |
81 |
42.9% |
|
|
Source: Nonrandom polling data obtained by panel members interviewing equal numbers of US and non-US immunologists whose research the panel members felt had made significant contributions to specific subfields of immunology. The chosen immunologists (pollees) were instructed to select other prominent immunologists in their subfields that they would invite to talk at a virtual immunology conference. Invited researchers are referred to here as virtual congress speakers. Both the polles and virtual congress speakers remain anonymous and are reported as frequencies and percentages of US and non-US researchers in table. Percentage might not add to 100%, because of rounding errors or missing data. X= data insufficient. |
|||||||||||
2.2.2 Citation Analysis
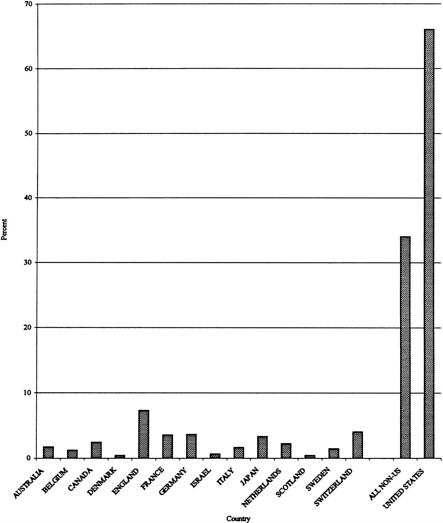
The results of the panel's citation analyses are shown in Figure 2.4 and Table 2.2. As shown in Figure 2.4, the top 3 countries for the immunology field based on percentage of the world's citations from 1981-1997 in immunology are
-
United States
-
England
-
Switzerland
Another measure that can be used is relative citation impact (RCI). RCI is the country's share of the world's citations in the field, divided by its share of world publications in the field. It can be thought of as a comparison of a country's citation rate for a particular field with the world 's citation rate for the field. A relative citation impact greater than 1 shows that the country's rate for the field is higher than the world's. Some believe RCI is a measure of both the influence and the visibility of a country's research (as disseminated through publications) and it gives some indication of the quality of the average paper. As shown in Table 2.2, the top 3 countries based on relative citation index for 1981-1997 are
-
United States
-
Belgium
-
Australia
A bit disconcertingly, only 54% of the authors identified in the ISI Immunology the high impact citations were also cited in the survey conducted by the panel. The discrepancy can probably be attributed to flaws in the two approaches, in particular such defects in the ISI database as the exclusion of critical journals and the use of only the first author in the citations.
2.2.3 Journal Publication Analysis
The results of the journal publication analysis are shown in Table 2.3-Table 2.7. US-based investigators produced about three-fourths of the immunology papers published in the journals Cell, Science, and Immunity in 1995-1997. US-based researchers contributed about two-thirds of the immunology papers published in Nature in 1995-1997. In contrast, scientists in countries other than the United States published more immunology articles in Blood than US-based researchers in those years (54% and 46%, respectively). The immunological subfield in which a international presence was especially strong was immunogenetics for the papers published in Cell and Blood. However, in Nature, Science, and Immunity, US-based researchers published more papers in immunogenetics than non-US-based researchers. The United States had more papers published in all five journals in the subfield of molecular immunology. The subfield of cellular immunology and clinical aspects were dominated by US-based researchers in all journals examined except Blood. Because of its extensiveness, only 6 months of the Journal of Experimental Medicine was analyzed, as shown in Table 2.8.
2.3 Summary
According to all three evaluation methods, US-based research in immunology plays a dominant role in the worldwide effort. Within the limitations of each measure and the limits of the panel's use of them, the data produce a strikingly consistent outcome: all three approaches assigned a 2:1 to 3:1 dominance vis-a-vis the rest of the world. Of course the dominance needs to be weighed in relation to the relative richness of the United States in numbers of investigators, institutions and resources.
Table 2.2 Relative Citation Impact of High Impact Papers in Immunology, by Country, 1981-1997
|
Country |
No. Citations |
Fraction of World's Citations |
No. Papers |
Fraction of World's Papers |
RCIa |
|
UNITED STATES |
632,326 |
66.03 |
2,360 |
63.39 |
1.04 |
|
BELGIUM |
11,626 |
1.21 |
44 |
1.18 |
1.03 |
|
AUSTRALIA |
16,701 |
1.74 |
65 |
1.75 |
1.00 |
|
SWITZERLAND |
38,487 |
4.02 |
153 |
4.11 |
0.98 |
|
ENGLAND |
69,645 |
7.27 |
278 |
7.47 |
0.97 |
|
JAPAN |
31,689 |
3.31 |
127 |
3.41 |
0.97 |
|
FRANCE |
33,877 |
3.54 |
139 |
3.73 |
0.95 |
|
SWEDEN |
13,865 |
1.45 |
57 |
1.53 |
0.95 |
|
CANADA |
23,329 |
2.44 |
101 |
2.71 |
0.90 |
|
ISRAEL |
6,098 |
0.64 |
27 |
0.73 |
0.88 |
|
NETHERLANDS |
21,378 |
2.23 |
95 |
2.55 |
0.87 |
|
DENMARK |
3,910 |
0.41 |
18 |
0.48 |
0.84 |
|
GERMANYb |
34,927 |
3.65 |
164 |
4.41 |
0.83 |
|
ITALY |
15,746 |
1.64 |
75 |
2.01 |
0.82 |
|
SCOTLAND |
4,009 |
0.42 |
20 |
0.54 |
0.78 |
|
Totals |
957,613 |
-- |
3,723 |
-- |
-- |
|
Source: Calculated from data obtained from the Institute for ScientificInformation database on High Impact papers in Immunology. Notes: a RCI is the relative citation impact, a country's percentage of world citations divided by its percentage of world papers. Threshold set at minimum of 17 papers. |
|||||
Tables 2.3 Authorship of Immunology Papers in Blood, 1995-1997
|
Subfield |
No.(%) US |
No.(%) Non US |
Total |
|
Cellular immunology |
58(46.4) |
67(53.6) |
125 |
|
Molecular immunology |
47(54.7) |
39(45.3) |
86 |
|
Immunogenetics |
10(37.0) |
17(63.0) |
27 |
|
Clinical aspects |
158(44.5) |
197(55.5) |
355 |
|
TOTALS |
273(46.0) |
320(54.0) |
593 |
|
Source: Original analysis conducted for this report. Panel membersreviewed tables of contents and decided subfields of immunology ofeach paper. |
|||
Tables 2.4 Authorship of Immunology Papers in Cell, 1995-1997
|
Subfield |
No.(%) U.S. |
No.(%) Non U.S. |
Total |
|
Cellular immunology |
14(60.9) |
9(39.1) |
23 |
|
Molecular immunology |
45(75.0) |
15(25.0) |
60 |
|
Immunogenetics |
0(0) |
1(100) |
1 |
|
Clinical aspects |
12(75.0) |
4(25.0) |
16 |
|
TOTALS |
71(71.0) |
29(29.0) |
100 |
|
Source: Original analysis conducted for this report. Panel membersreviewed tables of contents and decided subfields of immunology ofeach paper. |
|||
Table 2.5 Authorship of Immunology Papers in Immunity, 1995-1997
|
Subfield |
No.(%) U.S. |
No.(%) Non U.S. |
Total |
|
Cellular immunology |
113(72.9) |
42(27.1) |
155 |
|
Molecular immunology |
145(78.3) |
40(21.6) |
185 |
|
Immunogenetics |
32(72.7) |
12(27.2) |
44 |
|
Clinical aspects |
26(81.2) |
6(18.7) |
32 |
|
TOTALS |
316(76.0) |
100(24.0) |
416 |
|
Source: Original analysis conducted for this report. Panel membersreviewed tables of contents and decided subfields of immunology ofeach paper. |
|||
Table 2.6 Authorship of Immunology Papers in Nature, 1995-1997
|
Subfielda |
No.(%) U.S. |
No.(%) Non U.S. |
Total |
|
Cellular immunology |
37(68.5) |
17(31.5) |
54 |
|
Molecular immunology |
48(61.5) |
30(38.5) |
78 |
|
Immunogenetics |
6(66.7) |
3(33.3) |
9 |
|
Clinical aspects |
9(64.3) |
5(35.7) |
14 |
|
TOTALS |
100(64.5) |
55(35.5) |
155 |
|
Source: Original analysis conducted for this report. Panel membersreviewed tables of contents and decided subfields of immunology ofeach paper. |
|||
Table 2.7 Authorship of Immunology Papers in Science, 1995-1997
|
Subfielda |
No.(%) U.S. |
No.(%) Non U.S. |
Total |
|
Cellular immunology |
44(67.7) |
21(32.3) |
65 |
|
Molecular immunology |
68(82.9) |
14(17.1) |
82 |
|
Immunogenetics |
6(60.0) |
4(40.0) |
10 |
|
Clinical aspects |
46(66.7) |
23(33.3) |
69 |
|
TOTALS |
164(72.6) |
62(27.4) |
226 |
|
Source: Original analysis conducted for this report. Panel membersreviewed tables of contents and decided subfields of immunology ofeach paper. |
|||
Table 2.8 Authorship of Immunology Papers in the Journal of Experimental Medicine, February 1996-July 1996
|
Subfielda |
No.(%) U.S. |
No.(%) Non U.S. |
Total |
|
Cellular immunology |
53(58.9) |
37(41.1) |
90 |
|
Molecular immunology |
61(77.2) |
18(22.8) |
79 |
|
Immunogenetics |
13(86.7) |
2(13.3) |
15 |
|
Clinical aspects |
37(64.9) |
20(35.1) |
57 |
|
TOTALS |
164(68.0) |
77(32.0) |
241 |
|
Source: Original analysis conducted for this report. Panel membersreviewed tables of contents and decided subfields of immunology ofeach paper. |
|||


