APPENDIX B
TRENDS IN INDUSTRIAL RESEARCH AND DEVELOPMENT: EVIDENCE FROM NATIONAL DATA SOURCES
Stephen A. Merrill and Ronald S. Cooper
R&D and Innovation Data
From an economic standpoint, industrial research and innovation are important primarily as contributors to economic growth, productivity, and welfare. Innovation refers broadly to the invention, commercialization, and diffusion of new products, processes, and services. Research and development (R&D) are only two of the factors that influence innovation and that we seek to understand and monitor so that, presumably, policymakers will be in a better position to stimulate technology development and its application.
Ideally, the collection of national and international data1 on innovation should be guided by a solid theoretical understanding of the process and its impacts. Such understanding of causes and effects, while being developed, is not very far advanced. It is possible, however, to elaborate a conceptual framework that encompasses direct indicators of innovation, influences on innovation, and its effects. Such a scheme is presented in Table B-1. The three broad categories of innovation information include (1) measures of innovative output—newly commercialized products, processes, or services and their characteristics; (2) factors that influence innovative activity such as the level of research effort, channels of
TABLE B-1 Inventory of Innovation Metrics
|
Category of Indicator |
Some Indicators/Metrics |
|
I. Direct Measures of Innovation (Used to show changes in the level, rate, direction, and composition of innovation—defined as the invention and commercialization of new products, processes and services.) |
|
|
|
|
|
|
|
|
|
|
|
|
|
|
|
|
|
|
|
|
II. Determinants of Innovation |
|
|
A. Industrial Innovative Effort |
|
|
|
|
|
|
|
|
|
|
|
|
|
|
|
|
|
|
|
|
B. Organization and Structure of Innovative Activity: Technical knowledge generation and transfer |
|
|
|
|
|
|
|
|
|
|
|
|
|
|
|
|
|
Category of Indicator |
Some Indicators/Metrics |
|
|
|
|
|
|
|
|
|
|
|
|
|
|
|
|
|
|
|
|
|
|
|
|
|
|
|
|
|
|
|
|
|
|
|
|
|
|
|
|
|
|
|
|
|
|
|
|
|
|
|
|
C. Legal and Market Conditions |
|
|
|
|
|
|
|
|
|
|
|
|
|
|
|
|
|
|
|
|
|
|
|
D. Technological opportunity: Vitality and relevance of the underlying scientific knowledge |
|
|
|
|
|
|
|
|
Category of Indicator |
Some Indicators/Metrics |
|
III. Impact of Innovation |
|
|
A. Productivity |
|
|
B. Employment—job creation and destruction, skill biases, wage levels |
|
|
C. Firm and industry performance (profits, competitiveness) |
|
|
|
|
|
|
|
|
D. Economic growth (national, regional development) |
|
|
E. Social welfare effects, human capital development (e.g., effects of information technologies access and use) |
|
knowledge flows, the means of appropriating innovation results, relevant industry structure and market conditions, and technological opportunities; and (3) the impact of innovation on firms, regions, workers, and the economy as a whole.
As it happens, there are important variables on which no data are currently collected on a national basis and regular schedule for major sectors of the economy. These gaps include but are not limited to direct measures of innovation (e.g., newly commercialized products, processes, and services); extent of use of new processes, products, and services (i.e., diffusion); and investments other than R&D necessary for successful innovation (e.g., innovation-related spending on design, engineering, production, and marketing). Apart from scientific and engineering publications, data are lacking on the many informal channels of transferring know-how within the firm, between customers and sellers, and across competing firms. Similarly, we have few reliable data on the career mobility and structure of work of industrial scientists and engineers, as distinct from their formal educational qualifications and employment status; and we lack measures of the technological opportunities underlying important innovations.
In contrast, R&D expenditure statistics are available from several sources. The principal sources are the National Science Foundation's annual survey of corporate R&D carried out by the Bureau of the Census; publicly held companies' 10K form filings with the Securities and Exchange Commission (SEC) and made available by Compustat; data collected over the past six years by the Center for Innovation Management Studies (CIMS) of Lehigh University from firms affiliated with the Industrial Research Institute (IRI); and other private surveys (e.g., McGraw-Hill, Battelle Memorial Institute). There are notable differences
in coverage and in disaggregation among these datasets. The principal differences include the following:
- Universe of firms surveyed:
-
- The National Science Foundation's (NSF) RD-1 survey includes private as well as publicly held companies, for activities carried out in the United States only. Reporting of R&D funds spent in foreign locations is voluntary.
- Compustat's 10-K form data cover only publicly held U.S. companies but include their foreign operations. Excluded are U.S.-based operations of foreign firms.
- The IRI/CIMS survey collects R&D expenditure data from IRI member companies, which account for about 75 percent of U.S. industrial R&D but underrepresents small firms. Moreover, the response rate, especially to detailed questions, is quite low; only 30 companies responded to the survey in all of the past five years.
-
- Level of aggregation:
-
- NSF's RD-1 survey reports expenditures only at the firm level, and firms are requested to allocate their R&D across two- or three-digit level Standard Industry Classification (SIC) categories which are relatively nonhomogeneous.
- Compustat data are primarily at the firm level but contain some business segment detail.
- The IRI/CIMS survey collects data at the company and business segment levels. R&D expenditures are categorized at the four-digit SIC level, but the survey's response rate is generally too low to be considered representative of any sector of the economy.
-
- Character of innovative activity:
-
- NSF surveys of both public and private R&D expenditures classify activities as basic research, applied research, and development, which are defined in standard ways. NSF's RD-1 survey no longer asks for a short-term/long-term breakdown of expenditures or the fields of industry-funded basic research.
- Companies are not required to report information on the character of R&D work to the SEC.
- The CIMS R&D survey breaks expenditures down by basic/applied/development and uses a fourth category, ''technical services.''
In addition, administrative data exist on industrial R&D collaborations among companies and between companies and federal laboratories. The former consist of registrations of agreements with the Department of Justice under the National
Cooperative Research and Production Act. The latter are counts of so-called cooperative research and development agreements, or CRADAs. Tabulations of certain media-reported events such as the formation of strategic alliances between international firms are maintained on a regular basis.
The relative abundance, industry and firm detail, consistent collection, and broad industry coverage of R&D data drive much of the analysis of industrial innovation, although in the conceptual scheme described above they are not a direct measure of innovation. Here the objective is simply to assess more systematically what is known about recent trends in R&D, particularly the research component, from national data collected and reported by the federal government and other organizations. 2 In addition to partially illuminating some trends, this exercise reveals significant limitations and gaps even in R&D information. How to overcome these limitations that hamper our understanding of R&D trends was one of the subjects of a Board on Science, Technology, and Economic Policy (STEP) on industrial research and innovation indicators for public policy (Cooper and Merrill, 1997).3
Innovation Trends
It is evident from the above inventory that the pattern, determinants, and effects of innovation involve variables that change over time, sometimes remarkably quickly and radically. At no time has that been more apparent than in recent years. There has been a great deal of discussion about changes in innovation processes. Several general trends are often presumed to be rapid, substantial in magnitude, and consequential to economic performance, both positively and negatively. These changes include (1) shifts in the industry and technology distribution of innovative activity, (2) shifts in the time horizon of innovative effort and investment or the orientation of innovation, (3) changes in the organizational structure of innovative activity, and (4) changes in issues concerning the location of innovative activity both within the United States and globally.
The hypothesized changes and the concerns associated with them are as follows:
- Industry distribution:
-
- The sectoral and technological distribution of U.S. industrial research and innovation is shifting toward nonmanufacturing and new emerging industries and technologies. This is of concern to the extent that some industries are becoming less innovative.
-
- Orientation:
-
- U.S. firms have been conducting less fundamental research with longer-term payoffs, focusing instead on more incremental innovative efforts with clear market applications and generally shorter time horizons. If this is widespread and continues, it may lead to a weakening of U.S.-located innovative capacity in the long-term. In the near-term it may have enhanced firms' performance.
-
- Organization:
-
- In-house R&D activities have been decentralized as firms have shifted away from the central R&D lab model. Decentralization of intrafirm innovative activity may have resulted in greater integration of R&D with corporate strategy and with other business units (product design, marketing, etc.), but unique technical resources of central corporate laboratories may have been lost in the process.
- Collaboration in and outsourcing of research and innovation are increasing, both among firms and between firms and universities and government laboratories (contracting, research joint ventures, licensing agreements, strategic alliances). This may improve the efficiency of innovative activities by reducing redundancies and accelerating implementation and diffusion. On the other hand, it may also involve a "hollowing-out" of companies' innovative capacity, with possible negative effects on long-term corporate competitiveness. The role of universities as the principal performer of basic research appears to be changing as university-industry collaboration increases. This may facilitate the application of academic research results but may also undermine the autonomy and distort the mission of universities.
-
- Location:
-
- As firms continue to outsource many of their innovation-related activities and work closely with universities and other public and private research centers, successful innovation appears to depend increasingly on geographically clustered networks of related organizations. Substate regions such as Silicon Valley, Research Triangle Park, and Austin, Texas, prosper while other regions without the key infrastructure may experience economic decline.
- Firms in some industries have shifted R&D capacity abroad and entered
- into alliances with foreign firms, possibly gaining access to human talent, technology, and markets but also reducing the likelihood of U.S. location for industry growth. At the same time, foreign firms have invested more in U.S.-based R&D activities.
Overall R&D Effort
Private-sector R&D spending was relatively static in the first half of the 1990s, but then, in contrast to the pattern in federal R&D, spending accelerated at a rate of 9 percent in 1995 and 1996 and is estimated to have increased 4 percent in 1997 and 7.7 percent in 1998 (see Table B-2).
Industry Distribution of R&D
The most striking recent change in industrial R&D effort, in part a function of the change in the National Science Foundation's survey sample, is the sharp increase in the service sector's share of total industry-funded R&D, from 8.4 percent in 1987 to approximately one-quarter in 1995. In all probability, firm-level rather than business segment reporting in the NSF survey and the SEC filings results in an underestimate of the amount of services, particularly information technology-related R&D, inasmuch as the service functions in many major industrial corporations have expanded. At the same time, this expansion has
TABLE B-2 Corporate-Funded R&D Performance by Industry (millions of current dollars)
|
|
Total Corporate R&D Funding |
Basic Research |
Percent |
Applied Research |
Percent |
Ratio of R to D |
|
1985 |
57,043 |
2,373 |
4.2 |
12,908 |
22.6 |
26.8 |
|
1986 |
59,932 |
3,496 |
5.8 |
15,082 |
25.2 |
31.0 |
|
1987 |
61,403 |
3,583 |
5.8 |
15,153 |
24.7 |
30.5 |
|
1988 |
66,672 |
3,507 |
5.3 |
16,531 |
24.8 |
30.1 |
|
1989 |
73,501 |
3,832 |
5.2 |
17,993 |
24.5 |
29.7 |
|
1990 |
81,602 |
3,760 |
4.6 |
18,432 |
22.6 |
27.2 |
|
1991 |
90,580 |
6,125 |
6.7 |
21,425 |
23.6 |
30.3 |
|
1992 |
94,388 |
5,816 |
6.2 |
21,184 |
22.4 |
28.6 |
|
1993 |
94,591 |
5,961 |
6.3 |
19,956 |
21.1 |
27.4 |
|
1994 |
97,131 |
6,078 |
6.3 |
19,372 |
19.9 |
26.2 |
|
1995 |
108,652 |
5,379 |
5.0 |
23,755 |
21.9 |
26.9 |
|
1996 |
121,015 |
6,848 |
5.6 |
25,370 |
20.9 |
26.5 |
|
1997 |
133,611 |
8,766 |
6.5 |
29,782 |
22.3 |
28.8 |
|
Source: National Science Foundation (1999, Table A27). |
||||||
shifted some firms from the "manufacturing" to the "service" category where their continuing R&D related to tangible products and manufacturing processes is now counted. The reclassification of some major companies accounts in significant part for the sharp decline in expenditures and R&D intensity in office and computing machinery. This underscores that the distinction is increasingly artificial, especially but not exclusively at the firm level.
Within the "manufacturing" sector, in constant dollars and as a share of sales, since the late 1980s R&D has increased in most broad industrial sectors, including electrical components, telecommunications, drugs, and even metals and apparel and textiles. The most surprising increase in R&D spending has been in motor vehicles. On the other hand, expenditures and R&D intensity have declined sharply in chemicals (see Figures B-1 and B-2).
These relatively highly aggregated categories (primarily two-digit and in a few cases three-digit-level SIC) may obscure changes that would be apparent at a finer (e.g., four-digit SIC) level of detail, where the categories are more homogeneous. Two-digit categories especially contain heterogeneous products of very different levels of technological sophistication and R&D content. For example, "office computing and accounting equipment" includes calculating and adding machines as well as computers. "Professional and scientific instruments" encompasses photographic equipment as well as analytical and laboratory apparatus, and "electronic components'' includes tubes as well as semiconductors. Finally, ''other chemicals" includes soaps, detergents, and ink as well as fertilizers.
Changes in corporate rankings in R&D expenditure, on the other hand, show a much more focused trend—the growth of information technologies and pharmaceuticals, almost to the exclusion of other sectors. For example, among the top 50 U.S.-based companies in R&D spending in 1996, all of the companies advancing 10 places or more in the previous 10 years were in these two sectors (see Table B-3).
Orientation of R&D
The hypothesis of shortening corporate investment time horizons and greater risk aversion suggests that firms are spending less of their resources on long-range exploratory research and more on incremental improvements in existing products and processes. It is not clear that this corresponds to the categories of R&D activity in which data are routinely collected—primarily, basic research, applied research, and development—but this is the only classification of the character of R&D across industrial sectors.4
On the basis of what is known about the increase in international competition and cost pressure on firms, it would seem reasonable to assume that investment in basic research—the acquisition of general knowledge and exploration of funda-
|
4 |
See Appendix A for definitions. |
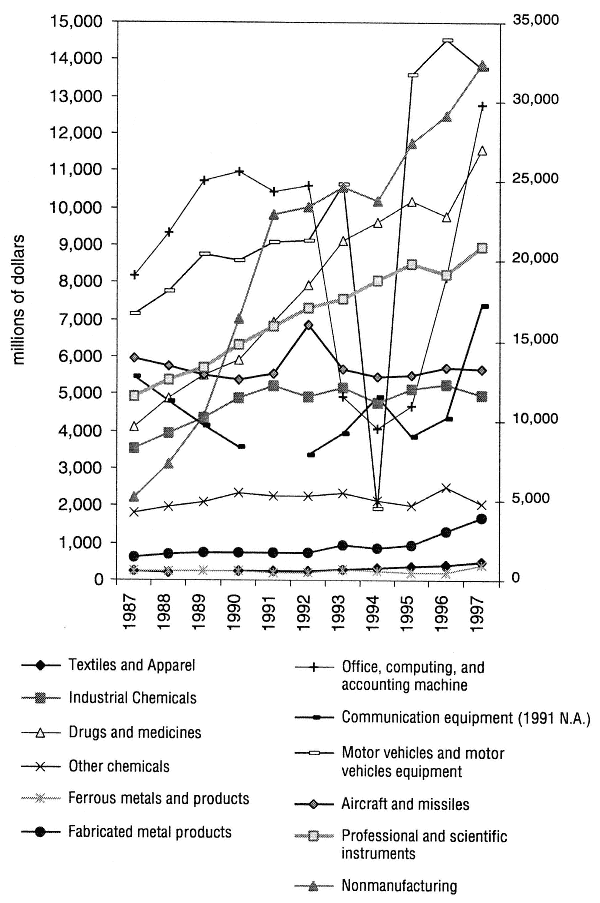
Figure B-1
Company and other (except federal) funds for industrial R& D performance, by industry: 1987–1997 (millions of dollars).
Note: Detailed data by specific service industries are available only after 1994. Industries shown are the subject of industry performance case studies commissioned by STEP and published in Mowery, ed., 1999. Right hand scale refers to nonmanufacturing only; left hand scale applies to all other industries.
Source: National Science Foundation (1999, Table A-7).
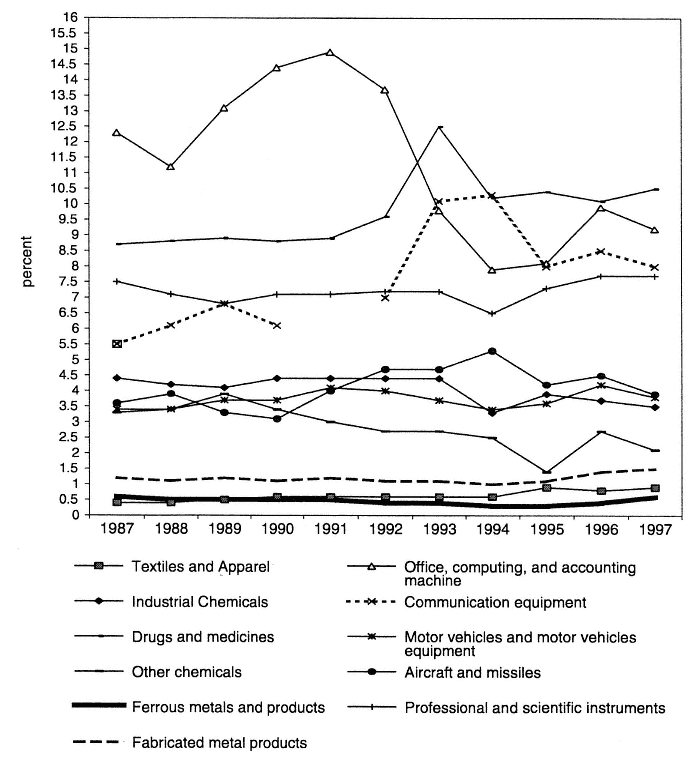
Figure B-2
Company and other (except federal) industrial R&D funds as a percent of net sales in R&D-performing companies, by industry: 1987–1997.
Note: Industries shown are the subject of industry performance case studies commissioned by STEP and published in Mowery, ed., 1999.
Source: National Science Foundation (1999, Table A-22).
TABLE B-3 Corporate R&D Expenditure Rankings (firms advancing ten places from 1986 to 1996)
|
Information Technology Firms |
Pharmaceutical Firms |
|
Motorola (20/5) |
Johnson & Johnson (18/8) |
|
Intel (46/9) |
Pfizer (31/10) |
|
Microsoft (—/13) |
Merck(22/12) |
|
Sun Microsystems (—/35) |
American Home Products (47/14) |
|
Apple Computer (75/37) |
Bristol Meyer Squibb |
|
Seagate Technology (—/42) |
Pharmacia & Upjohn (33/17) |
|
Applied Materials (—/44) |
Abbott Laboratories (38/19) |
|
Compaq Computer (—/48) |
Rhone Poulenc (—/29) |
|
Advanced Micro Devices (60/49) |
Schering Plough (53/33) |
|
Cisco Systems (—/50) |
Warner Lambert (58/38) |
|
|
Amgen (—/40) |
|
|
Genentech (—/46) |
|
Note: Numbers in parentheses are 1986 rankings (if in the top 100 companies) and 1996 rankings. Source: National Science Board (1998, Table A-23). |
|
mental concepts—has declined because of the difficulty of appropriating private returns and that investment in research generally—both basic and applied—has fared poorly relative to development expenditures. In fact, industrially funded basic research did decline in 1990 and again in 1995, both absolutely and as a share of corporate R&D, but the ratios partly reflected increases in total spending in 1995. In both cases, basic research subsequently recovered (Table B-2). The distinction between "basic" and "applied" research is sufficiently ambiguous and industry basic research is so modest, relatively speaking, that a better indicator of changing priorities, if any, is probably the ratio of total "R" to "R&D.'' This, too, dropped after 1991, although primarily as a result of reductions in applied rather than basic research. But the downward movement in research was quickly reversed in 1995 and subsequent years. In general, over the 1990s, the R share of industrial R&D is only slightly lower than it was at the end of the 1980s (see Figure B-3).
Organization and Character of R&D
The CIMS survey data suggest that there has been a shift in the locus of R&D activity—both funding and performance—to business units away from central organizations, perhaps reflecting shorter time horizons but yielding a closer coupling of R&D to product development. The percentage of R&D labs engaged in basic research declined from 1988 to 1996, and business segment labs do relatively less basic research than do corporate labs (Beau et al., 1998 and 1999).
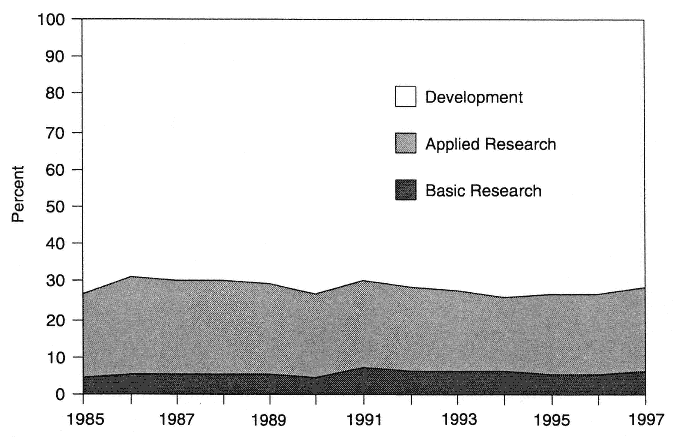
Figure B-3
Orientation of industry-funded R&D.
Source: National Science Foundation (1999, Table A-27).
As these observations suggest, the CIMS data have the potential to yield much more detailed information about R&D trends. Firms are asked to report R&D expenditures not only for business segments (at the four-digit SIC level) but also for individual laboratories and to identify whether the source of funds is a business segment or corporate headquarters. Product and process R&D are distinguished as are "technical services" relating to but not identical with R&D. Finally, spending data are linked to measures of innovative output, patent applications, patents, and share of unit sales attributable to new or improved products. Despite this detail, the severe limitation of the CIMS survey is the low response rate overall, especially to the more detailed questions about innovative outputs. For example, 81 firms accounting for 20 percent of U.S. industrial R&D reported usable data in 1997, but only 30 firms have consistently reported usable data over the five years of the survey.5
In addition to decentralization of R&D within firms, there appears to be a pattern across industry sectors of firms expanding their use of external sources of research and technology through a variety of collaborative arrangements with other firms, universities, and government labs. Because the spillovers entailed in
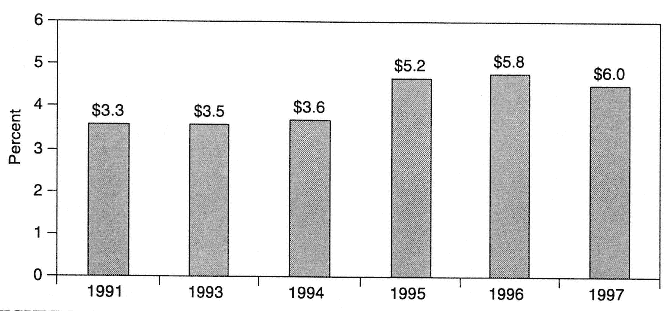
Figure B-4
Company R&D contracted out (as a share of total company-financed R&D).
Note: Figures above bars represent billions of dollars.
Source: National Science Foundation (1999).
external collaborations are thought to increase efficiencies and expand opportunities, they have been actively encouraged by governments at all levels.
The incidence of outsourcing and external collaborations and acquisitions via contracting, grants, joint ventures, mergers, strategic alliances, and other mechanisms almost certainly increased significantly in the 1980s and 1990s; but available data do not confirm that external sources of research and technology have become more important to firms relative to internal sources and the myriad channels of informal communications.
NSF data from the RD-1 survey show that companies spent $6 billion in 1997 for R&D conducted outside their firms, via contracts and other arrangements with independent companies, universities, and not-for-profit organizations, but this represented only 4.5 percent of corporate R&D, an increase of less than one percentage point in six years (see Figure B-4).
Industry support of university research, while growing and of increasing importance to the recipient institutions relative to other sources, 6 still represents less than 1 percent of total corporate R&D, and that small share remained steady throughout the 1990s (see Table B-4).
Data on the number of strategic technology alliances, research and development joint ventures, and industry-government laboratory cooperative R&D agreements (CRADAs) concluded show in all cases marked increases through 1994 or 1995 (see Table B-5 and Figures B-5 and B-6), but a fall-off in growth in the last year or two for which data are available. In any case, for the most part these counts of discrete transactions fail to indicate their value in monetary or other
TABLE B-4 Corporate Support of University R&D
|
|
Corporate Funds to University R&D (millions of constant 1992 dollars) |
Percent of Total Corporate R&D Going to Universities |
|
1991 |
770 |
0.81 |
|
1992 |
805 |
0.83 |
|
1993 |
822 |
0.87 |
|
1994 |
836 |
0.88 |
|
1995 |
858 |
0.83 |
|
1996 (preliminary) |
895 |
0.81 |
|
1997 (preliminary) |
926 |
0.78 |
|
Source: National Science Board (1998). |
||
TABLE B-5 Number of New CRADAs Executed, by Agency
|
Agency |
Total |
1992 |
1993 |
1994 |
1995 |
|
Total |
3,512 |
502 |
877 |
1,130 |
1,003 |
|
Agriculture |
270 |
41 |
103 |
72 |
54 |
|
Commerce |
412 |
86 |
147 |
97 |
82 |
|
Defense |
1,001 |
131 |
201 |
298 |
371 |
|
Energy |
1,553 |
160 |
367 |
564 |
462 |
|
Environmental Protection |
43 |
20 |
5 |
10 |
8 |
|
Health & Human Services |
136 |
53 |
25 |
36 |
22 |
|
Interior |
61 |
3 |
15 |
39 |
4 |
|
Transportation |
36 |
8 |
14 |
14 |
0 |
|
Source: Technology Publishing Group (1997). |
|||||
terms, their duration, and their importance relative to the myriad channels of informal knowledge exchange. Moreover, for purely private transactions, we can only speculate on the motivations for voluntary reporting, either to the press (strategic technology alliances) or to the government (research and production joint ventures) and whether reported arrangements are truly representative of their universes.
Location of R&D Activity
Industrial innovation has become increasingly multinational through increased direct foreign investment in R&D facilities, development of digital communications, and expanded use of formal international cooperative agreements, joint research ventures, and other forms of strategic technology partnering. The growing multinational organization of innovative activity apparently affords
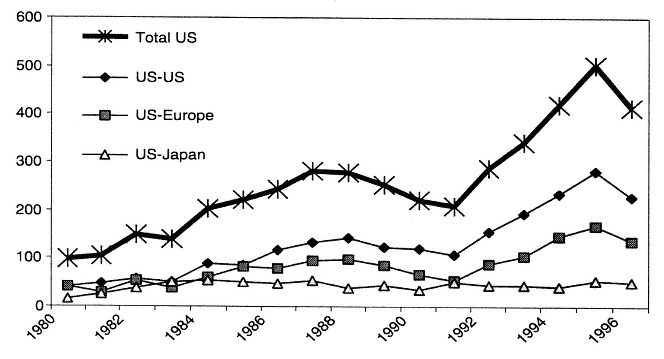
Figure B-5
Strategic technology alliances with U.S. firms
Source: Maastricht Economics Research Institute on Innovation and Technology (MERIT)/ Cooperative Agreements and Technology Indicators (CATI) database. NSB-98, A4-48.
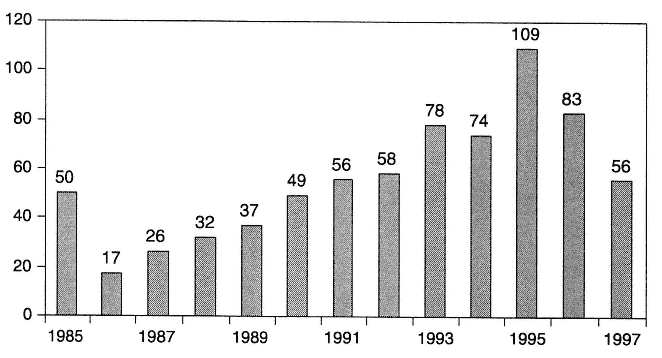
Figure B-6
Research and production joint ventures: annual number of new filings under the National Cooperative Research Act (NCRA) and National Cooperative Research and Production Act (NCRPA).
Source: Unpublished data from the Department of Justice, Antitrust Division, Premerger Unit.
greater access not only to markets and materials but also to a broader array of technologies and skilled human capital, improving innovative efficiency. Public policy concerns center on the possible loss of domestic economic activity arising from an outward flow of knowledge and technology. Available national statistics shed little light on this issue.
The Bureau of Economic Analysis (BEA) of the U.S. Department of Commerce tracks the inward and outward R&D investment flows for U.S. companies and affiliates of foreign companies. BEA data show that U.S. company R&D investment abroad has remained roughly in balance with R&D expenditures in the United States by majority-owned U.S. affiliates of foreign companies. There has been a slight shift in the aggregate balance from a net outflow in the late 1980s to a net inflow in 1993 and 1994 (see Figure B-7). The industry sectors with the greatest growth of foreign-based R&D activity by U.S. companies and their affiliates were chemicals (especially pharmaceuticals), scientific instruments, food, and nonmanufacturing such as computer software, data processing, and architectural services. As a share of total domestic corporate R&D, however, outward investment did not increase in the 1990s, remaining about 11 percent. Only inward investment increased from about 9 percent in 1989 to 14 percent in 1995.
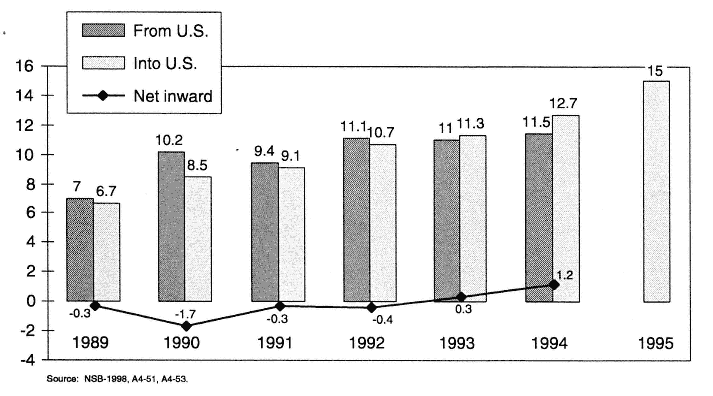
Figure B-7
U.S. and foreign industrial R&D investment (billions of dollars).
Source: National Science Board (1998, A4-51, A4-53).
Summary
National data sources do not provide robust evidence of changes in U.S. industrial R&D that are widely thought to be substantial, continuing, and in some respects problematic from the standpoint of the national economic interest. This undoubtedly is a commentary about the limitations of the indicators, the less than satisfactory categories in which data are classified, and the high level of aggregation of the data more than it is evidence of the existence and magnitude of the trends. In light of these deficiencies, it cannot be inferred from the data that the changes are not real or that other trends equally consequential to economic performance are not occurring. On the other hand, the evidence does lead to questions about anecdotal data cited as evidence of the trends. What is certain is that without a concerted effort to improve R&D and other innovation indicators, we will continue to be in a relatively poor position to assess industrial innovation trends.
References
Bean, A.S., K. Einholf, and J. Russo. (1999). "Benchmarking your R&D: Results from the IRI/CIMS Annual R&D Survey for FY 1997." Research-Technology Management, Jan.-Feb., pp. 24-34.
Bean, A.S., J. Russo, and R. Whiteley. (1998) "Benchmarking your R&D: Results from the IRI/CIMS Annual R&D Survey for FY 1996." Research-Technology Management, Jan.-Feb., pp. 1-10.
Cooper, R., and S. Merrill. (1997). Industrial Research and Innovation Indicators: Report of a Workshop. Washington, D.C.: National Academy Press.
Mowery, D., ed. (1999). U.S. Industries in 2000: Studies in Competitive Performance. Washington, D.C.: National Academy Press.
National Science Board. (1998). Science & Engineering Indicators—1998. Arlington, VA: National Science Foundation.
National Science Foundation. (1999). "Industrial R&D Early Release Tables." Available at http://www.nsf.gov/sbe/srs99411/start.htm.
Technology Publishing Group. (1997). The 1996 CRADA Handbook: Federal Government Cooperative Research and Development Agreements Expected in 1995. Washington, D.C.: Technology Publishing Group.


