
2
SAR Issues
BACKGROUND AND HISTORY
Imaging radar was originally developed for military reconnaissance. Both real-aperture radars (RARs) and synthetic-aperture radars were developed in the 1950s. RARs became available for civilian use in 1965. Both produce the same kind of images, except for fullpolarization SAR images. Thus, research with RAR applies to SAR and vice versa. However, for spaceborne purposes, SAR, which can have resolutionsmaller than 10 m, is normally used, because RAR from space cannotobtain ground images with resolutions better than several kilometers.The exception is the Russian-Ukrainian Okean series of RARs thatproduce images with ground resolution comparable to that of the AdvancedVery High Resolution Radiometer, about 1 km.
In 1965, images from the airborne Westinghouse AN/APQ-97 K-band multipolarized RAR became available to the civilian community. These images had a resolution of 7.5 m across-track (range resolution) and 1.1R m along-track (azimuth resolution), where R is the range (distance in kilometers) from radar to target. Thus, at a range of 10 km, airborne RAR produced better-resolution images (7.5 m × 11 m) than did the spaceborne SARs flown to date. Extensive research conducted with these images demonstrated that active microwave sensors could be used for a wide range of applications in studies of the solid earth, as well as for natural and cultural (e.g., agriculture) resource assessments.
The AN/APQ-97 was diverted to commercial use in the late 1960s, resultingZ in more than a decade-long hiatus in data availability for the research community. Not until the late 1970s, with the launch of the short-lived Seasat mission, and the 1980s, when JPL, the Canada Centre for Remote Sensing, and others began SAR flights, did images become available again on a more routine basis.
During the interim period, the APQ-97 and similar Canadian systems were flown commercially, but the data were considered to be confidential by the companies or governments that paid for data acquisition. Many countries in the tropics were mapped by these systems, but the largest project was RADAM in Brazil. Maps of nearly the entire country were produced for vegetation, geology, potential settlement, and other specialized uses. This information continues to be fused with multispectral data from resource satellites but is now being replaced by satellite SAR data from ERS-1 and 2, JERS-1, and Radarsat. Also during the interim period, extensive ground-based research into radar backscatter properties was conducted in the United States, Netherlands, France, Japan, and Canada. This provided the basis for our knowledge of radar response to crop, snow, sea-ice, ocean, soil, and soil-moisture conditions. In part because of technological limitations, these studies concentrated on the amplitude of the radar backscatter and did not investigate phase information. Many current studies use SAR imagery to confirm these earlier results and extend them in the spatial domain. However, recent technological advances have made possible the exploitation of relative phase information that JPL began collecting in 1984-1986 by the airborne L- and C-band polarimetric SAPs. This capability led to two significant analytic advances: polarimetry and interferometry. Polarimetry makes the complete
scattering matrix available for analysis. Interferometry relies on the relative phase stability of the scene for determination of digital elevation models.
Interferometry
Interferometric SAR is a technology that uses the phase difference between two coherent synthetic aperture radar images of a scene, obtained by two receivers separated by a cross-track distance called the baseline, to measure the height of the imaged surface. The interferometric technique was first applied to SAR by Graham (1974), who used two slightly displaced antennas mounted on an aircraft to form an interferometric beam (Figure 2.1a). When two antennas are used to receive simultaneously the complex signal scattered by the scene, subsequent to illumination by one of them, and then are processed together to produce height information, such a scheme is called cross-track SAR inteferometry (see Box 2.1).
Seasat in 1978 and SIR-B in 1984 generated many SAR images of Earth 's surface. Goldstein et al. (1988) extended the two-antenna interferometric SAR technique to a new capability by demonstrating how multiple-pass Seasat SAR images can be combined to realize the interferogram from which height information is derived (Figure 2.1b). Improvements in oscillator phase stability allowed Zebker and Goldstein (1986) to generate three-dimensional maps of large areas at resolutions that are practical for many topographic applications. A similar demonstration was conducted using SIR-B images (Gabriel and Goldstein, 1988). In the 1990s the technique has been applied to numerous multiple-pass image combinations recorded by ERS-1 and 2, JERS-1, and Radarsat.
Polarization
Another recent development uses a full-polarization matrix, including phase, to obtain information not easily acquired in other ways. Much research since the 1980s shows that for some applications, phase differences between the polarizations convey information on the structure of the surface or of vegetation. Although radars of the 1960s had multipolarization capability, they could not measure the phases between polarizations and thus could not provide information conveyed by the phase. Rather, they provided only the amplitude differences, with those between like- and cross-polarizations being most useful.
TRADE-OFFS IN SYNTHETIC APERTURE RADAR
A small SAR system design must consider not only parametric and cost trade-offs, but also issues involving applications, data access, and data dissemination. A well-conceived end-to-end system should include applications undertaken for the public good as well as those driven primarily by science and commerce. Many of the potential applications cited by Evans et al. (1995) would be beneficial to multiple user sectors but are viewed differently by each of them. Intuitively, some applications are oriented more toward a single user sector. However, most

FIGURE 2.1a Interferometric radar data collection approaches.
(a) Dual antenna. Interferometric radar data can be collected in a single pass where both antennas are located on the same platform. One antenna transmits and both antennas receive the returned echoes. (b) Repeat pass. In the repeat pass approach two spatially close radar observations of the same scene are made at two different times. The time interval may range from minutes to years.
|
BOX 2.1 Dual-Antenna Versus Multipass Interferometry Cross-track interferometry can produce two types of information about Earth's surface: terrain height and surface deformation. Terrain height can be extracted from phase difference information between two images recorded by a two-antenna SAR in a single pass over the scene or by a single-antenna SAR in two separate passes with a horizontal separation (baseline) between them. In contrast, surface deformation, which is the change in terrain height between two instances in time, can be measured only by a multipass system. These two approaches are described below. Terrain Height The uncertainty (standard deviation) associated with the measured estimate of the surface height of a given image pixel, relative to a reference three-dimensional framework established on the basis of ground control points of known (x, y, z) coordinates, is given by the approximate relation: The two major advantages of a dual-antenna, single-pass approach over a single-antenna repeat-pass (sometimes called multipass) approach are as follows:
The major advantage of a repeat-pass approach over a single-pass configuration is that a much larger baseline (distance between orbits) can be used, thereby improving the vertical resolution of the measured terrain height. Surface Deformation Whereas a larger baseline leads to better height resolution, the inverse is true with surface deformation measurement. The ideal orbital configuration is one in which the two passes follow exactly the same orbit. To measure the surface deformation associated with earthquakes and other superficial changes at accuracies on the order of millimeters, the repeat orbits should remain within a circular tube with a diameter of 250 m. This would be sufficient to produce deformation maps with a horizontal resolution of 3 m and a vertical resolution of 2 mm. The relatively tight orbital constraint can be relaxed by using three orbits, two to produce a terrain height database, and the third, in interferometric combination, to produce a map of height changes between the times of the height baseline and the “differential” orbit. Using this method, accuracies on the order of a few millimeters have been reported (Meade and Sandwell, 1996). JPL and others have demonstrated direct measurement of surface movement on the order of 1 m/s or less. The technique used is along-track SAR interferometry, which requires antennas to be separated in the flight direction, rather than cross-track. The measurement is applicable to oceanic and coastal currents. |
applications are not yet well-enough documented scientifically to enable assessment of their primary value for the public good, for commercial gain, or for Earth system science. In the following section, trade-offs among design parameters form the basis of the discussion. In the committee's view, a separate study should address NASA's strategy for optimizing applications for these various constituencies.
Historically, SARs have been physically large systems requiring large amounts of power. This legacy is perpetuated by SAR designs that have been, and are being, developed to address multiple applications. Designers for new spaceborne SAPs often optimize for versatility to attract the widest range of users. The results have been expensive, large systems with substantial power and data requirements. However, if the design is tuned to specific user needs, then trade-offs may be possible among critical SAR parameters that could reduce cost, size, weight, and power requirements. If, for example, one wishes only moderate resolution (500 m or larger) in the range direction, the power and weight can be quite small. If one wishes the finest possible resolution, power and weight are large, although advances in technology now permit much smaller (but not lower-power) units than were previously possible. The only element in a spaceborne SAR that must be large is the antenna, and its size depends on the choice of frequency.
It is the committee's opinion that approaches to small SAR should address design trade-offs. However, incomplete understanding of these trade-offs by users and managers has sometimes resulted in overly complex and expensive systems. Since different applications require different parameters, the primary application should be selected prior to making other trade-offs. As these are made, the design can be optimized for cost, size, and weight. Table 2.1 lists some of the instrument requirements as derived from the LightSAR report (JPL, 1997) and publications in the literature.
With all of these parameters available for trade-off, selection of a major focus for any SAR mission, particularly a small SAR mission, is extremely important. Most applications can be addressed to some extent with any choice of parameters, but the selected focus and cost of other constraints should drive the choice. Table 2.2 itemizes some of the more important design options by primary application and by the type of processing required (interferometric, polarimetric) and maturity (demonstrated, validated, or operational) (JPL, 1997). The entries are brief because of the tabular format, but they can help guide choices and also show the importance of application focus to parameter choice.
Impacts of Various Parameters
Choosing a primary application for a small SAR mission will govern its design. For example, few traditional (i.e., none in noninterferomatic) applications require ground resolution finer than a few tens of meters. The increasing cost of higher power and greater weight to obtain a very fine resolution, in the judgment of the committee, does not appear to be justified for most mission foci. Certain missions might require very fine resolution, although these are probably not good candidates for a small SAR. If necessary, one can achieve very fine resolution using a spotlight mode, as discussed briefly below.
TABLE 2.1 Spaceborne SAR Instrument Requirements
|
Scientific Discipline |
Minimum Configuration |
Configuration for Added Capability |
Resolution (m) |
Data-Take Frequency (once per) |
Special Requirements |
|
Ecology |
|||||
|
Biomass, regrowth, cover-type classification |
L-quad |
+ C-quad + P-quad |
25-50 |
3 months |
None |
|
Vegetation moisture |
L-quad |
+ C-quad + P-quad |
25-50 |
10-15 days |
None |
|
Vegetation height and roughness |
L-copol interf C-copol interf |
+L-dual interf +C-dual interf |
25-50 |
3 months |
None |
|
Complete map of boreal and tropical forests for long-term studies |
L-dual |
+ C-dual |
100 |
1 year |
None |
|
Hydrology |
|||||
|
Soil moisture |
L-dual |
+ C-dual + P-dual |
25-50 |
10 days |
Low angle |
|
Snow hydrology |
X-quad |
+ C-quad |
25-50 |
10 days |
High altitude |
|
Floods |
L-HH |
+ L-dual, L-quad |
25-50 |
10 days |
None |
|
Tropical basins |
L-HH |
+ P-HH + L-dual, L-quad + P-quad + P-quad |
100 |
6 months |
None |
|
Geology |
|||||
|
Tectonics and surface change |
L-copol interf (repeat pass) |
+ C-copol interf |
25-50 |
10 days |
None |
|
Soil erosion, desertification |
L-dual |
+ C-dual |
25-50 |
6 months |
None |
|
Subsurface mapping |
L-dual |
+ P-quad |
25-50 |
None |
|
|
Glaciology |
Polar orbit |
||||
|
Ice stream velocity |
L-copol interf (repeat pass) |
+ C-copol interf |
25-50 |
10 days |
None |
|
Surface topography |
C-copol interf (repeat pass) |
+ L-copol interf |
25-50 |
10 days |
None |
|
Oceanography |
|||||
|
Thin-ice thickness |
L-quad |
+ C-quad + P-quad |
25 |
10 days |
Polar orbit NFσ <−30 dB |
|
Major ice types |
L-quad |
+ C-quad |
25-50 |
10 days |
Polar orbit |
|
Sea-ice motion |
C-HH |
+ L-HH + C-quad |
100 |
10 days 10 days |
>300-km : Swath |
|
Summer open-water ice concentration |
L-quad |
>50-km : Swath |
|||
|
Ice melt ponds |
L-HH |
+ C-HH |
<5 |
10 days |
High-resolution |
|
Eddies, internal waves, films, underwater topography |
L-copel |
+C-copol + P-copol |
100 |
10 days |
Low angle |
|
Wave climatology and generation |
L-HH |
+ C-HH |
25 |
1 days |
Wide Swath |
TABLE 2.2 Examples of SAR Applications
|
Geophysical Parameters |
Algorithms and Mission Parameters |
Maturity (readiness for “operational” use) |
|
Surface Deformation |
Repeat-pass interferometry within 1 month; L-band; orbit control |
Validated (line of sight) Demonstrated (vector) |
|
Preseismic |
Multiple repeats (noise identification and reduction) |
Research |
|
Coseismic |
Pre- and postcoverage |
Validated |
|
Postseismic |
Targeted coverage |
Validated |
|
Interseismic |
Extended regional areal coverage (hundreds of km) at low resolution (25 m); long time series (yr), regular repeats (months) |
Demonstrated (creep zones) Research (other areas) |
|
Pre-eruptive |
Multiple repeats (noise identification and reduction) |
Research |
|
Co-eruptive |
Targeted coverage |
Validated |
|
Inter-eruptive |
Long time series, regular repeats |
Demonstrated |
|
Landslides |
Local coverage, high resolution |
Demonstrated |
|
Subsidence |
Regional and local coverage |
Demonstrated |
|
Other Geometrical Surface Changes (e.g., lava flow) |
Long time series; regular repeats; L-band |
Demonstrated |
|
Glacier and Ice Sheet Velocity |
||
|
Ice sheets |
L-band repeat-pass interferometry within 8 days, or C-band within 2 days, at latitude > 65° |
Demonstrated (L-band) Validated (C-band) |
|
Glaciers |
Repeat-pass interferometry (1-2 days) or pattern matching |
Demonstrated |
|
Glacier Volume and Topography |
L-band repeat-pass interferometry within 8 days, or C-band within 2 days |
Demonstrated |
|
Forest Biomass |
||
|
Boreal |
L-band HV |
Demonstrated |
|
Temperate |
L-band HV or P-band HV |
Demonstrated |
|
Tropical |
P-band HV |
Demonstrated |
|
Vegetation Classification |
||
|
Forest |
L-band dual polarization |
Research |
|
Crops |
L-band quad polarization |
Research |
|
Aerodynamic Roughness |
L-band HV |
Demonstrated |
Wavelength
The choice of wavelength is critical. The main focus of a mission must determine the wavelength, subject to constraints of cost and complexity. A spaceborne SAR requires a minimum antenna area to satisfy ambiguity constraints. This area is directly proportional to wavelength. Hence, a short wavelength permits a smaller antenna area, thereby reducing the cost and complexity of antenna deployment. Moreover, other components also are smaller for shorter wavelengths, although this is less important than antenna size. Transmitter costs may increase with a short wavelength, but probably not as much as antenna costs decrease. This is partly due to a requirement for more power at short wavelengths, but the fact that scattering coefficients are larger at shorter wavelengths can mitigate this to some extent.
Range Resolution
When the range resolution can be relaxed, weight and power requirements decrease. It is costly to overspecify the resolution required for a selected task. In this connection, it has been shown that range and azimuth resolution may be traded, as interpretability for a given number of looks depends on the area of a pixel, not on its dimension in either direction (Moore, 1979). However, swath width and the need to obtain more looks may make fine range resolution necessary, even though this increases the power required as well as the cost of transmitter-spacecraft power. See the discussion of swath width below.
Polarization
For radar applications, polarization is sensitive to the size, shape, and orientation of scattering elements, whereas frequency functions primarily as a size filter with important consequences regarding attenuation and scattering losses. Cross-polarization is almost always useful. It need not add major costs but does require a separate receiver and a dual-polarized antenna. Cross-polarized signals are typically 6 to 10 decibels (dB) lower than like-polarized signals. Thus, if one wishes to receive cross-polarized signals with adequate signal-to-noise ratio from the weakest targets, the transmitter power must increase by a factor of 4 to 10. However, if one is willing to sacrifice the cross-polarized return from the weakest targets, using only the like-polarized return for these targets, the power need not be much higher for a system with a cross-polarized receiver. Adding the capability for the full phase-coherent matrix increases the power requirement, cost, and complexity of both radar and data systems. However, since some applications can benefit from use of the full-polarization matrix, selection of a mission focus in which this capability provides significant enhancement to interpretation may justify the additional cost. Thus, one must carefully consider the benefits of such a system in mission selection.
Swath Width
Generating wide-swath images with SAR can be accomplished with a longer antenna or by scanning. Use of a longer antenna can increase the swath width proportional to the antenna length, but a large increase requires a very long antenna. Moreover, the along-track resolution is equal to the number of looks multiplied by half the antenna length; thus, this resolution becomes poorer with a wider swath. One may compensate by improving the range resolution, but this will require an increase in power. An alternative, used on Canada's Radarsat, is the scanning SAR (scanSAR) (Moore et al., 1981). ScanSAR provides considerable flexibility by stepping the antenna beam in elevation during the time the radar scans the scene. Doing this, however, means that the integration time for each look must be shorter, and consequently the along-track resolution is poorer. Decreased resolution for wider swath is a natural trade-off, however.
ScanSAR also permits more flexibility in antenna design. The minimum area must still satisfy the ambiguity criterion, but the length-to-height ratio is a free variable. Thus, one might make a square antenna, which could be easier to fabricate and deploy. Moreover, such an antenna could be used for microwave radiometry, permitting the SAR image to be embedded in a coarser-resolution radiometer image.
Either a long antenna or a scanSAR adds to the cost and may limit the azimuth resolution available from a strip-map mode. If the major focus of a mission requires a wide swath or frequent revisit, then the more costly antenna is a fair trade-off.
Azimuth Scan—The Spotlight Mode
If a very fine azimuth resolution is required, either the antenna must be short or a “spotlight mode” must be used. (Shorter antennas must be larger in the vertical dimension to achieve the required area, which usually means scanning in elevation to achieve a reasonable swath.) In the spotlight mode the antenna beam is rotated synchronously with the radar's forward motion so that it illuminates a target area for a longer time. Therefore a longer synthetic aperture is realized. In this case, the minimum along-track pixel dimension can be much smaller than half an antenna length, with a resolution of less than one wavelength theoretically possible. While the antenna is pointing at one area, it is not available to image the contiguous area.
Thus, the spotlight mode achieves fine resolution at the expense of continuous coverage. Also, to make the cross-track resolution comparable to the fine along-track resolution would require much higher power. Use of the spotlight mode precludes continuous coverage and requires scanning the beam in a horizontal direction. The cost trade-offs implied by these alternatives must be explored if an application requiring fine resolution is the mission focus.
Hardware Validation
Both industry and JPL have made great strides toward reducing the size and weight of system components. In the JPL presentation to the committee, numerous dramatic changes in size and weight were shown to be achievable through specialized microwave monolithic integrated circuits. Although the presentation referred to an L-band system, similar reductions in size, weight, and power consumption exist in the commercial communications sector, which uses much higher frequencies. All of these developments can be validated on the ground prior to spaceflight; there is nothing unique about flying them in space except the radiation environment, which can be simulated.
Foldable and unfurlable antennas of suitable sizes are well within the state of the art, as demonstrated on many satellite programs. The Seasat antenna had this feature more than 20 years ago. The X-band antenna used on the Okean series is a folding unit. Similar, but smaller, units are used on the ERS series and Radarsat, but these are still 10 m and 15 m in length, respectively. Moreover, Radarsat has a scanSAR mode, demonstrating that an antenna electronically scanned in elevation can be launched in a folded configuration. The primary technical challenge is the construction of such antennas that are extremely lightweight, allowing their use with small launch vehicles.
SMALL SAR MISSION ENHANCEMENTS
Small SAR enhancements could include (1) multifrequency capabilities or (2) the provision of additional operating modes for a single-frequency SAR (i.e., spotlight, scanSAR, interferometry, polarimetry). As a consequence of the variety of its science requirements,
addition of the operating modes is already included in the JPL baseline LightSAR point design. It is believed that these enhancements will increase mission costs by approximately 25 percent relative to a solely interferometric mission. The committee considers this increase to be relatively modest in view of the expansion in the scope of the scientific data that would be provided.
Multifrequency Capabilities
Multifrequency data can be considered in two contexts: (1) fusion of small SAR data with those from other existing or planned data sets acquired by electro-optical systems or other SARs (see Table 1.1) and (2) synergistic applications of data acquired simultaneously by a multifrequency SAR. If multifrequency data are required by a given application or would lead to significant enhancements, two main issues govern the basic approach: (1) temporal decorrelation of the phenomena of interest and (2) ease of data fusion.
Temporal Decorrelation
In general, the more quickly a scene of interest changes in time, with resultant changes in the signal (at a given set of sensor parameters), the less desirable it is to fuse multifrequency data acquired at different times from multiple sensing platforms. Examples include phenomena such as the moisture status of soil and vegetation, which can change over a matter of seconds in windy conditions. Currrent retrieval algorithms require simultaneous data acquisition (Dubois et al., 1995; Oh et al., 1992; Ulaby et al., 1996). Other applications with similar constraints involve retrieval of the biophysical attributes of vegetation such as height, density, and biomass; these also require simultaneous acquisition to resolve ambiguities in the inversions. An exception to the preceding may be land-cover classification. To the extent that land-cover change is time conservative, daily-to-seasonal changes in moisture status and vegetation phenology can be used to enhance classification accuracy using multitemporal approaches. The benefits of this are well documented for both SAR and electro-optical sensors.
Concerning the use of multifrequency SAR data alone (i.e., no fusion with electro-optical data), a large number of image-based studies have examined the role of frequency based primarily on airborne SAR and SIR-C/X-SAR data (summarized in Evans et al., 1995). These formed the basis for the committee's 1995 letter report (see Appendix B). However, no studies have explicitly treated the issue of time decorrelation of scene attributes with respect to multitemporal fusion of SAR data acquired at different frequencies. The committee recommends that such studies be undertaken by NASA as this is the central issue surrounding use of the present constellation of international spaceborne SAR systems that are not operating in formation.
Data Fusion
The second issue of concern is data fusion. The problem has four aspects: (1) the effects of temporal change, which is addressed briefly above, (2) sensor-specific geometric distortions, (3) issues of resolution and scale and, (4) data retrieval and assembly.
-
Geometry: The side-looking viewing geometry of SAR imparts geometric distortions in the projected image. Simple conversion from slant-range to ground-range projections does not remove distortions related to topography. These distortions can be locally severe in both range and azimuth, depending on the angle of incidence and local relief. Hence, accurate fusion of data from two sensors with different viewing geometries can be accomplished only after each is orthorectified. Reliable orthorectification techniques have recently been demonstrated for a number of spaceborne SAR systems, but they require good (i.e., vertical postings <30 m) digital elevation models (DEMs). The accuracy of orthorectification is constrained by the accuracy of the DEMs. Globally, adequate DEMs are lacking. It should be noted that the Shuttle Radar Topography Mission (SRTM) will provide a relatively good DEM for the region from 60°N to 57°S latitude.
-
Resolution and Scale: Differences in image resolution with respect to the spatial scale of the attributes of interest must also be considered in data fusion. This is a question of current scientific interest that is poorly understood.
-
Data Retrieval and Assembly: In part because of the foregoing problems and the issue of cloud cover affecting the availability of electro-optical data, very few published studies treat the fusion of SAR and electro-optical data (Lozano-Garcia and Hoffer, 1993). Since the technical issue of SAR orthorectification has been largely resolved, the committee encourages NASA to support studies of the fusion of SAR and electro-optical data.
Multifrequency SAR Data Only
It is beyond the scope of this report to examine each application area in the context of simultaneously acquired ultifrequency SAR data. However, two examples are given from the area of vegetation classification. The first, land-cover classification, deals with the provision of information in support of ESE and environmental monitoring objectives. The second, biophysical estimation of vegetation attributes, supports ESE carbon-cycle studies, environmental monitoring, and commercial forestry applications. Many previous studies (summarized in Evans et al., 1995) have investigated these two application areas using multifrequency SAR data, but not in the context required for this report. Earlier land-cover classification studies maximized classification accuracy and minimized the number of input feature vectors. They did not compare sensor parameters to optimize design scenarios.
This objective was recently addressed by Dobson et al. (1997) using SIR-C/X-SAR data to simulate those from current and planned spaceborne SAR systems (see Table 1.1). That study considers sensor combinations as possible enhancements to the JPL LightSAR baseline design. The examples are drawn from northern Michigan, an area of mixed-temperate forests, northern hardwoods, pine plantations, lowland forests, marshes, and prairies. For both examples, input SAR data were orthorectified and filtered to an effective resolution of approximately 70 m, with more than 100 looks.
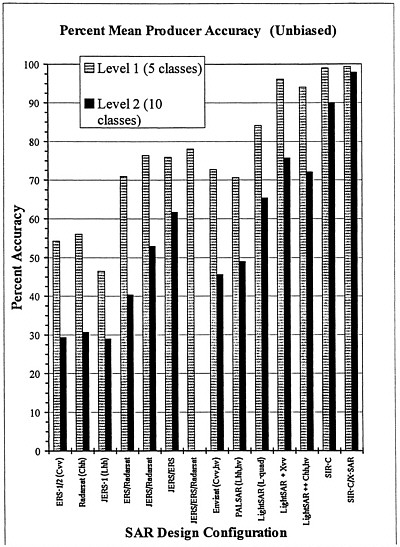
Land-Cover Classification
The land-cover classifications were performed to two levels (Figure 2.2): (1) Level 1 contained five classes—surfaces, short vegetation, upland conifer forest, lowland conifer forest,
and deciduous forest; (2) Level 2 contained 10 classes—surfaces, grasses, seedling trees, jack pine, red and white pine, black and white spruce, northern white-cedar, lowland mixed forest, aspen, and northern hardwood forest. The Level 1 classification is consistent with that needed to serve many ESE science objectives. The Level 2 classification is designed to provide information sought for environmental monitoring and commercial forestry applications. Classification results are presented using a conservative estimate, the mean producer accuracy, which normalizes for the local probability of class occurrence.
For Level 1 classification, accuracies of existing single-frequency and single-polarization SAR systems (i.e., ERS, JERS, and Radarsat) are inadequate unless the data are fused with data from other SAR systems. The multipolarization data expected from Envisat and PALSAR lead to moderate classification accuracies that are slightly inferior to those from multifrequency composites. The expected classification accuracy of the L-band polarimetric LightSAR baseline design is somewhat better than that obtained from ERS-JERS fusion and significantly better than that from ERS-1 and 2, JERS-1, or Radarsat alone. Furthermore, enhancement of the baseline design with the addition of either a single polarization at X-band or dual polarizations at C-band improves the accuracy by an additional 10 percent.
Level 2 classification categories are more consistent with information requirements for commercial applications (NASA, 1997). Higher classification accuracies are needed for such purposes but are realizable only with frequency enhancement. In general, results suggest that the natural between-class variation in size distributions is a more important discriminant than is within-class variation in the orientation of scattering elements. Hence, multifrequency enhancement appears to be more important to classification than does polarization enhancement.
Biophysical Attributes
The same simulated data were used to evaluate biophysical attributes of interest for carbon-cycle studies and possibly for commercial forestry. For each SAR design scenario (see Figure 2.2), empirical relationships between radar backscatter and the attribute of interest were optimized using least-squares techniques. Three key attributes are average stand height, basal area, and timber volume. Retrieval algorithms were defined for each of three forest classes consistent with Level 2 classification: jack pine, red pine, and deciduous (aspen and northern hardwood combined).
None of the attributes is determined with sufficient accuracy for commercial application by the existing single-channel or planned dual-polarization spaceborne SAR systems. A small SAR design with multifrequency enhancement, however, might yield high enough accuracy to have commercial value. The sampling designs of timber companies typically yield a 90 percent confidence that the actual mean is within 10 to 20 percent of that measured, depending on whether a given stand is an even-aged plantation or a natural, mixed stand.
Summary
The examples given above illustrate the possibility of significant additive information from multifrequency enhancement of the small SAR baseline design. Even for a given application, it is difficult to assign a value to these improvements, particularly in monetary terms. The LightSAR business development and system design definition studies submitted to NASA in November 1997 may help accomplish this for some commercial applications. Industry teams can be expected to pay close attention to the end-to-send costs of any system enhancements relative to the expected commercial value of such a system. However, there is no equivalent study being undertaken by NASA to assess the value added by such enhancements. Since it is highly likely that industrial consortia will recommend an enhanced LightSAR, it will be difficult for NASA to evaluate fairly the associated costs with respect to added scientific value unless such a study is undertaken. The committee therefore recommends that the commercial value of small SAR enhancements be determined by the marketplace (i.e., via business development and system design studies) but that NASA determine the scientific value of these enhancements. This information would be critical in negotiating a government-industry team for a small SAR mission.


