
Tenure
In 1995, 56 percent of science and engineering doctorates employed in academe were tenured, 18 percent were on a tenure track, and 9 percent were not on a tenure track. Of the rest, 5 percent were at institutions without a tenure system and 13 percent were in positions to which tenure did not apply (see Table 23 ). As in the previous section on faculty rank, those on postdoctoral appointments were excluded from the analysis in this section.
-
Mathematical sciences had the highest proportion with tenure, 72 percent, and the proportions for both agricultural/environmental sciences and social sciences were higher than average, 63 percent for each.
-
While doctorates in computer sciences had the lowest proportion with tenure (42 percent), a much higher than average proportion of these doctorates were on tenure track, 45 percent compared to 18 percent overall. These figures reflect the relative youth of the doctorates in this field.
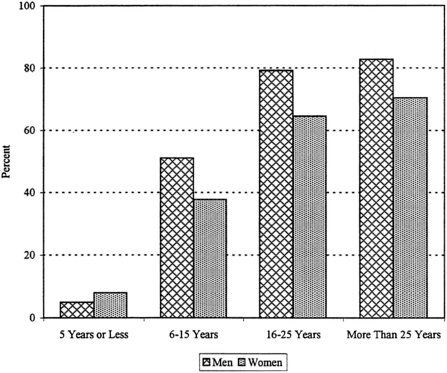
FIGURE 10. Proportion of academically employed science and engineering Ph.D.s with tenure, by time since Ph.D. and gender, 1995.
-
Achievement of tenure is directly corelated with years since doctorate. At 5 years or less since the Ph.D., only 6 percent had tenure. At 6 to 15 years since the doctorate, 47 percent had tenure. By the time 16 to 25 years had passed, 77 percent had tenure, and this proportion increased to 82 percent for those with more than 25 years since the doctorate (see Table 24 ).
-
Women with 5 years or less since the doctorate held tenure in higher proportions than men from the same cohort, 8 percent compared with 5 percent. After 5 years, however, the proportion of men with tenure was between 13 and 14 percent higher than for women in each cohort. As with faculty rank differences between men and women by cohort, the tenure rate differences may be partially explained by the tendency of women to have more gaps in their careers.


