7
ARTICLES, PAPERS, AND PATENTS
Productivity of science and engineering Ph.D.s can be measured by the numbers of published articles, presented papers, and applications for patents.
Articles
-
Sixty-three percent of science and engineering Ph.D.s had an article published in a refereed journal between April 1990 and April 1995. The mean number of articles published was 4.7 for all science and engineering doctorates (see Table 35 ).
-
Publication of articles varied by field. The mean number of articles ranged from a low of 2.8 for doctorates in psychology to a high of 7.0 for doctorates in biological sciences. Ph.D.s in biological and earth/atmospheric/marine sciences were the most likely to have published at least one article (78 and 77 percent, respectively). Twenty-one percent of doctorates in biological sciences had more than 10 published articles during the five-year period compared to 12 percent for all science and engineering doctorates. The least likely to have published were psychology Ph.D.s (44 percent).
-
By sector, the mean number of articles was 6.7 for science and engineering doctorates employed in educational institutions, 4.4 for those in the nonprofit sector or governmental sector, 2.4 for those in private firms, and 1.1 for the self-employed. Those most likely to have published at least one article were science and engineering doctorates in educational institutions (78 percent) and those least likely were the self-employed (28 percent).
-
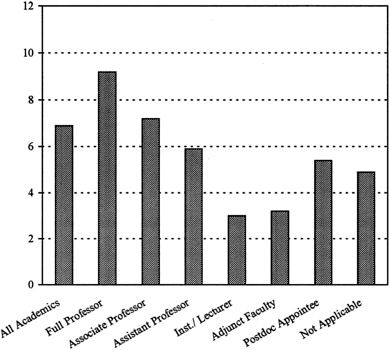
For all science and engineering doctorates holding academic positions, the mean number of articles published between April 1990 and April 1995 was 6.9, and 79 percent had published at least one article. Full professors had the highest mean number of published articles (9.2). More than one-quarter had published more than 10 articles. Adjunct faculty and instructors/lecturers had the lowest mean number of articles (3.2 and 3.0, respectively) (see Table 36 ).
-
By contrast, those holding postdoctoral appointments were the most likely to have published at least one article (94 percent). About 77 percent of full professors had published at least one article, compared to 61 percent of instructor/lecturers and 58 percent of adjunct faculty.
-
By tenure status, those with tenure had the highest mean number of articles published (8.2). Postdoctoral appointees, who were the most likely to have had at least one article published (94 percent), had a lower mean number of articles (5.4). Those for whom tenure was not applicable had the lowest mean number of articles (5.1) and were the least likely to have published (68 percent).
FIGURE 14. Mean number of articles published by science and engineering Ph.D.s between April 1990 and April 1995, by academic position.