National Academies Press: OpenBook
« Previous: ARTICLES
Suggested Citation:"PATENTS." National Research Council. 1998. Doctoral Scientists and Engineers in the United States: 1995 Profile. Washington, DC: The National Academies Press. doi: 10.17226/9524.
×

Papers

  • Seventy-three percent of science and engineering Ph.D.s had authored or co-authored papers for presentation at regional, national, or international conferences between April 1990 and April 1995. The mean number of papers presented was 6.4 overall (see Table 35 ).

  • Variances in the number of papers produced for conferences by field, sector, academic position, and tenure status were similar to those in the number of articles published (see above). An exception was that doctorates in computer and earth/atmospheric/marine sciences were most likely to have authored a conference paper (86 and 85 percent, respectively).

Patents

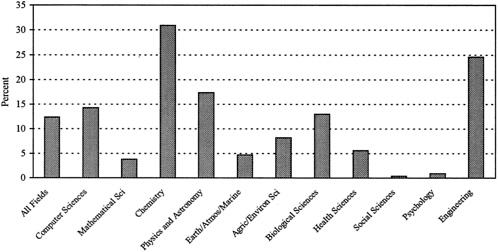
  • The productivity of science and engineering doctorates can also be examined by looking at the number of patent applications on which they were named, the number of patents granted, and the number of patents that were commercialized. Overall, 12 percent said they had been named as an inventor on a patent application between April 1990 and April 1995 (see Table 37 ).

  • The number of times science and engineering doctorates were named as an inventor on a patent varied by field. Almost no social science or psychology Ph.D.s were named as an inventor on a patent application (less than 1 percent for each). Other fields with a low percentage of doctorates named as inventor included mathematical sciences (4 percent), earth/atmospheric/marine sciences (5 percent), health sciences (6 percent), and agricultural/environmental sciences (8 percent). Those fields with a high percentage named on a patent application were chemistry (31 percent) and engineering (25 percent).

  • Of those who had been named as an inventor on a patent application between April 1990 and April 1995, 59 percent had been named on 1 to 2 patent applications, 36 percent on 3 to 10 applications, and 5 percent had been named on 10 or more. However, 30 percent had no patents granted, while 46 percent had 1 to 2 granted, 21 percent had 3 to 10 granted, and 4 percent had 10 or more granted. Ph.D.s in chemistry and physics/astronomy had the highest rates of success in obtaining patents (79 and 78 percent, respectively), followed by engineering doctorates (72 percent).

  • An interesting follow-on question is whether the patents granted resulted in commercialized products or processes or were licensed. Overall, 52 percent of those granted patents said that their patents had been licensed or commercialized. Thirteen percent of all those who had been granted a patent indicated that more than 2 of their patents had been commercialized or licensed.

Suggested Citation:"PATENTS." National Research Council. 1998. Doctoral Scientists and Engineers in the United States: 1995 Profile. Washington, DC: The National Academies Press. doi: 10.17226/9524.
×

FIGURE 15. Proportion of science and engineering Ph.D.s named as inventors on patent applications between April 1990 and April 1995, by field.

Suggested Citation:"PATENTS." National Research Council. 1998. Doctoral Scientists and Engineers in the United States: 1995 Profile. Washington, DC: The National Academies Press. doi: 10.17226/9524.
×
Page 33
Suggested Citation:"PATENTS." National Research Council. 1998. Doctoral Scientists and Engineers in the United States: 1995 Profile. Washington, DC: The National Academies Press. doi: 10.17226/9524.
×
Page 34
Next: FOREIGN WORK OR RESEARCH »
Doctoral Scientists and Engineers in the United States: 1995 Profile Get This Book
×
 Doctoral Scientists and Engineers in the United States: 1995 Profile
MyNAP members save 10% online.
Login or Register to save!
Download Free PDF

READ FREE ONLINE

  1. ×

    Welcome to OpenBook!

    You're looking at OpenBook, NAP.edu's online reading room since 1999. Based on feedback from you, our users, we've made some improvements that make it easier than ever to read thousands of publications on our website.

    Do you want to take a quick tour of the OpenBook's features?

    No Thanks Take a Tour »
  2. ×

    Show this book's table of contents, where you can jump to any chapter by name.

    « Back Next »
  3. ×

    ...or use these buttons to go back to the previous chapter or skip to the next one.

    « Back Next »
  4. ×

    Jump up to the previous page or down to the next one. Also, you can type in a page number and press Enter to go directly to that page in the book.

    « Back Next »
  5. ×

    Switch between the Original Pages, where you can read the report as it appeared in print, and Text Pages for the web version, where you can highlight and search the text.

    « Back Next »
  6. ×

    To search the entire text of this book, type in your search term here and press Enter.

    « Back Next »
  7. ×

    Share a link to this book page on your preferred social network or via email.

    « Back Next »
  8. ×

    View our suggested citation for this chapter.

    « Back Next »
  9. ×

    Ready to take your reading offline? Click here to buy this book in print or download it as a free PDF, if available.

    « Back Next »
Stay Connected!