Demographic Characteristics
Demographic characteristics of science and engineering Ph.D.s, including gender, race, age, and citizenship are described in this section (see Table 2 and Table 3 ).
Gender
-
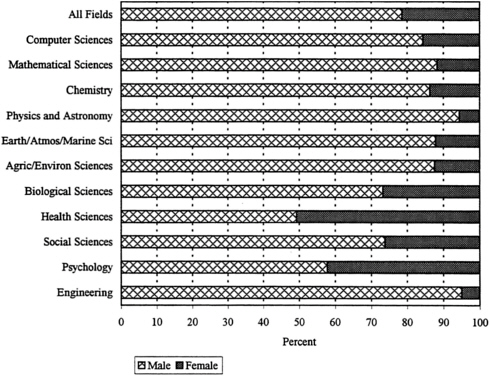
Women comprised 22 percent of the U.S. population of science and engineering doctorates in 1995.
-
The fields of health sciences and psychology had the highest representation of women (51 and 42 percent, respectively). The fields with the lowest proportion of women were engineering and physics/astronomy (5 and 6 percent, respectively).
-
The proportion of female science and engineering Ph.D.s has grown with each successive cohort. Only 8 percent of the group that earned its doctoral degrees more than 25 years earlier were women, while 34 percent of the doctorates from the most recent 5-year cohort were women (see Table 3 ).
FIGURE 2. Field composition of science and engineering Ph.D.s, by gender, 1995.