
2
Benefits, Costs and Contemporary Use Patterns
BENEFITS OF PESTICIDES
Pesticides are an integral component of US agriculture and account for about 4.5% of total farm production costs (Aspelin and Grube, 1999). Pesticide use in the United States averaged over 1.2 billion pounds of active ingredient in 1997, and was associated with expenditures exceeding $11.9 billion; this use involved over 20,700 products and more than 890 active ingredients. Herbicides account for the greatest use in volume and expenditure; in 1997, 568 million pounds was used in agriculture, commerce, home, and garden. Insecticide applications constituted 168 million pounds, and fungicides 165 million pounds. Use patterns of pesticides vary with crop type, locality, climate, and user needs (Aspelin and Grube, 1999).
Pesticides are used so extensively because they provide many benefits to farmers and by extension to consumers. From the time when synthetic pesticides were developed after World War II, there have been major increases in agricultural productivity accompanied by an increase in efficiency, with fewer farmers on fewer farms producing more food for more people (Figure 2-1) (Rasmussen et al. 1998). A major factor in the changing productivity patterns, either directly or indirectly, has been the use of pesticides. In maize, for example, there has been 3-fold increase in yields since 1950. Although to a large extent this increase is attributable to the adoption of new hybrids with increased disease and insect resistance and with the ability to use more nitrogen fertilizer, another major factor
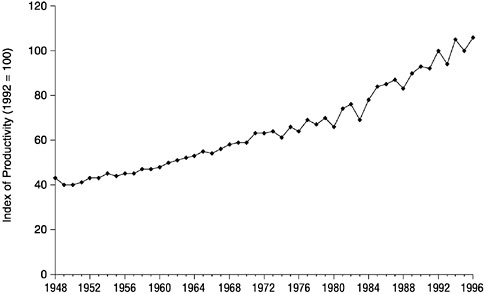
FIGURE 2-1 Index of farm productivity in the United States, 1948–1996.
aThe index of productivity was determined by dividing all input values (such as feed, seed, livestock purchases, and pesticides) by all output values (such as feed crops, poultry, and eggs). Input and output values are unit-free quantity indexes that measure change over time as weighted by price. They were determined with Fisher 's Ideal Index number procedure (also known as geometric mean of Laspayres and Paache indexes).
Source Data from Ball et al., 1997.
has been changes in planting practices facilitated by the availability of effective herbicides. Historically, for example, corn was planted in hills of three or more plants and, in many cases, in check rows, which allowed farmers to cultivate the corn in two directions for weed control. With the advent of effective herbicides, farmers switched from hill planting to drilled, narrow-row planting. The plant population increased from 10,000–12,000 plants per acre to 25,000–30,000 plants per acre. That led to the development of new high-yield hybrids that could tolerate the high population densities. Herbicides also allowed corn to be planted earlier in the growing season, and this resulted in a higher yield potential for the crop. Before herbicides, corn had to be planted later so that the first flushes of weeds could be killed with tillage. The development of soil-applied insecticides also allowed more farmers to grow maize for multiple years and increased productivity on an area-wide basis. Wheat production has
also benefited from the use of herbicides; earlier, broadleaf and grass weeds caused great losses in yield. Cultivation is not practical in cereals, in contrast with maize. The introduction of 2,4-D and grass herbicides increased yields by controlling the weeds without damaging the crop (Warren 1998).
The beneficial impact of insecticides is illustrated by patterns of cotton cultivation in the southern United States. When Anthonomus grandis, the boll weevil, crossed the Rio Grande in 1892, it rapidly spread through the lower Southeast and drove major cotton production out of many states. With the advent of synthetic organic insecticides, farmers were able to return previously infested areas to cotton cultivation. Boll weevil eradication programs combining chemical control with other management practices have further expanded acreage in cotton (Carlson and Sugiyama 1985). That example also illustrates the complexity of pesticide issues. After the boll weevil outbreaks exerted their initial damage, southern farmers were forced to diversify their crops. The long-term result was of such strong economic benefit that the citizens of Enterprise, Alabama, erected a monument in their town square inscribed “in profound appreciation of the boll weevil and what it has done as the herald of prosperity” (Pfadt 1978).
Plant disease can be devastating for crop production, as was tragically illustrated in the Irish potato famine of 1845–1847; indeed, this disaster led to the development of the science of plant pathology (Agrios 1988). Disease is still a major problem in potato production, and over 90% of the acreage in the United States is treated with a fungicide to prevent yield loss. In the Columbia Basin, a late blight epidemic (caused by new aggressive strains of Phytophthora infestans) occurred in 1995, and affected 65,000 ha (Johnson et al. 1997). This area accounts for about 20% of US potato production. Left unchecked, the late blight epidemic could have decreased yield by 30–100%. With the use of several fungicides, the epidemic was controlled, and there was only a 4–6% loss in yield and no increase in storage loss compared with previous years (Johnson et al. 1997).
One of the major benefits of pesticides is the protection of yield. According to one estimate (Oerke et al. 1994), yields of many crops could decrease by as much as 50%, particularly because of insect and disease damage, without crop-protection. Knutson et al. (1990) estimated that removing pesticides from US agriculture would cause crop-production to decline, particularly in the southern states, and increase cultivated acreage by 10% to compensate for crop yield losses. Crop yield losses were estimated at 24–57%, depending on the crop species, if no pesticides or alternative crop protection measures were used. Moreover, exports in this scenario would decrease by 50%, and consumer expenditures for food would increase by about $228 per year and be accompanied by an in-
crease in inflation as food prices increased. However, those estimates failed to take into account the possibility that other pest-control strategies could be used or that new technologies could be developed in the absence of chemical control (Jaenicke 1997).
A survey conducted by the Weed Science Society of America (Bridges and Anderson, 1992) estimated that the total US crop loss due to weeds is about $4 billion a year. In the absence of herbicides and best management practices, this loss could theoretically increase to $19.5 billion. The estimated loss in crops grown without herbicides ranged from 20% for corn and wheat up to 80% in peanuts (Bridges and Anderson, 1992).
Pesticide use also provides some benefits directly to consumers. Zilberman et al. (1991) estimated that every $1 increase in pesticide expenditure raises gross agricultural output by $3.00–6.50. Most of that benefit is passed on to consumers in the form of lower prices for food. Major losses prevented by pesticide use are those experienced during transport and storage. Oerke et al. (1994) estimated that about 50% of the harvested crop, particularly of such perishable crops as fruits and vegetables, could be lost in transport and storage because of insects and disease in the absence of pesticide use. Moreover, pesticide use can improve food quality in storage by reducing the incidence of such fungal contaminants as aflatoxins, known liver carcinogens, which are responsive to fungicides.
The use of herbicides has reduced the need for growers to cultivate to control weeds and that reduction has led to an increase in the practices associated with conservation tillage. These include no-till, ridge-till, striptill, and mulch-till—practices that leave at least 30% cover after planting. Leaving cover after planting reduces soil loss due to wind and water erosion up to 90%, and it increases crop residue (organic matter) on the soil surfaces up to 40% (CTIC, 1998a). Conservation tillage in the United States has increased from 26.1% of the total acreage in 1990 to 37.2% of the total acreage in 1998 (1998b). Without herbicides, widespread adoption of conservation tillage would likely not have taken place.
Although agriculture accounts for two-thirds of all expenditures on pesticides and three-fourths of total volume used, nonagricultural uses of pesticides are also substantial. Pesticides are used on some 2 million US farms but they are also used in some 74 million households (albeit at much lower rates). Expenditures for home and garden use of pesticides in US households were approaching $2 billion a year in 1996, most of it on insecticides ($1.34 billion), fungicides and repellents ($185 million), and herbicides ($479 million) (Aspelin and Grube, 1999).
Estimating the economic benefit of household pesticides is difficult in that in most cases no tangible product is sold for a profit. Benefits are often aesthetic rather than economic (although aesthetic improvement can increase traffic at a place of business or increase the resale value of a
residence). Even if difficult to measure, the aesthetic benefits of controlling pests in homes, gardens, and lawns, must be sufficient for homeowners to use pesticide products despite reservations about their safety (Potter and Bessin 1998); close to 85% of US households contain at least one pesticide product in storage (Whitmore et al., 1993).
Control of household pests can potentially provide health benefits because insect allergens (including those present in cockroach excrement and body parts) contribute to asthma, particularly in children. The presence of domiciliary cockroaches is strongly associated with sensitization to cockroach allergens, and sensitization has been associated with the incidence of bronchial asthma (Duffy et al., 1998). About 70% of urban residents with asthma are sensitive to cockroach allergens. The high mortality and morbidity of inner-city children due to asthma are linked to exposure to cockroach allergens (Petersen and Shurdut, 1999). That cockroach control could reduce the incidence of asthma is suggested by the positive correlation between the degree of cockroach sensitivity and the number of cockroaches seen in infested dwellings by residents. Helm et al. (1993), for example, established a quantitative relationship between cockroach density and the amount of cockroach aeroallergens. However, particularly in multifamily households, reducing cockroach numbers does not always lower the incidence of asthma (Gergen et al., 1999).
The decision of whether to treat for cockroaches at present is determined not by an economic injury level (EIL), but rather by an aesthetic level. EILs cannot be calculated, because an economic value of human life cannot be easily assessed. No-observed-effect levels (NOEL) based on detectable levels of cholinesterase depression, however, can be established for the organophosphate agents used for cockroach control. Assessments of air and surface residues and biological monitoring have been used to evaluate multiple exposures of residents of homes undergoing crack and crevice treatment with organophosphates (summarized in Peterson and Shurdut, 1999). Maximum daily exposures were calculated at 2.4–8% of the reference dose (RfD) for children and less than 1% of the RfD for adults (RfD is the dose at or below which aggregate exposure every day over the course of a lifetime does not pose a significant risk). Use of chlorpyrifos, the agent of choice for crack and crevice treatment, was thought to result in minimal exposures and did not pose an appreciable risk to residents. Thus, even if aesthetic and health benefits are difficult to quantify, they still are expected to be offset by very low risk factors for chemical agents currently in use. On June 8, 2000, US EPA revised their risk assessment for this compound based on the mandates of the Food Quality Protection Act (FQPA) and eliminated chlorpyrifos for residential use. After December 31, 2001, retailers will not be able to sell any chlorpyrifos for home use except in baits with child-resistant packaging
(EPA 2000). Risks are not so easily quantified for nonchemical alternatives for cockroach abatement (such as baits, cleaning, and microbial agents), but they are expected to be low (Peterson and Shurdut, 1999).
Control of stinging hymenopterans, which kill about 40 people in the United States every year (Merck & Co., 2000), has considerable health benefits, which are difficult to quantify given the problems associated with assigning value to human life.
In summary, in the context of production agriculture and ancillary enterprises, pesticides are intended to
-
Increase yields.
-
Increase farming efficiency.
-
Increase availability of fruits and vegetables.
-
Supply low-cost food and fiber for consumers.
-
Improve food quality.
-
Decrease loss of food during transport and storage.
-
Improve soil conservation.
-
Ensure a stable and predictable food supply.
Contemporary Pesticide Use on US Crops
Broadly speaking, pesticides are used extensively in US agriculture; but they are used most intensively on fruits and vegetables. Intensity of pesticide use is measured by the amounts applied per acreage— which is much higher for fruits and vegetables than for other crops. For example, vegetables represent less than 2% of the crop acreage but received 17% of the total pesticides used (Lin et al. 1995). Current information on pesticide use is available from USDA surveys on corn, wheat, soybeans, cotton, potatoes, other vegetables, citrus, apples, and other fruits (ERS, 1997). Those crops account for about 80% of both planted crop acreage and sales of agricultural products and can thus be taken as broadly representative of US agriculture (USDA, 1996). Data on pesticide use include amounts of active ingredients applied and shares of acreage treated in toto and by major category (ERS, 1997). In 1996, corn, wheat, cotton, and soybeans together accounted for almost two-thirds of all pesticides applied to those crops (ERS, 1997). Corn herbicides alone accounted for about one-third of the total, and soybean herbicides for about one-eighth. Herbicides and insecticides applied to cotton each accounted for 5–6% of the total, and herbicides applied to wheat accounted for 4%. Other pesticides applied to potatoes, mainly soil fumigants, accounted for over one-eighth of the total.
The extent of pesticide use on any given crop can also be captured by the share of acreage treated. By that measure, herbicide use is widespread.
Herbicides are applied to 92–97% of acreage planted in corn, cotton, soybeans, and citrus; 87% of potato acreage; three-fourths of vegetable acreage; and two-thirds of the acreage planted in apples and other fruit (ERS, 1997; see Table 2-1). Herbicide use is least extensive on winter wheat (56%). In contrast, insecticide use is much less widespread. Among row crops, insecticides are used most extensively in cotton, tobacco, and potatoes. About 30% of corn acreage is treated annually with insecticides, and insecticides are applied to 12% or less of wheat and soybean acreage. Insecticide use is quite prevalent, however, on fruit and vegetable crops. Nearly all apples, citrus, and potatoes and about 90% of other vegetable and other fruit crop acreage are treated with insecticides (ERS, 1997). Fungicide use is similarly highly prevalent on potatoes and fruit crops. Among row crops, only in cotton, tobacco and potato are fungicides used regularly; less than 10% of cotton acreage is typically treated with fungicides. The category “other pesticides ” includes defoliants, growth regulators, and soil fumigants, which are used widely on cotton and potatoes. Potatoes are particularly pesticide intensive—almost 90% of the acreage is treated, with fungicides and soil fumigants as the dominant types of treatment (ERS, 1997).
One measure of the intensity of pesticide use is reflected by calculat-
TABLE 2-1 Pesticide Use in US Row Crops, Fruits, and Vegetables
|
Proportion of Area Treated, % |
|||
|
Crop |
Herbicide |
Insecticide |
Fungicide |
|
Row cropsa |
|||
|
Maize |
97 |
30 |
<1 |
|
Cotton |
92 |
79 |
6 |
|
Soybean |
97 |
1 |
<1 |
|
Winter wheat |
56 |
12 |
1 |
|
Spring wheat |
88 |
3 |
<1 |
|
Tobacco |
75 |
96 |
49 |
|
Potato |
87 |
83 |
89 |
|
Fruits and vegetablesb |
|||
|
Apple |
63 |
98 |
93 |
|
Oranges |
97 |
94 |
69 |
|
Peaches |
66 |
97 |
97 |
|
Grapes |
74 |
67 |
90 |
|
Tomato, fresh |
52 |
94 |
91 |
|
Lettuce, head |
60 |
100 |
77 |
|
aData for 1996. Fungicide amounts do not include seed treatments. Source: Agricultural Chemical Usage 1996 Field Crop Summary USDA September 1997. bData for 1995. Source:Agricultural Statistics 1997, NASS Crop Branch (202) 720-2127. |
|||
ing the amount of active ingredient applied per treated acre. We do that by dividing the total amount of each material used by the number of treated acres, which we estimate by multiplying planted acreage by the fraction of acreage treated. If the fraction of acreage treated is not reported (for instance, for other pesticides used on fruits and vegetables), we use planted acreage instead (Table 2-2). Planted acreage is likely to be larger than treated acreage, because some acreage is not treated, so this procedure can result in an estimate of application rate that is lower than the actual rate.
Potatoes are the most pesticide-intensive US crop, because of their heavy use of soil fumigants (Table 2-3). Other vegetables and apples are the next most intensive, receiving a total of about 20 lb of pesticides per treated acre. Citrus (9.6 lb/acre) is also highly pesticide-intensive. (Lin et al., 1995). In contrast, cotton, the most pesticide-intensive of the major crops, received only about 5 lb/acre, about one-fourth to one-half as much as most fruit and vegetable crops. Corn received less than 3 lb/acre, and soybeans and wheat 1lb/acre or less. Only in the case of herbicides are application rates per treated acre comparable between major crops and fruits and vegetables. Corn and cotton receive roughly the same amounts of active ingredients per acre as potatoes, other vegetables, apples, and other fruits (Lin et al., 1995).
The total amount of pesticides applied to some major crops (Figure 2-2) increased over the last few years after declining for over a decade. Pesticide use in US agriculture increased steadily from the late 1940s until around 1980, because of the spread of herbicide use on corn and soybeans (ERS 1997, Osteen and Szmedra 1989). Pesticide use on major grain and oilseed crops has fallen consistently since the early 1980s. The adoption of pest-management programs that take advantage of the strengths of new pesticides has contributed to decreasing the amount of pesticides used. For example, a 1992 survey showed that pesticide use in Missouri grain crops had decreased by 6% since 1975 while the total quantity of herbicide and insecticide active ingredients had decreased by 38%; the decrease in herbicide use by Missouri corn and soybean farmers from 1984 to 1992 amounted to 3 million pounds. Those decreases were attributable to the availability of more effective herbicides with lower application rates (NAPIAP, 1997). Similarly, a survey in North Dakota in 1996 showed that many farmers had adopted new cultural and management practices that enhanced the effectiveness of pest management. For example, 75% of the farmers surveyed used field monitoring and crop rotation as part of their integrated program. In addition, several thousand wheat growers were trained in field monitoring, insect identification, and other practices, which resulted in a 75% decrease in the number of acres treated for orange wheat blossom midge.
Increases in pesticide use over the last 10 years are due for the most part to increases in the use of fungicides and other pesticides, mainly soil fumigants, on potatoes and other vegetables (Padgitt et al., 2000). Increases in pesticide use for a given crop can be the result of additional acreage being planted. For example, pesticide use in cotton has increased due largely to the resurgence of cotton production in the southeastern United States, which is itself attributable to the success of the boll weevil eradication program administered by USDA (Carlson et al., 1989).
Those trends suggest that differences in the intensity of pesticide use among crops appear to have become greater over time, mainly because of increases in the use of fungicides, such other pesticides as soil fumigants, and growth regulators. Over the last 2 decades, major crops (for example, grains, oilseeds, and cotton) have become less pesticide-intensive. Insecticide use and herbicide use on potatoes, other vegetables, citrus and apples have remained roughly constant since the early 1980s, whereas the use of fungicides and other pesticides has increased. The use of all types of pesticides on other fruits increased between 1980 and 1990 and has since remained roughly constant.
Pesticide-Related Productivity in US Agriculture
Gauging the productivity of pesticide use in agriculture is difficult. The aggregate concept “pesticides” has considerable currency in policy discussions but is hard to define precisely. Pesticides in the aggregate encompass a wide variety of chemicals with different properties and effects. As a result, there might be no consistent correlation between crop output and common measures of pesticide use, such as the amount of active ingredient applied or the acreage treated with pesticides. For example, reducing the application of a given compound might lead to reductions in output whereas a switch from a less-toxic to a more-toxic compound that results in the same reduction in weight of active ingredient applied might not. Despite the conceptual difficulties, it is important to have at least a rough sense of how pesticide use in the aggregate influences agricultural productivity.
Zilberman et al. (1991) pointed out that the productivity of pesticides —and thus the effects of reducing pesticide use—depends in large measure on substitution possibilities within the agricultural economy. Some substitutes are available only in the short term, when land allocations, cropping patterns, and consumption are fixed. Others are available in the long-term. Substitution between pesticides and other inputs can occur at the farm level or at the regional and national levels. Short-term substitutes for pesticides at the farm level include labor (such as, hand weeding), capital and energy (such as cultivation to control weeds),
TABLE 2-2 Pounds of Pesticide Active Ingredient per Planted Acre in Major US crops, 1990–1997
|
1964 |
1966 |
1971 |
1976 |
1982 |
1990 |
1991 |
1992 |
1993 |
1994 |
1995 |
1996 |
1997 |
|
|
Crop Herbicides |
|||||||||||||
|
Corn |
0.387 |
0.693 |
1.362 |
2.454 |
2.974 |
2.932 |
2.767 |
2.829 |
2.758 |
2.723 |
2.615 |
2.661 |
2.640 |
|
Cotton |
0.312 |
0.631 |
1.587 |
1.571 |
1.829 |
1.710 |
1.850 |
1.949 |
1.756 |
2.085 |
1.943 |
1.893 |
2.115 |
|
Wheat |
0.165 |
0.152 |
0.216 |
0.273 |
0.226 |
0.215 |
0.195 |
0.241 |
0.254 |
0.294 |
0.289 |
0.403 |
0.342 |
|
Soybeans |
0.133 |
0.279 |
0.840 |
1.614 |
1.880 |
12.870 |
1.181 |
1.139 |
1.066 |
1.124 |
1.088 |
1.212 |
1.181 |
|
Potatoes |
0.989 |
1.482 |
1.521 |
1.254 |
1.256 |
1.687 |
1.777 |
1.643 |
1.805 |
2.048 |
2.074 |
1.992 |
1.762 |
|
Other vegetables |
0.670 |
1.005 |
1.061 |
1.696 |
1.984 |
1.735 |
1.700 |
1.658 |
1.671 |
1.681 |
1.909 |
2.126 |
2.127 |
|
Citrus |
0.265 |
0.397 |
0.457 |
3.970 |
5.556 |
6.635 |
7.176 |
6.208 |
5.385 |
4.908 |
4.455 |
4.170 |
3.913 |
|
Apples |
0.617 |
0.924 |
0.389 |
1.427 |
1.548 |
0.815 |
0.823 |
0.883 |
0.868 |
1.307 |
1.739 |
1.735 |
1.987 |
|
Crop Insecticides |
|||||||||||||
|
Corn |
0.238 |
0.356 |
0.344 |
0.379 |
0.368 |
0.313 |
0.303 |
0.264 |
0.253 |
0.219 |
0.211 |
0.202 |
0.218 |
|
Cotton |
5.259 |
9.271 |
5.937 |
5.503 |
1.692 |
1.100 |
0.584 |
1.156 |
1.146 |
1.742 |
1.772 |
1.278 |
1.398 |
|
Wheat |
0.016 |
0.016 |
0.032 |
0.090 |
0.033 |
0.013 |
0.003 |
0.017 |
0.003 |
0.028 |
0.013 |
0.030 |
0.017 |
|
Soybeans |
0.158 |
0.086 |
0.129 |
0.157 |
0.164 |
0.000 |
0.007 |
0.007 |
0.005 |
0.003 |
0.008 |
0.006 |
0.011 |
|
Potatoes |
1.111 |
1.984 |
1.934 |
2.318 |
2.898 |
2.566 |
2.559 |
2.614 |
2.816 |
3.107 |
2.217 |
1.717 |
2.423 |
|
Other vegetables |
2.532 |
2.352 |
2.610 |
1.775 |
2.039 |
1.662 |
1.627 |
1.572 |
1.554 |
1.545 |
1.511 |
1.491 |
1.503 |
|
Citrus |
1.825 |
3.213 |
2.554 |
3.843 |
4.687 |
4.678 |
4.706 |
5.079 |
5.597 |
5.215 |
4.929 |
4.805 |
4.783 |
|
Apples |
23.993 |
20.185 |
12.011 |
8.960 |
7.898 |
8.220 |
8.230 |
8.609 |
8.894 |
8.279 |
7.609 |
7.375 |
7.285 |
|
Crop Fungicides |
|||||||||||||
|
Corn |
0.000 |
0.000 |
0.000 |
0.000 |
0.000 |
0.000 |
0.000 |
0.000 |
0.000 |
0.000 |
0.000 |
0.000 |
0.000 |
|
Cotton |
0.012 |
0.036 |
0.018 |
0.004 |
0.018 |
0.080 |
0.050 |
0.060 |
0.052 |
0.080 |
0.059 |
0.034 |
0.065 |
|
Wheat |
0.000 |
0.000 |
0.000 |
0.011 |
0.013 |
0.002 |
0.001 |
0.017 |
0.010 |
0.014 |
0.007 |
0.003 |
0.001 |
|
Soybeans |
0.000 |
0.000 |
0.000 |
0.004 |
0.001 |
0.000 |
0.000 |
0.001 |
0.000 |
0.000 |
0.000 |
0.000 |
0.000 |
|
Potatoes |
2.463 |
2.357 |
2.880 |
2.962 |
3.094 |
2.006 |
2.274 |
2.689 |
3.177 |
4.449 |
5.722 |
4.945 |
7.930 |
|
Other vegetables |
1.384 |
1.179 |
1.789 |
1.581 |
3.056 |
4.553 |
4.738 |
4.946 |
5.482 |
6.045 |
6.469 |
6.902 |
6.920 |
|
Citrus |
6.314 |
4.559 |
7.754 |
4.922 |
4.312 |
3.950 |
4.235 |
3.837 |
3.485 |
3.681 |
3.791 |
3.626 |
3.478 |
|
Apples |
17.173 |
20.190 |
17.919 |
16.093 |
13.512 |
9.778 |
9.259 |
9.713 |
9.978 |
10.022 |
10.000 |
11.497 |
13.245 |
|
Crop Other pesticidesa |
|||||||||||||
|
Corn |
0.001 |
0.008 |
0.006 |
0.006 |
0.002 |
0.000 |
0.000 |
0.000 |
0.000 |
0.000 |
0.000 |
0.000 |
0.000 |
|
Cotton |
0.838 |
1.373 |
1.513 |
1.088 |
0.824 |
1.230 |
1.103 |
1.193 |
0.945 |
1.137 |
1.163 |
1.278 |
1.340 |
|
Wheat |
0.000 |
0.001 |
0.005 |
0.000 |
0.000 |
0.000 |
0.000 |
0.000 |
0.000 |
0.000 |
0.000 |
0.000 |
0.000 |
|
Soybeans |
0.000 |
0.001 |
0.001 |
0.040 |
0.034 |
0.000 |
0.000 |
0.000 |
0.000 |
0.000 |
0.000 |
0.000 |
0.000 |
|
Potatoes |
0.069 |
0.006 |
4.467 |
6.095 |
11.658 |
25.055 |
18.621 |
24.122 |
28.664 |
35.734 |
27.969 |
25.343 |
30.837 |
|
Other vegetables |
1.777 |
0.164 |
1.084 |
1.584 |
2.834 |
6.100 |
6.510 |
6.918 |
8.062 |
9.217 |
10.764 |
12.341 |
12.337 |
|
Citrus |
1.971 |
0.766 |
1.072 |
0.179 |
0.006 |
0.016 |
–a |
–a |
–a |
0.102 |
0.200 |
0.600 |
1.100 |
|
Apples |
2.298 |
2.564 |
1.363 |
1.424 |
1.003 |
0.104 |
0.206 |
0.221 |
0.217 |
0.218 |
0.217 |
0.217 |
0.221 |
|
Crop All pesticide types |
|||||||||||||
|
Corn |
0.626 |
1.057 |
1.712 |
2.839 |
3.344 |
3.245 |
3.070 |
3.092 |
3.011 |
2.943 |
2.825 |
2.864 |
2.858 |
|
Cotton |
6.421 |
11.311 |
9.055 |
8.166 |
4.363 |
4.120 |
3,580 |
4.350 |
3.892 |
5.036 |
4.943 |
4.483 |
4.925 |
|
Wheat |
0.181 |
0.169 |
0.253 |
0.374 |
0.272 |
0.230 |
0.197 |
0.273 |
0.265 |
0.338 |
0.311 |
0.435 |
0.362 |
|
Soybeans |
0.291 |
0.366 |
0.970 |
1.815 |
2.079 |
12.870 |
1.190 |
1.146 |
1.071 |
1.127 |
1.098 |
1.216 |
1.193 |
|
Potatoes |
4.632 |
5.829 |
10.802 |
12.629 |
18.906 |
31.314 |
25.302 |
31.068 |
36.462 |
45.339 |
37.983 |
33.997 |
42.952 |
|
Other vegetables |
6.363 |
4.700 |
6.544 |
6.636 |
9.913 |
14.050 |
14.575 |
15.094 |
16.799 |
18.487 |
20.679 |
22.860 |
22.887 |
|
Citrus |
10.375 |
8.935 |
11.837 |
12.914 |
14.561 |
15.279 |
16.118 |
15.237 |
14.467 |
13.906 |
13.270 |
13.146 |
13.043 |
|
Apples |
44.081 |
43.863 |
31.682 |
27.904 |
23.961 |
18.917 |
18.724 |
19.426 |
20.174 |
19.826 |
19.565 |
21.041 |
22.737 |
|
anone reported or too little reported to make an estimate. Source: Lin et al.,1995; Padgitt et al., 2000. |
|||||||||||||
changes in cultural methods (such as changing planting dates), and human capital (such as scouting). Long-term substitutes at the farm level include shifts in crop varieties (for example, to more-resistant but possibly lower-yielding cultivars), biological pest controls (such as released predators and pheromone traps), crop rotation, and land allocations (increases or shifts in cultivated acreage). Long-term substitutes at the regional and national levels include regional shifts in production, such changes in consumption as increases in imports and decreases in exports, changes in diet composition, and changes in feed mixes.
In general, pesticide productivity will tend to be low in situations where substitution possibilities are large. For example, the United States has a great deal of land suitable for growing grain and oilseed crops. Real prices of fuel and electricity have been falling since 1980 while the price of durable equipment has remained roughly constant (Ball et al. 1997). The prices of both types of inputs have fallen relative to agricultural chemical prices; this suggests that cultivation has become more attractive relative to herbicides as a form of weed control. Because US grain and oilseed production is highly mechanized, those pricing patterns suggest an abundance of cost-effective substitutes for pesticides and thus relatively low pesticide productivity on these crops. In contrast, the United States has a limited supply of land in areas with climates suitable for growing fresh fruits and vegetables year-round. The prices of hired and self-employed labor have risen steadily, both in real terms and relative to agricultural chemical prices, and this suggests that labor-intensive pest-control methods, such as hand weeding and scouting, have become less attractive
relative to pesticide use. Fruit and vegetable production is relatively labor-intensive, so those facts suggest a greater paucity of cost-effective substitutes for pesticides and thus higher pesticide productivity on fruits and vegetables.
Pesticide productivity has been estimated in three general ways: with partial-budget models based on agronomic projections, with combinations of budget and market models, and with econometric models.
Partial-Budget Models
Partial-budget models estimate productivity effects of changes in pesticide use by constructing alternative production scenarios. Each scenario consists of a set of input usage rates and crop yields. Current production methods can be obtained from crop budgets when available. Otherwise, most studies rely on the opinions of experts familiar with crop-production conditions in different growing regions to construct scenarios characterizing current production methods and input usage sets likely to occur under various assumptions of pesticide-use reductions. Changes in yield are derived from pesticide field trials when available and from expert opinion otherwise. Current input and output prices are then used to translate changes in input use and crop yields into monetary terms.
The most widely cited studies on pesticide productivity, those of Pimentel and various coauthors, use this method (see, for example, Pimentel et al. 1978; 1991; 1992). Cramer's (1967) assessment of global crop losses also falls into this category, as does the Knutson et al. (1993)
TABLE 2-3 Acreage and Amounts of Pesticides Applied to Major US Crops, 1997
|
Crop |
Acresa |
Herbicidesb |
Insecticidesb |
Fungicidesb |
Other Pesticidesb |
All Pesticidesb |
Pounds per Acre |
|
Corn |
80,227 |
211,800 |
17,500 |
0 |
0 |
229,300 |
2.86 |
|
Cotton |
13,808 |
29,200 |
19,300 |
900 |
18,500 |
67,900 |
4.92 |
|
Wheat |
70,989 |
24,300 |
1,200 |
100 |
0 |
25,600 |
0.36 |
|
Soybeans |
70,850 |
83,700 |
800 |
0 |
0 |
84,500 |
1.19 |
|
Potatoes |
1,362 |
2,400 |
3,300 |
10,800 |
42,000 |
58,500 |
42.95 |
|
Other Vegetables |
3,526 |
7,500 |
5,300 |
24,400 |
43,500 |
80,700 |
22.89 |
|
Citrus |
1,150 |
450 |
5,500 |
4,000 |
1,100 |
11,050 |
9.61 |
|
Apples |
453 |
900 |
3,300 |
6,000 |
100 |
10,300 |
22.74 |
|
Total |
242,365 |
360,250 |
56,200 |
46,200 |
105,200 |
567,850 |
|
|
aIn thousands. bIn thousands of pounds. Source: Padgitt et al. 2000. |
|||||||
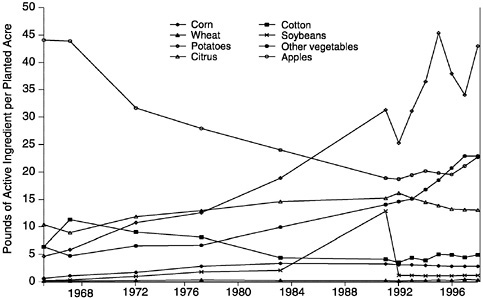
FIGURE 2-2 Total pesticides application on major US crops, 1964–1997.
Source: Padgitt et al., 2000.
study of pesticide use on fruit and vegetable crops. Those studies use data from field trials and expert opinion to estimate pest-induced losses crop by crop basis with current pesticide use, without pesticides, and with a 50% reduction in pesticide use. They construct alternative production scenarios for each crop to estimate changes in input use. Current prices are then used to value changes in per-acre production costs and per-acre yield losses, which are added to obtain an estimate of the costs of changes in pesticide use.
Pimentel and associates compile estimates of crop losses due to insects, diseases, and weeds crop by crop. They then add losses due to each class of pest on each crop to obtain estimates of aggregate crop losses in US agriculture. As they acknowledge, this procedure overestimates crop losses because of overlaps in damage caused by insects, diseases, and weeds. Crop losses are valued at current crop prices. One of the more recent of these studies (Pimentel et al. 1991) estimates that aggregate crop losses amounted to 37% of total output in 1986, up from 33% in 1974. Those estimates were compared with USDA assessments for the 1940s and 1950s, which estimated aggregate crop losses due to pests at 34% and 31% respectively, of total output. In comparison, Cramer (1967) estimated crop losses of around 28% due to all pests in all of North and Central America. Pimentel and associates interpret the temporal coincidence of
rising pesticide use and rising crop losses as additional evidence that US agriculture has been on a “pesticide treadmill” in which disruption of agroecosystems by pesticides forces farmers to use ever-increasing amounts of pesticides. The study also estimates that pesticide use could be reduced by 50% by the substitution of nonchemical pest controls, such as crop rotation, use of resistant crop varieties, scouting, and field sanitation. It estimates that such a reduction in pesticide use would not result in any additional crop losses but would increase pest-control costs by $1 billion, or 25%.
Partial-budget models of this kind generally overstate pesticide productivity (and thus the economic effects of changes in pesticide use) because they consider only a small subset of substitution possibilities (Lichtenberg et al. 1988). They consider only short-run substitution, that is, changes in production methods while land allocations (acreage, crop rotations, and cropping patterns) and consumption patterns are kept fixed. They generally consider only a single substitution possibility for each crop. At best, they consider one alternative production scenario per region. Input usage rates and yields are assumed to be constant on all farms, so input-output ratios (input use per unit of output) are treated as fixed. The models thus ignore even short-run, farm-level substitution possibilities caused by differences in land quality, human capital, and other characteristics of farm operations.
The data used by the studies are problematic. Crop losses cannot generally be observed directly, because they involve comparisons of actual output with output that would have been obtained under conditions that do not typically occur. The empirical basis of the experts' projections is thus not very rigorous. Field trials can hold constant all production practices except pesticide use, deliberately ignoring substitution possibilities. Moreover, they are often conducted in areas with heavier than normal pest pressure, where pesticide productivity is probably higher (Pimentel et al. 1991). As a result, studies that rely on data like those of Pimentel and associates tend to overestimate crop losses in US agriculture.
In addition, estimates of crop losses at 37% are questionably high. The costs of pesticides and nonchemical pest-control methods alike are low relative to crop prices and total production costs (see, for example, the crop budgets in Economic Research Service, 1997). Crop losses of the magnitude estimated by Pimentel et al. (1991) should be sufficient to make it profitable to use chemical and nonchemical pest controls at much greater rates than observed today. In other words, if crop losses were as high as Pimentel et al. (1991) estimate, pesticide use would not now be as low as it is in most crops.
Combined Budget-Market Models
Other studies have attempted to estimate pesticide related and effects of large reductions in pesticide use by combining partial- budget models with models of output markets. These studies use the same approach as partial-budget models in estimating yield and cost effects of changes in pesticide use. Alternative production scenarios consisting of input usage rates and crop yields are constructed for each crop, possibly varying across production regions. Most studies use expert opinion to construct the scenarios. Crop budgets are used to estimate changes in per-acre production expenses. Projected changes in per-acre expenses and yields are then incorporated into models of agricultural-commodity markets and used to project changes in output prices and consumption in market equilibrium.
Zilberman et al. (1991) used this approach to estimate the likely effects of pesticide bans such as the failed 1990 California ballot initiative 128, popularly know as the “Big Green,” on the production of five major fruit and vegetable crops. Zilberman et al. obtained alternative scenarios from crop scientists for production of five major California fruit and vegetable crops (almonds, grapes, lettuce, oranges, and strawberries) under current conditions and under restrictions on pesticide use that would be imposed by the Big Green initiative. Budgets were used to calculate changes in per-acre production expenses. Changes in per-acre production expenses and in crop yields were used to calculate shifts in the supply curves of each commodity (Lichtenberg et al. 1988). Estimates of supply and demand elasticities were then used to calculate changes in production and output prices for each crop. The authors found that Big Green would reduce output by 10 –25%, increase crop prices by 13–57%, and cost consumers $883 million, about 25% of expenditures on the five commodities at the time (if prices go up more than quantities go down, then expenditures increase).
Models of this type incorporate some, but by no means all, substitution possibilities. They tend to capture changes in land use, such as changes in cropping patterns and regional shifts in production. Because they rely on a limited set of production scenarios, however, they tend not to capture all possible short-term substitutes at the farm level, such as shifts in labor, energy, and machinery; use of biological pest controls; and long-term substitutes, such as changes in crop varieties or crop rotation. The Zilberman et al. (1991) findings indicate that the potential for substitution in fruit and vegetable crops is more limited than found in other crop production systems, so pesticide productivity is higher for these crops.
Econometric Models
It is possible to estimate pesticide productivity directly with econometric models. Statistical methods can be used to estimate parameters of models that link output with input use. Varied substitution possibilities are implicit in the parameters of these models. Specification of models that are nonlinear in input use allows rates of substitution between inputs to vary as input usage changes. Alternatively, nonstatistical methods can be used to derive input-output relationships. Models of this kind are commonly used to estimate factor productivity and productivity growth in the US agricultural economy (see, for example, Griliches 1963, Ball 1985, Capalbo and Antle 1988, Chavas and Cox 1988, Chambers and Pope 1994).
Econometric models capture all forms of substitution in production, including short-run and long-run substitutes for pesticides on individual farms and at the regional and national levels. They do have some limitations. The data used to estimate these models limit them to reflect only forms of substitution actually experienced. In addition, the models consider only supply (production) and so do not capture substitution possibilities in consumption, such as changes in diet composition, in feed mix, and in imports and exports. Separate models of demand and market clearing are needed to capture equilibrium changes in consumption.
Headley (1968) estimated such a model by using state-level cross-sectional data for the year 1963. He used crop sales to measure output and expenditures on fertilizers, labor, land and buildings, machinery, pesticides, and other inputs as measures of input use and found that an additional dollar spent on pesticides increased the value of output by about $4—a high level of productivity for that period. Such a finding also indicates that increasing pesticide use would increase the profitability of the agricultural sector substantially. Headley attributed his result to the fact that use of herbicides was still in a relatively early stage of diffusion at that time.
Headley's model, like most economic models, generates estimates of the marginal productivity associated with pesticides, that is, the additional amount (value) of output obtained by using an additional unit of pesticides. Economists believe that in most circumstances (including agriculture) marginal productivity is falling at actual input usage levels; this implies that marginal productivity is less than average productivity. Multiplying the marginal productivity of pesticides by the quantity of pesticides used as, for example, Pimentel et al. (1992) do thus understates the total value added by pesticides. The total value added can be calculated more accurately by multiplying the value of the average product of
pesticides (which exceeds the value of the marginal product) by the amount used.
Profit maximization implies using pesticides up to the amount where the value of their marginal product equals their unit price. Pesticides are for the most part relatively inexpensive in the United States, so one would expect the value of their marginal product to be correspondingly low. But a low value of marginal product does not imply a low total product. If the average product of an input is substantially higher than its marginal product, the total value added by the input will be quite high even if its value at the margin is low. Water is often cited as a case in point. The marginal value of water is low because so much is used, but its total value is large—perhaps even infinite —because it is essential for life.
There are several reasons to believe that Headley's estimate of marginal pesticide productivity could be too high. First, using sales as a measure of output tends to bias productivity estimates upward because output price tends to be positively correlated with input demand. Second, Headley's specification assumes that pesticides are an essential input, that is, that production is impossible without pesticides. This assumption, too, tends to bias the estimate of productivity upward. Finally, as Lichtenberg and Zilberman (1986) argue, the specification that Headley uses does not allow pesticide productivity to decline as fast as it should, again leading to upwardly biased estimates of pesticide productivity.
A useful approach to estimating pesticide productivity is that proposed by Lichtenberg and Zilberman (1986). They argue that pesticides do not generally affect potential output; rather, they prevent losses and are thus best conceptualized as producing damage abatement (avoidance of crop loss), an intermediate input. One appealing specification arising from this approach is treating realized output as the product of potential output and damage abatement. The former is produced by normal inputs, such as land, water, and fertilizer. The latter is produced by damage-control inputs, such as pesticides. Crop loss avoided (damage abated) must lie between 0 and 1. Crop losses can be estimated implicitly as the inverse of damage abatement (that is, as 1 minus the fraction of crop loss avoided).
Carrasco-Tauber and Moffitt (1992) applied this approach to state-level cross-sectional data on sales and input expenditures like those used by Headley (1968). Their use of sales as a dependent variable suggests that their estimate of pesticide productivity should be biased upward. Only one of the abatement specifications they used does not assume that pesticides are essential inputs. That specification generated an implicit estimate of aggregate US crop losses in 1987 of 7.3% at average pesticide use, far less than the Pimentel et al. (1991) estimate.
Chambers and Lichtenberg (1994) developed a dual form of this
model based on the assumptions of profit maximization and separability between normal and damage-control inputs. They used this dual formulation to specify production relationships under two specifications of damage abatement, neither of which imposed the assumption that pesticides are essential inputs. They estimated the parameters of these models for the aggregate US agricultural economy, using time-series data or aggregate input, output, and price index for the period 1948-1989 developed by Ball (1988). Those data have been used widely to investigate factor productivity in US agriculture (see, for example, Ball et al. 1997. As in most factor-productivity studies in agriculture, Chambers and Lichtenberg (1994) assumed constant returns to scale, so that all inputs and outputs were measured on a per-acre basis. A later paper compared four alternative damage-abatement specifications (Chambers and Lichtenberg, forth-coming). Statistical tests confirmed the hypothesis that pesticides are not essential. Statistical tests also showed that crop losses declined as pesticide use increased.
Implicit crop losses in 1987 estimated from those models ranged from 9% to 11%, close to the Carrasco-Tauber and Moffit (1992) estimate but only about one-fourth to one-third that size estimated by Pimentel et al. (1991). The estimated parameters of the models imply that a 50% reduction in pesticide use from 1989 would increase crop losses by 3–4 percentage points to as much as 12–15 percentage points under average pest pressure. Assuming no change in crop prices, farm income would decrease by about $3 billion, or 6%, considerably more than estimated by Pimentel et al. (1991). Because those are aggregate estimates, they give no indication of how those reductions in pesticide use—with consequent increases in damage—would be apportioned among crops; the general depiction of the importance of pesticides in US agriculture presented here suggests that the bulk of the reductions would come from grains and oilseeds. Finally, estimated crop losses with zero pesticide use ranged from 17% to 20%.
Quality, Storage, and Risk
Reducing crop loss is the primary motivation for pesticide use, but pesticides also render other important services in agricultural production: enhancing product quality, prolonging storage life, and reducing production and income risk.
Product Quality
Pesticides can enhance product quality by reducing mold, scarring, blemishes, contamination with insect parts and weeds, and other un
sightly and unsanitary features. The benefits of such enhanced product quality have several forms. Cleaner products can receive a higher price. For example, apple-growers are docked for impurities, and excessively blemished fruits might be salable only for low-value processing uses, such as juice. Processors set limits on impurities, such as insect parts or weeds in fruits and vegetables. They can impose price penalties on violative shipments or reject such shipments altogether. Federal food-purity regulations set limits on impurities in fresh produce; produce found to exceed the limits might not be salable. Federal and state grading standards for fresh fruits and vegetables prescribe lower grades—and thus lower prices—for produce that has more blemishes.
Some have argued that many forms of product quality are purely cosmetic and without a basis in health, nutritional value, or consumer demand (van den Bosch et al. 1975, Pimentel et al. 1991). Federal food-purity standards and grading standards have been especially criticized for that basis. It has been argued that those standards are stricter than necessary and that the stringency of these standards induces farmers to use pesticides more intensively than they otherwise would. Studies of purchases of peaches (Parker and Zilberman 1993), wheat (Ulrich et al. 1987), and other commodities show that consumers are willing to pay more for agricultural products that have fewer blemishes and impurities. Some consumer surveys also indicate unwillingness to purchase produce that has cosmetic defects or insect damage (see, for example, Ott 1990). Studies of pesticide productivity, such as those discussed previously, ignore quality considerations and thus understate benefits of pesticide use. In some cases, aesthetic quality is the primary consideration for pest control, however. Examples include such high-value ornamental crops as flowers, Christmas trees, and woody ornamentals.
Storage
Postharvest uses of pesticides include treatment with fungicides or growth regulators to prolong storage life and fumigation to prevent insect contamination. Prolongation of storage life of fresh fruits and vegetables increases consumer and producer welfare by increasing the availability of fresh produce between harvest seasons (Lichtenberg and Zilberman 1997). Prolongation of storage life of grains essentially lowers the cost of producing grain. As noted, insect parts in grain are considered impurities, and buyers might impose dockage or reject shipments; fumigation of grain thus enhances grain quality. Fumigation of fresh fruits and vegetables plays an important role in facilitating trade; many countries require fumigation to prevent inadvertent importation of exotic pest species (Yarkin et al. 1994). Fumigation has been required in interstate commerce in the
United States as well (for example, fumigation of citrus to prevent the spread of the Mediterranean fruit fly). Studies of pesticide productivity discussed previously ignore postharvest pesticide uses and thus also understate the benefits of pesticide use.
Risk
It has been argued (van den Bosch and Stern 1962, Carlson and Main 1976, Norgaard 1976) that aversion to risk is an important motivation for pesticide use, especially preventive insecticide treatment aimed at mobile insect pests. In this view, many preventive applications serve primarily to provide farmers with insurance; in other words, pesticide application provides little protection, because pest pressure in most years is too low to cause significant damage. Because pesticides are relatively inexpensive, farmers apply them as insurance against the (small) chance that pest pressure will be large enough to cause appreciable damage. That line of reasoning suggests that such applications could be eliminated at little or no cost in increased crop losses or reduced crop quality (van den Bosch and Stern 1962; Carlson and Main 1976; Norgaard 1976). Scouting and economic thresholds have been advocated as one means of eliminating such unnecessary preventive treatments. They have become quite prevalent in US agriculture. In 1994-1995, about 90% of cotton acreage, 85% of potato acreage, 80% of wheat acreage, 75% each of corn and soybean acreage, 65% of fruit acreage, and 21% of vegetable acreage were scouted for pests (ERS 1997). Public provision of all-peril crop insurance has been suggested as a means of eliminating incentives for uneconomical preventive treatment (Carlson and Main 1976, Norgaard 1976).
Preventive treatment might be economically efficient even if there is only a small probability that pest pressure will cause substantial damage and farmers are not risk-averse and thus have no demand for insurance. The average return on preventive treatment will be high when the value of the crop is high and when the material and application costs of the pesticide are low. The average return on reactive treatment will be low when scouting is expensive, when pest pressure is measured with low accuracy, and when the efficacy of rescue treatments is low. For example, by the time symptoms of disease in apples become observable, rescue treatment accomplishes little or nothing; preventive treatment with fungicides is thus standard in many growing regions (see, for example, Babcock et al. 1992). Under those circumstances (or combinations of them), growers will find preventive treatment more profitable (and hence less expenseive) on the average than reactive treatment, and the attractiveness of scouting will be limited; reducing or eliminating preventive treatment would reduce crop productivity and increase production cost.
Recent research suggests that in many circumstances pesticide use can increase income risk rather than reduce it. Theoretical analysis (Horowitz and Lichtenberg 1994) and simulation studies (Pannell 1991) show that pesticides tend to be risk-increasing when crop growth and pest pressure are positively correlated, as often occurs with weed and insect pressure in dryland farming. Econometric analyses of cotton in California (Farnsworth and Moffitt 1981), corn in the US corn belt (Horowitz and Lichtenberg 1993), and wheat in Kansas (Saha et al. 1997) and Switzerland (Gotsch and Regev 1996, Regev et al. 1997) confirm that greater pesticide use is associated with higher income variability for these crops.
Pesticides do play an important role in reducing risk when used to enforce quarantines and thereby prevent establishment of invasive pests. Such treatments can be applied either at the source or at the point of entry and can help to maintain interstate and international embargoes.
CURRENT PROBLEMS ASSOCIATED WITH PESTICIDES
Resistance to Pesticides
Resistance to pesticides (or, more specifically, synthetic organic chemicals) is almost universal among pest taxa (NRC 1986). Bacteria have developed resistance to antibiotics, protozoa to antimalarial drugs, green mold (Penicillium digitatum) to biphenyl fungicides, chickweed to the herbicide 2,4-D, schistosomiasis-carrying snails to the molluscicide sodiumpentachlorophenate, rats to warfarin, and pine voles to endrin. Resistance of nematodes to soil fumigants has not yet been observed but systemic nematocides are relatively new and it is probably only a matter of time until resistance appears. The evolution of resistance is more the rule than the exception in pest populations (Brattsten and Ahmad 1986).
Acquisition of resistance is an evolutionary phenomenon—that is, it is the result of changes in gene frequencies in a population over time. Normal unexposed populations are polymorphic in that some individuals are “preadapted” to cope with the selective agent. The application of selection pressure in the form of pesticide-induced mortality confers an advantage to those genotypes whose fitness is not affected by pesticide exposure; these genotypes reproduce preferentially, and as a consequence, population composition changes over time. It is important to note that the use of pesticides does not generally lead to resistance as a result of mutagenicity; although they can lower fitness, they do not, for the most part, act to change the genotype of an individual (indeed, genetically based resistance is not acquired during the lifetime of the individual).
It must also be noted that chemical pesticides are not the only mortal
ity agents that can select for resistance. For over 2 decades, crop rotation was used as the principal management strategy for corn rootworm (Diabrotica spp.) in the midwestern states. Eggs of these species are deposited in the soil by gravid females; in the spring, hatching grubs attack roots of corn and other graminaceous hosts. By alternating corn with soybeans, growers greatly reduced rootworm problems; that grubs hatched in soybean fields encountered no corn roots, emerged, and starved. However, rootworm problems began to arise in corn planted after soybeans throughout the region where rotation was heavily used. These problems were attributable to two kinds of responses. Populations of D. barberi rootworms with extended egg-stage diapause—lasting 2 years—appeared (Levine and Oloumi-Sadeghi 1991), as did populations of western corn rootworm (D. virgifera) in which individuals, on reaching maturity, abandoned cornfields to lay eggs in adjacent soybean fields (Onstad et al. 1999). Thus, even cultural methods of control are prone to counteradaptation by pests. Any control strategy that results in the death or reduced fitness of a substantial portion of the pest population is prone to the evolution of resistance. Pesticide resistance is conspicuous, however, because of the intensity of the selection pressure exerted by the pesticide chemicals, which are designed to effect high mortality.
That insects could become resistant to the toxic effects of insecticides was first recognized in 1908 (Melander 1914), when a strain of San Jose scale (Aspidiotus perniciosus) was discovered to be resistant to lime sulfur. California red scale resistance to hydrogen cyanide was reported in 1916, and resistance to lead arsenate was found in codling moths in 1917. The number of resistant species has since increased almost exponentially. In 1976, resistance was recorded in 364 insect species (Georghiou and Mellon 1983). In 1986, the number was over 400 (Ku 1987); and it now exceeds 500. Over 150 microbe species and 270 weed species are resistant to at least one chemical pesticide (Jacobsen 1997). The majority of cases of insecticide resistance involve chlorinated hydrocarbons which have been in widespread continuous use for the longest time. Depending on the taxon, resistance to these chemicals is usually acquired within 10 years of first exposure, and acquisition of one form of resistance can facilitate the acquisition of other forms. (For example, the kdr gene in insects played a key role in the genetic evolution of DDT resistance and it confers protection against pyrethroids, another class of pesticides that has the sodium channel as its target site). The naive notion that insects would not develop resistance to the so-called third- and fourth-generation insecticides (which rely on interfering with hormone or pheromone function) was shattered first by Dyte (1972), who described Tribolium castaneum populations that were cross-resistant to juvenile hormones. Cross or induced resistance was later observed in many species (Sparks and Hammock 1983).
In the middle 1950s, Harper (1957) predicted that herbicide-tolerant weed species and resistant phenotypes would become common in crop systems that received annual applications of herbicides. In 1970, triazine resistance was discovered in Senecio vulgaris; and by 1977, there were 188 documented cases of weeds that were herbicide-resistant in 42 countries to over 15 families of chemicals in 42 countries (Heap 1997). Most cases involve a weed species with a single resistance mechanism, but there are exceptions; Lolium rigidum in Australia, for example, has evolved multiple resistance to all the herbicides used in the cropping system (seven chemicals in five families). It is likely that auto lactate synthase (ALS) and acetyl-CoA carboxylase (ACCase) inhibitor resistant weeds will present farmers with major problems in the next 5 years because of their proportional representation in the large-acreage crop markets and the rapid evolution of resistance to herbicides with similar structure or modes of action. Thirty-eight weed species have evolved resistance to ALS inhibitors in cereal, corn and soybean, and rice production systems (Heap 1997).
Herbicide resistance is still relatively restricted and has been slower to develop than insecticide or fungicide resistance. The relative rarity of herbicide resistance is likely due to the low persistence of many herbicides relative to the generation time of the pest, the lower fitness of some resistant genotypes than of the susceptible genotypes, the ability of susceptible weeds that escape death to produce large amounts of seed, and a large reserve of susceptible genotypes in the seed bank (Radosevich et al. 1997). Herbicide-resistant weeds have the greatest economic impact on crop production when there are no alternative herbicides to control the resistant genotypes or when the available alternatives are relatively expensive. Weeds that have multiple resistance are therefore the greatest concern of producers.
If food production is to become more sustainable, it will be imperative to preserve the efficacy of acceptable weed-control methods by defending against weed adaptation. Rapid and continuing weed adaptation might explain the persistent nature of yield losses to weeds despite technological advances (Jordon and Jannink 1997).
Biological factors can affect the speed of selection. One important factor is the generation time (under selection pressure): the larger the number of generations per year, the faster the selection of resistance. Root maggots, such as Hylemya spp., with three or four generations per year evolved resistance to cyclodienes in only 3–4 years, whereas Diabrotica virgifera, the corn rootworm, with only one generation per year developed resistance in 8–10 years. According to Georghiou and Taylor (1976), “it would be safe to predict that none of us will be present when the 17-year locust, Magicicada septendecim, will have developed resistance.” The importance of generation time in evolution of resistance is underscored by
the paucity of predaceous insects that are resistant to insecticides. Although there are insecticide-resistant insect predators such as Coleomegilla maculata, they are far outnumbered by the resistant herbivores. Predators that have acquired resistance, notably predaceous mites (Hoy et al., 1998), have intrinsic reproductive rates comparable with those of prey species. Rosenheim and Tabashnik (1990), however, dispute the importance of generation time, mainly because the probability of mutation is the same in every generation. They examined the literature and found no correlation between the rapidity with which resistance is acquired and the number of generations per year.
Dispersal and migration also influence the rate of evolution of resistance; if susceptible immigrants invade a local population treated with insecticide every year, evolution of resistance will take longer. Curtis et al. (1978) applied the idea to a theoretical control program: grid-application to ensure a supply of susceptible immigrants. That approach is being used to delay acquisition of resistance to Bacillus thuringiensis endotoxin expressed in transgenic plants; interplanting transgenic plants with susceptible plants provides a refuge for susceptible genotypes. Fortuitous survival might be another factor in delaying resistance acquisition. Fortuitous survival may be a factor in cases of polyphagous insects only one of whose hosts is treated or insects that avoid contact with insecticides by concealment in plant structures.
Finally, operational factors affect the speed of evolution of resistance. The selection regimen most likely to result in resistance acquisition is to reach and destroy a high percentage of the population, use a pesticide with prolonged environmental persistence, apply a pesticide thoroughly so as to leave no refugia, apply at low population densities to reduce the probability of survival of susceptible genotypes, apply to every generation, and apply over a large area to prevent immigration of susceptible individuals into the target population (Georghiou 1972).
The standard economic conceptualization of resistance treats susceptibility to a pesticide (or class of pesticides) as an exhaustible resource that is depleted gradually by pesticide application. In many cases, as resistance spreads, pesticide application rates rise while pesticide effectiveness falls, so that growers experience gradually increasing pest-control costs and gradually decreasing yields (Hueth and Regev 1974). Growers can find it profitable to switch to an alternative pest-control method or even an alternative crop (Regev et al. 1983). Using crop rotation or cycling of pesticides to retard the spread of resistance or renew the level of susceptibility in the pest population is implicit in this conceptualization, although not developed explicitly in the literature.
Despite the widespread occurrence of resistance, its effects on US agriculture as a whole are difficult to quantify. US agriculture has experi
enced neither rising pest-control costs nor falling yields in the aggregate. From 1980 (when the diffusion of herbicide use was largely completed) to 1993, real pesticide expenditures remained roughly constant (Figure 2-3), while total factor productivity (output corrected for changes in input use) grew at an average annual rate of 2.6–2.9% (Ball et al. 1997). But growers have been able to switch to substitute chemicals and use alternative methods. For example, resistance had already led cotton growers to switch from DDT to organophosphate insecticides by the time the registration of DDT was canceled (Carlson 1977). In other cases, producers consciously rotate pesticides to prevent or retard the spread of resistance. Thus, the most easily measured impact of resistance to date has been to shorten economic life of some pesticides. Detailed economic studies documenting the costs (or lack of costs) of pesticide resistance in specific agricultural systems are needed to assess the economic impact of pesticide resistance.
Pesticide manufacturers have incentives to respond to resistance both by developing resistance-management strategies for existing chemicals and by searching for new substitutes. Development of resistance-management strategies helps to maintain market share of existing products. Because fixed R&D costs make up a large share of the total costs of producing pesticides, longer product life increases a manufacturer's return on investment. At the same time, resistance functions like planned obso-
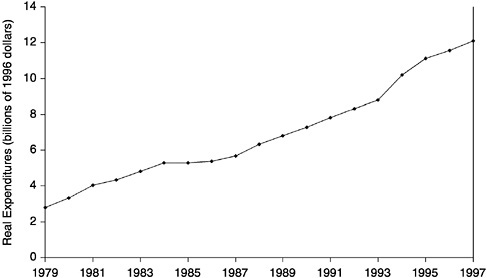
FIGURE 2-3 Real pesticide expenditures in the United States, 1979 –1997.
Source: Data from Aspelin and Grube (1999) and deflated by the implicit GDP price deflator (1996=100) from the Council of Economic Advisors, (2000).
lescence, creating markets for new pesticides by reducing the effectiveness of well-established ones and thus increasing expected returns on investment in new-product development. It gives pesticide developers a chance to increase their market share at their rivals ' expense. It also decreases the window of opportunity to sell generic versions of established pesticides once their patent protection has lapsed, thereby increasing the share of time that developers receive patent protection.
Human Health Impacts
Occupational Effects and Risks: an Overview
Pesticides are designed to kill organisms that share many biochemical pathways and physiological processes with nontarget species in the agroecosystem, with domestic animals, and with humans. The biological commonalities make it difficult to develop pesticides that have ample margins of safety between the pest species and the nontarget organisms, including humans. Furthermore, the removal of “pest species”, which might be enhanced by effects on nontarget species, will produce changes in the treated ecosystems. When one considers that the usual agricultural practice of cropping in monoculture involves major departures from “natural ” ecosystems, the incremental impact of the use of pesticides on ecosystems becomes that much more difficult to estimate.
Candidate pesticides undergo extensive and rigorous laboratory and field testing. In most instances, the batteries of tests have been able to screen out chemicals that have undesirable characteristics. However, there are examples of failure of test protocols to warn against specific adverse effects that became apparent after pesticides came into common use. Two examples are the organophosphate insecticides Leptophos® and Mipafox®, which produce a delayed paralysis due to demyelination of motor axons (Johnson 1982). Workers exposed to the fumigant 1,2-dibromo-3-chloropropane unexpectedly experienced reduced or no sperm production (Thomas 1996). There have been many cases of poisoning and many more of suspected poisoning. However, most of the clinical cases have been due to gross overexposure in the course of misuse or suicidal use of the pesticide. (Levine 1991). In a survey of deaths from pesticide poisoning in England and Wales in 1945–1989, 73% of the recorded 1,012 deaths were due to suicides (Casey and Vale 1995).
It is difficult to generalize the toxicity of pesticides in a useful way. The target pest against which a pesticide is designed does not necessarily predict taxonomic risks of toxicity. For example, the fungicide methyl mercury has caused disproportionate mortality and morbidity in humans (Bakir et al. 1973, Hartung and Dinman 1972), and the herbicide paraquat
has been associated with a disproportionate number of suicides (Staiff et al. 1975). Nor does the chemical structure necessarily predict risk. In the case of the insecticides, the organophosphate insecticides range from the essentially nontoxic Abate®, which has been used to control mosquito larvae in drinking-water supplies, and Ruelene® , which has been used to control insect larvae that burrow into the skin of domestic animals, to the extremely toxic tetraethyl pyrophosphate, Systox®, Guthion®, and parathion, all of which are readily absorbed through the intact skin and by all other routes of exposures. The organophosphate insecticides differ substantially in toxicity and persistence. The basic mechanism of toxicity of all of the organophosphates is identical: inhibition of acetylcholinesterase (Mileson et al., 1998). However, that system is not the only one affected; organophosphates also inhibit other esterases to differing degrees, and some of these esterases are involved in the normal detoxification of organophosphate and carbamate insecticides. Consequently, combined exposures to several of these insecticides can result in synergistic, additive, and antagonistic responses (DuBois 1969).
Human exposures to pesticides occur through several routes (Ferrer and Cabral 1995). Exposures to pesticides in the general population tend to occur mainly through contact with residues in food or water but can also occur through accidental ingestion of seed prepared for sowing or through mistaken use of pesticides in food preparation because of their resemblance to food products. Occupational exposures to pesticides tend to occur mainly through dermal contact and inhalation. Occupational exposures constitute a distinct type and generally affect workers involved in the manufacture, transport, and application of these chemicals. Occupational epidemics tend to be more frequent in developing nations than in the United States, largely as a result of inappropriate technology transfer (for example, Senanayake and Peiris 1995). Nonetheless, occupational exposures have long been a source of concern in the United States.
The available statistics on poisoning by pesticides are difficult to compare because different agencies use different classifications and the classification schemes have changed over time. Reports on pesticide poisonings can be based on poison-control center reports, on hospital admission reports, and on reviewed clinical diagnoses. Even the quality of the information contained in death certificates is variable.
Manufacturing Risks
In general, the synthesis and formulation of pesticides are under better control than the later stages in the life cycle of a pesticide. Workers in manufacturing processes are under the direct or indirect supervision of occupational hygienists. Standards of permissible occupational exposures
are promulgated by the Occupational Safety and Health Administration, and threshold limit values proposed by the American Council of Governmental Industrial Hygienists for individual pesticides are enforced.
However, there have been excessive exposures and adverse effects associated with manufacturing processes. The best known of these are related to the production and synthesis of 2,4,5-trichlorophenol, the precursor of a number of chlorinated herbicides. The synthesis of 2,4,5-trichlorophenol was associated with the unavoidable trace byproduct 2,3,7,8-tetrachlorodibenzo-p-dioxin (TCDD). The major effects noted were chloracne and occasional liver damage (Firestone 1977, Pocchiari, F. et al. 1979, Coulston and Pocchiari 1983, Kimbrough et al. 1984) and porphyria (Bleiberg et al. 1964). Furthermore, TCDD has been shown to be carcinogenic in laboratory bioassays of rats and mice, and there is epidemiological evidence of its human carcinogenicity (Gallo et al. 1991). The herbicides that were based on 2,4,5-trichlorophenol have been removed from the market, because of the difficulties encountered in removing TCDD and related dioxin impurities.
Most of the chlorinated-hydrocarbon insecticides—such as DDT, dieldrin, aldrin, toxaphene, and chlordane, as well as TCDD—have been found to be carcinogenic in rodent bioassays. That experience has generally not been duplicated in humans. However, human exposures tend to be much lower, even under occupational conditions, than those attained during bioassays (Leber and Benya 1994). Many of the chlorinated-hydrocarbon pesticides are very fat-soluble and exhibit a tendency to bioaccumulate. For these reasons, most of the chlorinated hydrocarbon pesticides are no longer on the US market.
Packaging, Distribution, and Application Risks
The Secretary's Commission on Pesticides (HEW 1969) called attention to a number of cases of poisoning due to improper storage or spillage during transportation involving the insecticides endrin, dieldrin, diazinon, mevinphos, and parathion. Another prominent case involved a shipment of dyed seed grain to Iraq; it had been treated with methyl mercury as a fungicide, was washed to remove the dye, and was used for food. The instructions on the seed bags were only in English; as a consequence there were 6,530 cases of poisoning, with 459 deaths. (Bakir et al. 1973).
In normal use, the potential for the highest exposures occurs during the handling of the concentrated pesticides in preparation for application to crops. The application process is the source of many exposure scenarios. The highest exposures are likely to occur during ground applications, especially for spot treatments when the plants being treated are
taller than the applicator. Gardeners and nursery workers are likely to be exposured in enclosed environments. Exposures from broadcast or rotomisting can be relatively low or very high depending on the wind direction and strength in relation to the path taken by the applicator (Ecobichon 1996).
The exposure scenarios are only part of the assessment of the likely risk posed by pesticides. It is also important to know the extent to which specific pesticides are absorbed into the body and to know the quantitative and qualitative toxicity of the absorbed doses. The major routes of absorption of pesticides are inhalation, ingestion, and dermal absorption. For the applicator, all three routes can be important. The characteristics of the pesticide are also important. Most pesticides are readily absorbed when inhaled or ingested, and are also absorbed through intact skin. The rate of dermal absorption is influenced by molecular weight and by lipid solubility (Feldman and Maibach 1974, Moody et al. 1990). The problem is made more complex by the variance in permeability of the skin in different regions of the body. It is possible to absorb lethal doses of some organophosphate insecticides while walking through a freshly sprayed field, so intervals after spraying during which reentry into the field is not permitted have been established.
In many cases, incidents of acute poisoning are due to failures to observe safety regulations. In one conspicuous case, in California in 1989, workers harvesting cauliflower in a field sprayed 20 hours earlier with two organophosphate insecticides and one carbamate insecticide became ill after about 1 hour of exposure; at the time, state laws specified a 72-hour safety reentry interval (Ferrer and Cabral 1995). However, occupational exposures can occur even when safety regulations are enforced. In a review of pesticide poisonings of lawn-care and tree-service applicators reported to the New York State Pesticide Poisoning Registry in a 32-month period in 1990–1993, Gadon (1996) identified 28 unambiguous cases; 22 of the 27 people on whom information was available had been using protective equipment when the exposure occurred.
Residues in packaging materials can also be a source of substantial exposure and toxicity. One notable example involved a sack that had contained parathion. The sack was used to build a swing, and the percutaneous absorption was sufficient to kill two of five children using the swing (Hayes 1963).
Trends in Worker Safety Risk
The reporting of cases of poisoning due to pesticides is inconsistent by region, by circumstance, and over time. Nevertheless, trends begin to emerge at coarser scales of observation, especially when one concentrates
on regions that have better reporting schemes, such as California and some Florida counties. From 1951 to 1967, 151 deaths due to agricultural chemicals were reported in California; 34 of them were occupational (Baginsky 1967). The number of reported poisoning cases is always much higher than the number of reported deaths. In 1966–1970, reported poisonings ranged from 1,347 to 1,493 cases per year; organophosphate insecticides were the most common causative agents (Hartung 1975).
Since then, a number of regulatory actions have decreased the number of deaths attributable to exposures to pesticides. Among them were the withdrawal of organomercurial fungicides and some of the more toxic organophosphate insecticides from commercial use. Perhaps most important, the use of many of the more potent pesticides has been limited to trained and licensed applicators.
California is one of a few states that enforce mandatory physician reporting of all occupational pesticide-poisoning incidents, including follow-up investigations to verify exposure and effects and to determine the likelihood that the pesticide was responsible (Blondell 1997). Statistics gathered by the California Environmental Protection Agency (1995, 1996, 1997) indicate that the agency received 1,995-2,401 reports of poisonings per year during the period of 1993–1995. The agency concluded that 656–1,332 of the reports could have involved exposures to pesticides in an occupational setting. Chlorine and hypochlorite were most frequently reported as causing illness. Throughout the 1993-1995 period, incidents of worker illness due to miscommunication of reentry provisions occurred. Blondell (1997) and Arne (1997) revealed potential undercounting problems in statistics collected on pesticide poisonings and accidental pesticide deaths.
The number of deaths related to pesticide exposures decreased dramatically compared with that in previous decades. For 1993 (California EPA 1995), one death was reported: that of a man who ingested strychnine-coated seeds, apparently with suicidal intent. Three deaths were reported for 1994 (California EPA 1996): two elderly men ingested malathion, and one person entered a building while it was being fumigated. For 1995 (California EPA 1997), one death was reported: a person broke into a motel room while it was being fumigated.
Special Focus: Health Risks of Farm Workers and EPA Worker Protection Standards
The impact of pesticides on the short- and long-term health of the agricultural workforce is poorly documented (Alavanja et al. 1996, Sanderson et al. 1995). Because agricultural workers are exposed to much higher levels of pesticides than the general public, studies of this group
are more likely than studies of other groups to reveal relationships between health and exposure. Until recently the prevailing view has been that health studies of farm workers are very difficult to conduct because farm workers move often and are not generally interested in cooperating in studies. That view has been demonstrated to be inaccurate (e.g., Kamel et al. 1998). Some farm workers do move a lot, but others have home bases. Language barriers and concern over deportation are certainly issues,but it has been shown that these barriers can be overcome with appropriate use of camp aids by researchers who are sensitive to cultural issues.
Epidemiological studies conducted over the last 20 years point to some associations between particular pesticides and specific types of cancer (Zahm and Ward 1998) and subclinical neurological effects (Keifer and Mahurin 1997), but these studies have been limited in scope and technique. Most of the studies have focused on cancer incidence, have used case-control methods, and have been limited to small study populations. Recently initiated programs, such as the Agricultural Health Study (Alavanja et al. 1996)—which is being conducted cooperatively by the National Cancer Institute, EPA, the National Institute of Environmental Health and Safety, and the National Institute for Occupational Safety and Health (NIOSH)—are taking a more rigorous approach to the chronic health impacts of pesticides. The major results of these studies will not be available for many years and might not be able to point to specific pesticides that influence worker health. Nonetheless, the Agricultural Health Study is likely to produce important findings.
Some data exist on rates of acute, accidental pesticide poisonings, but problems with bias in reporting make it hard to estimate the true frequency of accidental poisonings (Arne 1997, Blondell, 1997). EPA and many farmworker advocacy groups view recent levels of such poisonings as unacceptable (EPA 1992, Davis and Schleifer 1998, Columbia Legal Services 1998).
In 1972, FIFRA was amended to broaden federal pesticide regulatory authority. EPA was given authority to ensure that registered pesticides were not used in a manner inconsistent with instructions on their pesticide labels. In 1974, EPA promulgated regulations under the title “Worker Protection Standards for Agricultural Pesticides” (40 CFR part 170). The regulations included
-
Prohibition against spraying workers and other people
-
Prohibition against reentry into a sprayed field before the pesticide had dried or dusts had settled, and a longer reentry period for 12 specific compounds
-
Requirement of protective clothing for any person reentering a field before the designated reentry time
-
Requirement for notifying workers regarding pesticide-related locations.
A 1983 EPA review of the 1974 FIFRA regulations designed to protect agricultural workers concluded that 40 CFR part 170 was inadequate. A major concern was the lack of enforceability. In 1992, after a long process of rule-making and public participation, EPA promulgated revisions to the 1974 rules (EPA 1992). The risk-benefit analysis in the 1992 Federal Register report stated that “EPA estimates that at least tens of thousands of acute illnesses and injuries and a less certain number of delayed onset illnesses occur annually to agricultural employees as the result of occupational exposures to pesticides used in the production of agricultural plants. These injuries continue to occur despite the protections offered by the existing part 170 and by product-specific regulation of pesticides. ” Additionally, The National Agricultural Statistics Service (NASS) estimated that 32,800 agricultural-related injuries occurred to children or adolescents under the age of 20 who lived on, worked on, or visited a farm operation in 1998. Many of these included exposures to pesticides (NASS 1999).
The 1992 regulations stated further that “the Agency believes that this (new 1992) rule will reduce substantially the current illness and injury incidents at modest cost to agricultural employers, pesticide handler employers, and registrants.” The estimated cost after the first year was predicted to be $49.4 million per year. “Assuming that the majority of the current acute illnesses and injury incidents...are prevented through compliance with this new rule, there will be significant benefits to agricultural workers and pesticide handlers.” In developing the new regulations, EPA indicated that the “minor use crops are the ones this Worker Protection Standard will impact the most. Much of agricultural labor is used in minor use crops, and it is in the production of these crops where the greatest chance of pesticide exposure to agricultural workers occurs.”
The rules in the 1992 Worker Protection Standard (WPS) apply to all farm, forest, nursery, and greenhouse operations. The WPS is not applicable to rangelands, pastures, livestock operations, postharvest operations, structural pest control, nonagricultural plants or noncommercial plants.
The 1992 WPS and amendments to it are complex, but the general guidelines are as follows:
-
General information on safe use of pesticides and facts about each
-
pesticide application on the farm (defined broadly) must be posted in a central, accessible location.
-
Pesticide-safety training must be provided to each pesticide handler and agricultural worker at least once every 5 years.
-
Decontamination sites must be established within.025 mile of all workers and handlers.
-
Commercial pesticide operators must inform the agricultural establishment of all facts regarding pesticide applications on the agricultural establishment property.
-
Emergency assistance must be given to any employee who is poisoned or injured by a pesticide, and facts about the exposure must be given to medical personnel.
-
Only appropriately trained and equipped handlers may enter treated areas during the restricted-entry interval (REI). The REIs for class I, II, III and IV pesticides are 48, 24, 12, and 12 hours, respectively.
-
Workers must receive oral or written warnings of pesticide application, depending on the pesticide label.
-
Warning signs must be posted before pesticide application and must be removed within 3 days after the end of the REI.
-
Spray equipment and personal protective equipment (PPE) must be cared for and be disposed of in accordance with specific rules (for example, all PPE must be stored and washed separately from other clothing).
Further discussion of the WPS guidelines, and of issues of compliance and the potential for improvement of the guidelines can be found in the last major section of Chapter 3.
Food Residues
Although the important contribution of pesticides to world food production cannot be ignored (Klassen 1995), exposure to residues from their use is a continuing concern. Pesticide residues can occur in food as a result of treatment of a food crop or food animal with pesticides, of inadvertent contact with the chemical through exposure to air or water contaminated with the chemical, or in the case of food animals, of consumption of feed contaminated with the chemical. The amount of residue encountered in these situations is a complex function of such factors as the treatment rate or contact level, the physical and chemical properties of the pesticide, the time between exposure to the pesticide and harvest of the crop or food animal, and the processing or other treatment of the food commodity prior to its consumption as human food. A complicating factor is the decomposition of the parent pesticide to one or more metabo
lites or breakdown products; decomposition products can be toxic and so need to be considered when dietary exposures are being calculated.
The occurrence and concentrations of pesticide residues in foods are monitored by several organizations (OTA 1988). USDA annually performs one of the most important surveys of fresh and processed fruit, grain, vegetables, and milk in the Pesticide Data Program as part of its efforts to meet the mandates of the FQPA. This effort includes collecting data on pesticide residues in foods most likely to be consumed by infants and children. FDA monitors residues in crops and other foods, harvested in and imported into the United States except meat, milk, and eggs, which fall under the purview of USDA. Several states, including California, Florida, and Texas, conduct random monitoring of residues in foods. And several food industries, most notably those dealing with infant food or such high-value products as wine and some packaged and canned foods, analyze food ingredients for pesticide residues.
The percentage of food that tests positive for pesticide residues is usually 20% or less for all pesticides (Archibald and Winter 1990). The frequency varies widely with the pesticide and the food commodity. For example, ethylene bisdithiocarbamate (EBDC) fungicides were found in 49 of 124 samples of succulent garden-variety peas but in only four of 100 samples of bananas (NRC 1993). Chlorpyrifos was found in 116 of 968 samples of fresh apples but in only nine of 751 samples of succulent peas (NRC 1993). The differences are in part a result of the specifics of registration (chlorpyrifos is registered for use on apples but not on succulent peas) and of the percentage of acreage treated even when registration and a tolerance exists for a chemical-commodity combination.
When residues are detected, they rarely exceed established tolerance limits. Of all FDA surveillance samples, both domestic and imported, 3% or fewer were found to be in violation (Archibald and Winter 1990). Violations are very rare because tolerances are set to take into account the maximal residue expected at harvest when the pesticide is used according to its label. Violations also occur when a residue is found on a commodity for which there is no registration for the pesticide found—often the result of illegal use or inadvertent residue contamination.
The concern over pesticide residues in foods has many dimensions. Some pesticides, such as benomyl and EBDCs, or their metabolites (ethylene thiourea-ETU is a metabolite of EBDC) are animal carcinogens or suspected carcinogens (NRC 1987, Winter 1992). Their presence in foods can increase the risk of death due to cancer. Risk is proportionate to the frequency with which a residue is encountered, the concentration of the residue, and the frequency of consumption of foods containing the residue. But because carcinogens do not appear to act through a threshold
mechanism (NRC 1987), any residue consumed can produce a statistical increase in lifetime dietary cancer risk.
Population subgroups differ in exposures to residues. Infants and children, for example, can receive higher exposures to pesticides that occur regularly as residues on such foods as apples, bananas, and pears because they consume more of these foods than adults and because they are smaller than adults. Their exposure to a pesticide in these foods is higher, on a bodyweight basis, than adults' (NRC 1993). The higher exposure, combined with the greater susceptibility of infants and children to some pesticides, can increase risks for these population subgroups.
People can be exposed through water or air or by dermal contact, in addition to food intake. Thus, their total, or aggregate, exposure can be considerably higher than their exposure via food intake. Exposure can be to several chemical residues simultaneously because some commodities are treated with more than one pesticide and because people consume many foods, any or all of which can contain residues. The effect of these cumulative residues and whether they act independently of each other or in an additive or synergistic manner, are subjects of active debate.
Other acute or chronic effects in people can be associated with residues in food, particularly in the context of illegal use of pesticides. Although aldicarb is still used legally on some food crops, thousands of people in the western United States became ill in 1985, some seriously, from consuming watermelons contaminated by the illegal use of this insecticide. Although random, composite sampling might show the remaining residues to be well within tolerance, there is some concern that individual samples or other commodity units could contain above-tolerance, possibly harmful residues (NRC 1993). Suspicions regarding potential teratogenic, neurotoxic, or hormone-disrupting effects also exist for some chemicals or residue mixtures; these are additional subjects of current research and public interest.
The concentration of pesticide residues in foods and the frequency with which they occur have decreased substantially in recent years. Data on pesticide residues in foods are generally available from field trials conducted by the registrant, monitoring programs of FDA and state agencies, and marketbasket surveys of FDA and USDA. Marketbasket surveys—such as FDA's Total Diet Study, in which foods purchased from supermarkets and prepared for consumption are analyzed—provide perhaps the best record of dietary intake, although the data are few. Marketbasket surveys support the idea that, generally, very low exposure to pesticide residues occurs through foods in the United States.
In part, the low exposure is due to the effects of commercial processing and food preparation (NRC 1993, Elkins 1989, Gelardi and Mountford 1993). The decline in food residues has occurred in large part, however,
because of changes in pesticide chemistry and improved monitoring of the food supply. Pesticide chemists now favor the use of chemicals of lower stability, which break down substantially before harvest and before human consumption of foods. The stable organochlorine insecticides in wide use in the 1940-1980 era (such as DDT, toxaphene, and chlordane) have been replaced with less-persistent, less-bioaccumulative chemicals. And, many modern chemicals are effective at much lower dosage, so the absolute amount of residue on treated food is one-tenth or less of the amounts of the older chemicals that they replace. That is not in itself a guarantee of less risk to consumers, but it turns out that modern chemicals generally have higher margins-of-safety than the older chemicals. Furthermore, current patterns of pesticide registrations (Figure 2-4) suggest that a greater proportion of the modern pesticides are considered reduced risk chemicals (EPA, 1999).
The FQPA (1996) poses even more challenges to industry to decrease risks from exposure to pesticide residues (FQPA 1996, McKenna and Cuneo 1996). Both aggregate-exposure chemicals and cumulative-exposure chemicals must be considered in risk assessment. Exposures of sensitive subpopulations, such as infants and children, are to be given even more attention than that afforded as a result of the National Research Council's 1993 report (NRC, 1993). Risks due to disruption of endocrine systems must be addressed with new tests in the chemical evaluation phase. A single health-based standard for pesticides in foods was established, replacing the paradox created by application of the “Delaney clause” (which was eliminated by the FQPA) to processed foods (NRC 1987).
Soil, Air, and Water Exposures
An understanding of the transport and fate of pesticides in the environment is required to evaluate the potential impact of pesticides on human health and the environment; for example, it is needed to conduct risk assessments, such as evaluating the probability that a pesticide application will contaminate groundwater. Such knowledge is also required to develop and evaluate methods for remediating environmental contamination. Just as important, knowledge of contaminant transport and fate is necessary to design pesticides and application strategies that minimize adverse impacts.
The four general processes that control the movement of chemicals in the environment are advection, dispersion, interphase mass transfer, and transformation reactions. Advection, also referred to as convection, is the transport of matter by the movement of a fluid responding to a gradient in fluid potential. For example, a pesticide dissolved in water will be

carried along by the water as it flows through (infiltration) or above (runoff) the soil. Dispersion is the spreading of matter about a mean position, such as the center of mass; spreading is caused by molecular diffusion and nonuniform flow fields. Interphase transfers —such as sorption, liquid-liquid partitioning, and volatilization—involve the transfer of matter in response to gradients in chemical potential or, more simply, concentration gradients. Transformation reactions include any process by which the physicochemical nature of a chemical is altered; examples are biotransformation (metabolism by organisms) and hydrolysis (interaction with water molecules). Additional information regarding the factors and processes that influence the transport and fate of contaminants in the environment can be found in Pepper et al. (1997).
The fate of a specific pesticide in the environment is a function of the combined influences of those four processes. The combined impact of the four processes determine the “pollution potential” and “persistence” of a pesticide in the environment. The pollution potential characterizes, in essence, the “ability” of a pesticide to contaminate the medium of interest (soil, water, or air). Pesticides with larger pollution potentials are generally transported readily (for example, low sorption) and not transformed to any great extent (they are persistent). High rates of transport mean that a pesticide readily moves away from the site of application. A low transformation potential means that a chemical will persist, and thus maintain its hazard potential, for a longer time than one with a high potential. The risk posed by a specific pesticide to humans or other receptors is, of course, a function of its toxicity, as well as its pollution potential. It is therefore important to understand both types of properties. For example, pesticides that are very mobile, persistent, and highly toxic will generally be associated with the greatest risk.
Once a pesticide is applied to or spilled onto soil, it can remain in place, or transfer to the air, surface runoff, or soil-pore water. Transfer of pesticides to surface runoff during precipitation or irrigation is a major concern associated with non-point-source pollution. Once entrained into surface runoff, a pesticide can be transported to surface-water bodies. Consumption of contaminated surface water is a major potential route of exposure to pesticides. A recent discussion of pesticides and non-point-source pollution is presented in Loague et al., (1998).
The other major potential soil-water route of pesticide exposure of humans is consumption of contaminated groundwater. Once applied to soil, a pesticide can partition to the soil-pore water. It then has the potential to move down to a saturated zone (aquifer), thereby contaminating the groundwater. Whether that occurs, the time it takes, and the resulting degree of contamination depend on numerous factors. Major factors are the magnitude and rate of infiltration and recharge, soil type, depth to the
aquifer, quantity of pesticide applied, and its physiochemical properties (such as solubility, degree of sorption, and transformation potential). Volatile pesticides can move by advection and diffusion in the soil-gas phase in addition to the pore-water phase, and these provide additional means to travel to an aquifer.
The transport and fate of pesticides in porous media (such as soil) and the potential for pesticides to contaminate groundwater have been the subjects of an enormous research effort. The initial paradigm for transport of chemicals in porous media was based on assumptions that the porous medium is homogeneous and that the rates of inter-phase mass transfer and reaction are linear and essentially instantaneous. However, it is well known that the subsurface is in fact heterogeneous, and that many phase transfers and transformation reactions are not linear or instantaneous. In addition, the transport of many contaminants is influenced by multiple factors and processes (Brusseau 1994). The transport and fate of pesticides in the subsurface are complex and generally difficult to predict accurately.
An example of the complex behavior of chemicals in soil is the long-term persistence observed in many field studies. The results of several studies have shown that chemicals, including pesticides, that have been in contact with soil for long times are much more resistant to desorption, extraction, and degradation. For example, contaminated samples taken from field sites exhibit solid:aqueous distribution ratios that are much larger than those actually measured or estimated on the basis of spiking the porous media with the same contaminant (adding contaminant to an uncontaminated sample) (Steinberg et al. 1987, Pignatello et al. 1990, Smith et al. 1990, Scribner et al. 1992). In addition, the desorption rate coefficients determined for previously contaminated media collected from the field are much smaller than those obtained from spiked samples (Steinberg et al. 1987, Connaughton et al. 1993). The confounding aspect of those results is that they are often observed for chemicals that would not necessarily be expected to exhibit substantial persistence, because they are, for example, volatile or readily degradable. The mechanisms for such behavior are unclear and are the subject of current investigation. Additional information on the transport and fate of pesticides in soil and groundwater can be found in several books (Sawhney and Brown 1989, Cheng 1990, Linn et al. 1993).
As discussed in a recent NRC (1994), it is difficult to remediate contaminated soil and groundwater. There are three general approaches: control, removal, and in situ treatment. The purpose of control-based approaches, which include the use of well fields (hydrodynamic control) and physical barriers (slurry walls), is to prevent further migration of the contamination. The purpose of removal-based ap-
proaches—which include excavation, the pump-and-treat method, and soil-vapor extraction—is to remove the contamination from the subsurface. The purpose of in situ treatment, which includes in situ bioremediation and in situ chemical transformation, is to reduce or eliminate the mass of the hazardous chemical in place. Any of those methods can be successful for a specific site under specific circumstances. However, because of the complexity of the subsurface and the physiochemical nature of many contaminants, the effectiveness of any remediation method will be constrained in many cases. As a result, subsurface remediation is expensive, and there is no guarantee of complete success. Although advances in remediation and characterization technologies continue to be made, it remains true that pollution prevention is much cheaper than pollution remediation in the long term.
Pesticides enter the air by a variety of processes. Drift during application can result in the entry of small aerosol particles and vapors into the air and their movement downwind from the spraying operation. After application is completed, additional residue can enter the air by volatilization and wind erosion. The resulting residue, both particles and vapors, can travel downwind, where deposition can occur by the wet processes of rainfall, snowfall, and fog coalescence washout or the dry processes of vapor exchange with surfaces and fallout of particles. Degradation can accompany the downwind processes, and the products of decomposition can join the parent-chemical residue in further transport and deposition.
Airborne pesticides can undergo long-range transport to remote environments (Kurtz 1990). The presence of residues of organochlorine chemicals in the earth's polar regions, where they accumulate in the body fat of Inuits and in seals and polar bears, is evidence of the operation of a “cold condensation” mechanism that moves residues from temperate and tropical areas of use to colder regions (Wania and Mackay 1993). The finding of current-use chemicals in the alpine and subalpine regions of the Sierra Nevadas (owing to airborne movement from California's farming valleys) (Zabik and Seiber 1993) and in the polar regions is a cause of continuing concern about long-range movement of pesticides.
There are several reasons to be concerned about airborne residues (Seiber and Woodrow 1995). Airborne residues can represent a direct hazard to humans, wildlife, and vegetation. The human hazard might be most prominent for farm workers who apply chemicals or work in and around treated fields. But people who live, work, or play downwind can also be exposed. The recent hypothesis of possible endocrine system disruption by exposure to “background” chemicals has raised concern about the potential of adverse population-level effects of ecosystem-scale contamination, such as can be caused by airborne residues (Arnold et al.
1996). Atmospheric residues might cause large-scale, long-term effects that are only slowly reversible. The entry of methyl bromide, a fumigant (see Box 2-1) into the stratosphere and its contribution to the depletion of the earth's protective ozone layer have resulted in the planned phaseout of this chemical by the year 2001.
Generally, the dermal route of contact is much greater than the respiratory route in occupational exposures and those immediately downwind. But important exceptions occur for very volatile pesticides, particularly fumigants, such as methyl bromide, ethylene oxide, and telone (Ecobichon 1991). For example, accidental deaths are reported each year that are due to occupational and nonoccupational exposure to fumigants used in confined spaces (Mehler et al. 1992). Downwind exposures of nontarget plants and animals can also occur, with herbicide damage the most obvious example. Downwind exposures can involve contact with airborne residues or with deposited residues in soil, vegetation, or water. Multimedia exposures might be more important for plants and wildlife than for people, although certainly people can be exposed unintentionally to deposited residues.
Atmospheric residues constitute a missing element in the chemical mass balance of a pesticide. Residues that leave the target area in the air pose an economic loss to the grower because they consist of chemical that is no longer available for pest control. From a broader perspective, losses to the atmosphere consist of mass that can no longer be accounted for or controlled. Given the large losses to the air that occur in some cases of pesticide use, it is difficult to convince an already wary public that pesticides are safe when substantial portions leave the target zone and end up where they are not needed or wanted. Few instances are known or reported in which downwind airborne residues have resulted in measurable harm to people under normal agricultural pesticide-use conditions. The use of application buffer zones and other restrictions on the use of such chemicals as methyl bromide, which has a tendency to volatilize, or paraquat, whose toxic action is on the lung, has minimized exposures (Baker et al. 1996). But concerns still exist among downwind residents, and these concerns are driving attitudes toward pesticide usage that cannot be dismissed. It might become more important in the future to pay special attention to ways to reduce off-target airborne loss of chemicals by improving application efficiency, imposing additional environmental-use conditions on applicaters, and encouraging the use of pesticides that experience minimal loss to the atmosphere (because of low vapor pressure, effectiveness at low dosage, and rapid environmental degradation) (Seiber and Woodrow 1998).
As discussed, the release and transport of pesticides in the environment are complex and can have many adverse effects. Thus, a question of
|
BOX 2-1 Fumigants Fumigants are a loosely defined group of pesticide active ingredients and formulations that act through partial or sole distribution of the chemical and delivery to the target in the vapor form (Ware, 1983). Fumigants include chemicals applied to the soil before harvest to control nematodes, insects, and undesirable microorganisms (soil fumigants). They also include chemicals used after harvest to control pests in harvested commodities before storage or transport to markets and chemicals used to rid infested buildings of termites, cockroaches, and other pests. Fumigation is a specialized use that has recently attracted unusual interest because of the visibility of some fumigation operations and the past contribution of fumigants to human health and environmental problems. Several fumigants have been withdrawn or banned, and several current fumigants are undergoing reevaluation or phaseout. Dibromochloropropane (DBCP), a soil nematicide, was widely used because it could be used after planting on numerous fruit and vegetable crops susceptible to nematode root infestation. In 1977, it was withdrawn after it was found to cause sterility in male workers exposed during manufacture. Coming from areas of manufacture, formulation, and use, it was also a contaminant in groundwater. Its registrations, except for use on pineapples in Hawaii that was deemed essential for production, were canceled by EPA in 1979. Ethylene dibromide (EDB) enjoyed widespread use as a preharvest soil fumigant to control nematodes, eggs, and soil insects. EDB was a widely distributed groundwater contaminant, partly because of its water solubility, method of use (injection into soil followed by irrigation to improve penetration), high rate of use, and stability. In one summary, wells in six states were reported to be contaminated with EDB; this resulted in contamination of 520 wells (of 5,133 tested) above the health advisory level for drinking water. Health concern resulted from positive carcinogenic testing in experimental animals. The use of EDB was cancelled by EPA in the early 1980s. Methyl bromide is a highly effective preplant fumigant with wide use on high-value crops—such as citrus, other fruit, and nut orchard crops; grapes; and strawberries—and in nurseries. After the cancellation of EDB and DBCP, it became the fumigant of choice because of its effectiveness against a wide spectrum of pests, including arthropods, nematodes, fungi, bacteria, and weeds (Noling, 1997). Methyl bromide is an effective postharvest fumigant for stored nuts and other commodities, and its use is required in some cases to circumvent quarantine of produce that might, through shipping, transport pests into uninfested areas. It is also used to fumigate structures; this use has resulted in a few fatal accidents when reentry regulations were not followed after treatment with the chemical. Methyl bromide is a gas at ambient conditions and leaves no organic residue in the treated soil or commodity, because it breaks down to bromide and eventually carbon dioxide. But methyl bromide is stable in the atmosphere, creating a potential for exposure among workers and downwind residents and for diffusion to the stratosphere, where its interaction with high-energy ultraviolet radiation sets off a series of reac- |
|
tions that lead to depletion of stratospheric ozone (Methyl Bromide Global Coalition, 1992). Because of its ozone-depleting potential, methyl bromide is scheduled for phaseout in the United States by the year 2001 as a consequence of rules in the 1990 Clean Air Act Amendments and Montreal Protocol agreements (Honagonahalli and Seiber, 1997). In 1993, nearly 15 million pounds of methyl bromide were used in California (California Environmental Protection Agency, 1994), partly because of the unusually high application rate—up to 500 lb/acre in some preplant uses. There is some anxiety regarding the availability or suitability of alternatives to methyl bromide if the scheduled phaseout occurs. Current registered alternatives are 1,3-D (1,3-dichloropropane, Telone II) and metam sodium, which generates the active fumigant methylisothiocyanate when the parent chemical breaks down in soil or water. Telone was placed in the reregistration and special-processes review by EPA in 1986; this requires EPA to conduct a risk–benefit analysis leading to a regulatory decision (Roby and Melichar, 1996). Telone was also suspended by the California Department of Pesticide Regulation (DPR) in 1990 after air monitoring showed residues above the state's acceptable air concentration limit around fumigated fields in California's San Joaquin Valley. The suspension was lifted in 1994 on the basis of changes in application practice and additional monitoring studies conducted by the registrant and further review by DPR. MITC received adverse publicity after a 1991 spill of metam sodium in the Sacramento River that caused widespread intoxication of fish and other aquatic organisms and loss of vegetation. But metam sodium registration continues, and the product is finding expanding markets as the regulatory status of methyl bromide and Telone remains in some question. Another alternative is chloropicrin, which is often used as an odorant or residual pesticide in combination with methyl bromide and other mainstream fumigants. Other fumigants include phosphine, which is released from aluminum and other phosphide salts for control of rodents and other vertebrate pests, and sulfuryl fluoride (Vikane). Nonfumigant pesticides, such as carbofuran and methomyl, can be substituted for fumigants in some soil pest-control situations. Nonsynthetic alternatives to fumigants are also receiving increasing attention. These include solar heating and natural nematicide chemicals present in some plants in the case of soil fumigation and controlled atmospheres and heating in the case of postharvest and building-space fumigation. The fumigant situation is a highly visible, somewhat controversial dilemma that faces conventional pesticides on many fronts. Long-standing, well-accepted chemicals can come under increasing scrutiny as a result of some adverse characteristic (chronic toxicity in experimental animals, groundwater contamination, stratospheric ozone depletion) or changes in federal or state regulations. Registrants conduct additional studies to preserve registration of their products. Agriculturists worry about whether loss of productivity will result if particular pesticides are no longer available. Some in the public sector call for swift action in removing or restricting offending chemicals. And researchers go back to the drawing board to devise new solutions to pest problems. |
critical concern is, to what extent have pesticides contaminated the environment? One way to address the question is to examine the occurrence of pesticides in surface water, groundwater, and air. An analysis of such occurrences in the United States has recently been reported under the auspices of the National Water-Quality Assessment Program of the US Geological Survey (USGS) (Majewski and Capel 1995, Barbash and Resek 1996, Larson et al. 1997). The reports compile and synthesize the many occurrence studies that have been conducted in the United States. In addition, the results of a recent data-collection program for groundwater conducted by USGS have been reported (Kolpin et al. 1998). The results from the latter study are used below to illustrate the occurrence of pesticides in the environment.
To examine pesticide occurrence in groundwater, samples were collected from recently recharged groundwater (generally less than 10 years old) in 41 land-use areas scattered throughout the United States. As reported in Kolpin et al. (1998), pesticides were detected at 54.4% of the 1034 sampling sites. Many pesticides were found; 39 of the 46 that were looked for were detected. Pesticide concentrations were generally low; more than 95% of the detected concentrations were less than 1 µg/L. Maximal contaminant concentrations developed by EPA for drinking water, which have been established for 25 of the 46 pesticides, were exceeded for only one pesticide at a single location. Pesticides were detected in both agricultural (56.4%) and urban (46.6%) locations.
Those results indicate that pesticides are widespread in shallow groundwater. As noted in Larson et al. (1997), they are also widespread in surface waters. The potential impact on human health is uncertain, given the relatively low concentrations and the lack of understanding of the impact of low concentrations on human health. In addition, more than one pesticide is often found at a site. For example, two or more pesticides were detected in shallow groundwater at 73% of the sites where pesticides were detected (Kolpin et al. 1998). The impact of chemical mixtures on human health is unclear. The widespread detection of pesticides in urban areas illustrates the fact that pesticide use and its associated problems are not confined to agricultural applications. Clearly, strategies for minimizing the impact of pesticides on human health and the environment will be successful only if all uses of pesticides are considered.
Ecological Problems: Impacts on Nontarget Organisms
The basic intent in the design of pesticides is to produce substances that are highly toxic to pest species, but much less toxic to the nonpest species so that there can be a useful margin of safety. The toxicity to each species is related to the characteristics of the substance and to the dose
absorbed by the organism. There appear to be no substances that are nontoxic to all species regardless of dose.
Because the status of any particular organism as a pest depends not on its taxonomy or physiology, but rather on whether its ecological role brings it into conflict with humans, it is to be expected that pest species often share many biochemical pathways, physiological functions, anatomical features and life history attributes with nontarget species. Therefore, it should be obvious that it is difficult to design pesticides that exhibit ample margins of safety with respect to all nontarget species. Given the large number of potential pest species and the plethora of commercial and nontarget species, it is also very rare to have pesticides available containing the desired specific activity against target pests.
However, degrees of specificity are readily apparent. Specificity varies with likelihood of encounter or exposure. A general difference between humans and insects, for example, is that insects are much smaller. The basic body plans of animals can be summarized as a collection of spheres and cylinders whose surface areas increase according to the squares of the applicable radii, and whose volumes increase according to the cubes of the same radii. That translates into disproportionately greater surface area in relation to body volume or mass as organisms become smaller. The ratio of surface area to body mass in insects relative to their body mass can easily be 100 times the ration in humans and common domestic animals. That has the direct effect of proportionally increased absorption rates in case of the insects. The combination of rapid absorption rate and small volume into which the pesticides are being absorbed results in a rapid attainment of the maximal concentration (or dose). Ease of absorption associated with proportionately large surface areas is also exploited in the case of pesticides used with other arthropods (acaricides, nematicides, and so on). The comparatively large surface area of plant leaves has also been used with some herbicides to provide selectivity against broad-leaved plants.
Probability of exposure notwithstanding, perhaps the most important consideration in determining the probability of nontarget effects is the degree of biochemical or physiological similarity to the target species. Nontarget effects of broad-spectrum pesticides are thus to be expected; these compounds are aimed at target sites that are widely distributed among organisms. The degree of risk often correlates highly with the degree of resemblance to the target pest. There is ample documentation of the nontarget effects of the early chlorinated hydrocarbon insecticides on nontarget insects; the phenomena of secondary pest problems and pest resurgence are attributable in large part to the greater toxicity of these insecticides to arthropod natural enemies than to arthropod target species. However, pesticides with even narrower modes of action can have
nontarget effects that reflect degree of similarity. Insecticides that act as chitin-synthesis inhibitors have historically caused problems among aquatic crustaceans, which as arthropods synthesize chitin for exoskeleton production, when residues contaminate watersheds.
Shifts to more narrow-spectrum compounds administered at lower rates were motivated partly by the desire to reduce nontarget effects; reducing environmental persistence also contributes to reducing the likelihood of encounter by nontargets. However, according to some sources (Benbrook 1996), these shifts might not have reduced nontarget effects as much as intended. Croft (1990) summarized data on the impact of 400 pesticide active ingredients on over 600 species of beneficial arthropods. His basic finding, as might have been predicted, was that insecticides have greater impacts than either herbicides or fungicides. However, calculation of selectivity ratio (the ratio of LD 50 for target species to LD 50 for nontarget species) suggested that toxicity to nontarget arthropods, partly because of the toxicity of synthetic pyrethroids, has increased (Benbrook 1996), although statistical analysis of such data presents challenges.
A major concern historically about the use of insecticides has been nontarget effects on vertebrates. Organophosphates and pyrethroids continue to present toxicity problems in fish and have been associated with major fish kills on several occasion after aerial spraying. Data compiled by the US Fish and Wildlife Service (Mayer and Ellersieck 1986) on over 400 chemicals suggest that sensitivity varies with species, age, and water temperature. Concerns also exist about nontarget effects on terrestrial vertebrates; indeed, food-chain effects culminating in reproductive failures in birds contributed substantially to raising public awareness and activism with respect to pesticide regulations (for example, Carson 1962). Many of the chlorinated hydrocarbon pesticides exhibited very high lipid solubility. Consequently, they were readily absorbed, bioconcentrated, and biomagnified, especially in food webs that terminated with top predators (Peterle 1991). That exposure altered calcium disposition, especially in some species of predatory birds, which led to reproductive failure due to the thinning and breaking of the eggshells (Cramp 1963) and to serious declines in populations, especially of peregrine falcons, ospreys, and brown pelicans. Since the banning of DDT, most of the predatory-bird populations have recovered substantially (Peterle 1991, Robbins et al. 1986, Greig-Smith 1994).
Although many of the older compounds with such properties have been banned, organophosphates and carbamates still in use have been implicated in nontarget effects on songbirds, waterfowl, and game birds. Indirect effects on terrestrial birds and mammals have been documented; insecticide use can reduce cover and prey abundance and thus lead to
greater mortality (Blus and Henry 1997). Also recorded are secondary and tertiary poisonings resulting from ingestion of contaminated bird prey by raptors and other birds of prey.
Developing pesticides with specific modes of action has been given a high priority to reduce nontarget effects. Very high degrees of specificity in the control of some animal pests can be gained through such techniques as the use of specific pathogens, sterile-male techniques, and the use of species-specific pheromone blends, although the utility of these approaches depends on the availability of specific pathogens and the appropriateness of the mating habits of the pest species. However, unexpected nontarget effects have arisen even when metabolic resemblances seemed unlikely. A number of herbicides derive their potency against plants from their ability to inhibit photosynthesis. That generally affords a greater margin of safety toward animals. The phenoxy acetic acid herbicides 2,4-D (2,4-dichlorophenoxy acetic acid), 2,4,5-T (2,4,5-trichlorophenoxy acetic acid), and Silvex (2,4,5-trichlorophenoxy propionic acid) are specific to broad-leaved plants and woody plants by mimicking plant growth hormones. The trichloro compounds were removed from the market because they could not be produced without the highly toxic dioxin or TCDD as an impurity (Leung and Paustenbach 1989). Indeed, many of the pesticides with putative endocrine-disrupting effects in humans are herbicides or fungicides (Clement and Colborn 1992), and some herbicides might have unexpected toxic effects by virtue of their ability to inhibit detoxification enzyme systems (Benbrook 1996).
Specificity is not always the goal of pest management. It is often desirable to remove all plants from a particular plot. Such intentionally nonspecific applications make use of fundamental biochemical processes, but are still subject to the surface area-volume limitations. The herbicides 2,4-dinitrophenol and 2,4-dinitro-o-cresol inhibit the organic phosphorylation of adenosine diphosphate to adenosine triphosphate, which is centrally important in all higher plants and animals. Consequently, those two herbicides have been widely used to clear rights of way, and they have had to be used with caution by the applicater, who is also susceptible to the inhibition of organic phosphorylation.
The application of pesticides results in indirect effects on ecosystems by reducing local biodiversity and by changing the flow of energy and nutrients as the biomasses attributable to individual species are altered. Numerous studies have shown that pesticides decrease crop loss, but the potential indirect environmental impacts of pesticides have not been widely studied. An ecological perspective of pesticide effects include direct and indirect effects on all associated organisms, not just the pests in question. Thus, ecosystem impacts of pesticides can include effects on human health, domestic and wild animal response, effect on natural en-
emies of pests, crop pollinators and honey bee response (Buchmann and Nabhan 1996), and soil microorganism community response. Domestic and nontarget wild animals can be poisoned by direct contact with pesticides (particularly rodenticides) and by feeding on contaminated pests (Barton and Oehme 1981, Beasley and Trammel 1989). Deleterious effects of pesticides on wild birds include death from direct exposure or from eating contaminated prey (Flickinger et al. 1991, Stone and Gradoni 1985, White et al. 1982).
Indirect effects come about as a result of alterations by pesticides in ecosystem trophic dynamics. Birds, for example, experience reduced survival, growth and reproductive rates, and habitat through elimination of food sources and refuges (McEwen and Stephenson 1979, Potts 1986). It has been suggested that native wild bird populations or communities can be good indicators of ecosystem integrity because they tend to be sensitive to vegetation structural changes and disruption of food webs over several trophic levels (Blus and Henery 1997, Fry et al. 1986, Landres et al. 1988). Many birds feed on diverse insects, particularly at early developmental stages, and on a wide array of seeds as they mature (Ehrlich et al. 1988). Further research on bird population responses to pesticides and as ecosystem- integrity indicators may be warranted.
Weed species shifts can result from intensive and consistent use of herbicides. In this case, herbicides cause local extinction of some weed species and thus leave an ecological niche for species that have greater tolerance of, can avoid, or are resistant to the herbicide. Fryer (1982) showed that the frequency of many broadleaf weed species in cereal production fields of Great Britain declined and the grass weeds (such as Avena fatua and Alopecurus myosuroides) increased as a result of 40 years of routine use of the selective broadleaf herbicide 2,4-D. Weeds that are taxonomically closely related to the crop are often selected because of common physiology and therefore similar response to a herbicide. Weeds in the Solanaceae family are common in potato and tomato crops (same family) in which trifluralin is commonly used as a selective herbicide. Most solanaceous weeds are tolerant of trifluralin.
Pesticide effects on nontarget beneficial organisms have not been extensively studied for most agricultural systems. However, in agroecosystems where some studies have been conducted, maintenance of crop monocultures with pesticides has created simplified plant and insect communities dominated by a few pests (Ryszkowski et al. 1993). Several studies have shown that as structural diversity is increased with intercropping or weeds, the diversity of pest and beneficial insects increases, but damage by insect pests is generally reduced (Altieri et al. 1978, Dempster 1969, Dempster and Coaker 1974, Perrin 1977, Foster and Ruesink 1984, Risch et al. 1983, Tahvanainen and Root 1972, Van Emden 1990). There is
some evidence biological control of insect pests can be maximized by increasing the availability of alternate hosts such as weeds (Debach and Rosen 1991, Van Emden 1965, vanEmden 1990, Powell 1986, Rabb et al. 1976). Fungicides could contribute to weed or insect outbreaks by reducing natural pathogenic fungi on these pests (Johnson et al. 1976).
Honey bees and wild bees are important as pollinators in many crops (Robinson et al. 1989), as well as for production of honey. Yearly costs of direct honey bee losses and of yield reductions resulting from reduced pollination in response to off-target response to insecticides are high (Pimentel et al. 1992). In addition, weed control by herbicides can have negative effects on pollinators by selectively removing important nectar sources.
Microorganisms and invertebrates play an important role in biogeochemical cycling of carbon, energy, water and nutrients essential for crop growth. Maintenance of these cycles is critical for ecosystem integrity (Brock and Madigan 1988). Pesticides can disrupt these processes with even sublethal effects on the microorganisms. Little is known about the dynamics of soil microorganism communities and their response to pesticides. The potential for disruption—though interference with mycorrhizal associations, nutrient uptake, or susceptibility to disease —is great (see references cited in Benbrook 1996).
PUBLIC PERCEPTION OF PESTICIDES
It is widely believed by the US public that pesticides pose substantial dangers to the population at large through residues on foods and ground-water contamination, to farmworkers through occupational exposure, and to wildlife and the environment. Numerous surveys conducted in 1984–1990 scattered across the United States showed that most Americans had serious concerns about pesticide residues on foods (Sachs et al. 1987; Jolly et al. 1989, Food Marketing Institute 1989, Porter Novelli 1990, Dunlap and Beus 1992, Weaver et al. 1992). The concern might have diminished since then. A national poll conducted in 1994 found that about 35% of Americans believed that pesticides were very dangerous for themselves and 38% believed that pesticides were very dangerous for the environment (National Opinion Research Center 1994) —about half the percentages reporting such concerns only a few years earlier.
Whether scientifically valid or not, public perception of pesticide risks has an important effect on the development of pesticide regulations and on food purchases (Jolly 1991, Bruhn et al. 1992). According to a report sponsored by the Council for Agricultural Science and Technology (van Ravenswaay 1995), research on public perception of pesticide risks “is in its infancy, and more research is needed to develop valid and reliable
theories, methods, and conclusions about public perception of agrichemicals and other agricultural technologies.” Although there are important limitations to available research results, existing studies offer useful insights into both the perceptions themselves and ways to improve research on public perception.
A number of studies have emphasized the great diversity in perception of pesticide risk among segments of the US population (for example, Jolly 1991, Baker and Crosbie 1993, van Ravenswaay and Hoehn 1991a). Van Ravenswaay and Hoehn (1991a) found that about 25% of over 900 participants in a nationwide survey felt that there was a 1% or greater chance that someone in their household would “have health problems someday because of the current level of pesticide residues on their food”; 4.4% of the participants felt that such residue-related health problems were certain to occur. In contrast, almost 25% of the participants felt that the chance of such health problems was less than 0.0001%, and 4.1% thought that there was “no chance” of such problems. People seem to vary widely in their assessment of how harmful pesticide residues are for their health. However, the diverse responses could also reflect differences in how people in the survey defined “health problems”.
A survey of households in Seattle, Washington, and Kobe, Japan (Jussaume and Judson 1992), assessed the affect of household characteristics on concern about food safety. In general, the Kobe households were more concerned about food safety than the Seattle households. Households with children under 18 years old and households with incomes below $50,000 per year (10,000,000 Yen) were less likely to trust the safety of government-inspected foods. Other studies have found a negative relationship or no relationship between education and concerns about pesticides (Misra et al. 1991, Dunlap and Beus 1992). Jussaume and Judson (1992) found that households in which more vegetables were consumed were more concerned about food safety and had less trust in government, business and farmers than other segments of the sample.
It is difficult to compare results of those studies because they sampled different geographic areas and presented different questions (or posed similar questions in a different way). Sachs et al. (1987) tried to address that problem in assessing whether public concern about pesticide use had increased between the 1960s and the 1980s. They essentially replicated a study of Bealer and Willits (1968) conducted 19 years earlier. The results indicated that in 1965 94% of the public felt that the “government adequately regulates chemical use in or on food.” In 1984, only 48.9% of respondents agreed with that statement. Other measures of risk posed by pesticide residues also increased dramatically.
Instead of simply documenting the level of concern about pesticide risks by direct inquiry, a few surveys were designed to incorporate a
method called “contingent valuation” to assess how much a consumer is willing to pay for implementation of measures that could decrease the risks posed by pesticide residues on food. A commonly used measure of potential consumer response is the impact of concerns on demand—in this case, the extent to which the presence of residues affects the unit price that consumers are willing to pay for any given quantity purchased. If the value of avoiding residues is large, consumers should be willing to pay a substantial premium for produce that is free of residues. A number of studies conducted in 1988–1990 attempted to estimate the consumers ' willingness to pay for produce certified to be free of pesticide (Gallup 1989, Ott 1990, Misra et al. 1991, Weaver et al. 1992). In those studies, respondents who reported being willing to pay much more for such produce were asked to choose which percentage markup represented the most extra that they would be willing to pay. This approach does not replicate an actual choice situation; that is, respondents knew their answer would have no direct financial consequences, such as actually paying more. Survey formats of this kind tend to generate excessively high reports of willingness to pay. Even so, few consumers reported being willing to pay more than 5% extra more for certified residue-free produce. Even fewer reported being willing to buy certified residue-free produce that had lower cosmetic quality or more surface defects. Misra et al. (1991) found that 56% of their respondents felt that fresh produce should be tested and certified as free of pesticide residue. When respondents were asked whether they were willing to pay extra for residue-free foods, 46% said “yes” and 26% said “no”. Of those who said “yes”, only 14% were willing to pay more than 10% extra, and only 1% were willing to pay more than 20% extra. In another study, which surveyed people visiting food stores that sold both organic and conventional produce, Jolly (1991) found that people who had purchased organic produce at least once in 3 months were willing to pay, on the average, an extra 37%, 40%, 61%, and 68%, respectively, for organic apples, broccoli, peaches, and carrots. The typical premiums on organic produce are higher than those percentages and in part explain the small market for such produce. Only 3.1% of consumers in the Jolly study who had purchased organic produce in the preceding 3 months were willing to buy organic apples when the premium was 147%.
Van Ravenswaay and Hoehn (1991b) used market data from the New York City area in assessing how much consumers would have been willing to pay to expedite removal of Alar from agricultural use. They estimated that New Yorkers would have been willing to pay an extra 30% for apples to avoid perceived risks associated with Alar in 1989. In nationwide household surveys by the same authors (van Ravenswaay and Hoehn 1991b, c), the general public was willing to pay 23.6 cents per
pound extra for apples with no detectable pesticide residues and 37.5 cents per pound extra for apples with absolutely no pesticide residue; (the normal cost of apples was 79 cents per pound. Of special interest was the fact that respondents who considered pesticide residues to pose “high risk” were willing to pay only 1 cent more per pound than the average respondent. Results of a separate study by Yarborough and Yarborough (1985, cited in Goldman and Clancy 1991) also found that the relationship between a person's “pesticide concern” and altered purchasing patterns was weak.
Decreased pesticide use might be accompanied by increased cosmetic damage to produce. Brunn (1990) examined consumer response to such cosmetic damage by showing photographs of oranges to shoppers in the Los Angeles and San Francisco areas. Shoppers were shown photographs of oranges with 0%, 10%, and 20% damage by thrips. The shoppers indicated that they would be willing to buy the oranges with the 10% and 20% scarring if the prices were 88% and 78% of the price of unblemished oranges. When shoppers were told that the blemished oranges were grown with 50% less pesticide, most of them said that they preferred the blemished over the nonblemished oranges; 63% preferred 10% scarred oranges and 58% preferred 20% scarred over the nonblemished oranges.
Baker and Crosbie (1993) criticized the contingent-valuation method used in many of those studies because it assesses only one variable and includes all consumers in each estimate. They used a technique called conjoint analysis on a small sample of shoppers at two San Jose, California supermarkets in 1992 to establish consumer groups that differ in behavior. In their analysis, they were able to examine the tradeoff between decreased pesticide use and increased pest damage. Their results indicated, for example, that, if a program banning carcinogens raised the price of produce by 20 cents per pound, the publicly acceptable increase in pest damage due to the ban could not exceed 14%. Cluster analysis indicated that the shoppers could be divided into three groups. About 30% cared about price and quality, but not pesticide residue. A majority, 55%, cared about price and quality and whether the produce met government standards for residue. The remainder, about 15%, wanted stricter government regulation of pesticide use on the farm.
Most of the data on health effects of pesticides are focused on carcinogenicity. Surveys of public opinion indicate that consumers are concerned about pesticide residue because of fear of cancer, but the public attitude toward pesticide residue is shaped by a much broader array of factors. Other health factors such as allergies and nervous system disorders, are of concern (van Ravenswaay 1995); but a number of studies indicated that consumers who were concerned with pesticide residue associated it with environmental problems (Hammitt 1986, Higley and Wintersteen 1992).
It is important that scientists, policy makers, and companies gain a
realistic understanding of public attitudes toward pesticides and of the public actions that are likely to result from these attitudes. Van Ravenswaay (1995) and others (such as Baker and Crosbie 1993, Jussaume and Judson 1992) have been critical of the state of research in public perception of pesticides. Van Ravenswaay (1995) concludes that there is an immediate need for more basic research that includes development of valid and reliable theories and methods for quantitatively assessing public concerns. There is also a need for basic research that will improve communication channels between scientists, policymakers, and the public.
One possible reason for the apparent low willingness to pay for residue-free produce is that high levels of concern about residue did not necessarily indicate belief in immediate individual danger. For example, one study found that while 72% of respondents believed pesticides in food to be a major health risk but only 47% believed that pesticides made the US food supply unsafe (Dunlap and Beus 1992).
Some have argued that the growth of organic-food sales is an indication of the public's willingness to pay to avoid both residue on foods and environmental problems associated with the use of pesticides in food production. According to data published by the Natural Foods Merchandiser (1997), organic-food sales have seen an annual growth rate of approximately 21% between 1980 and 1996. Organic-food sales have risen far faster than total food sales, which were only a little over twice as large in nominal terms in 1996 as in 1980. Prices of organic produce average 25-35% higher than prices of comparable conventional produce (Hammitt 1986, Morgan and Barbour 1991); purchasers of organic foods seem willing to pay a substantial premium for them. However, concerns about pesticides constitute only part of the motivation for buying organic foods. Most purchasers of organic foods believe that they are more nutritious and flavorful than conventionally grown foods (Hammit 1986, Jolly et al. 1989), and certification as residue-free is not the sole criterion of demand for organic produce.
The Hartman Report (Hartman Group 1996), phases I and II, summarizes an extensive survey of 1,800 consumers to assess attitudes toward food and the environment. Some key points follow.
-
Concern for the environment is vague and diffuse. About 71% of survey respondents indicate interest in purchasing earth-sustainable grocery products; this percentage drops to 46% if there is a premium on the price of products.
-
Concerns about water pollution are greater than concerns about chemical residues in food; 40–50% of those surveyed were knowledgeable about groundwater issues.
-
About 68 % of those surveyed indicate a preference for the substi-
-
tution of naturally occurring substances or organic methods for synthetic pesticides.
-
Consumers are more likely to buy food products with many environmental benefits than with just a single environmental benefit.
-
Environmental claims certified by a third party, such as a government agency, are stronger than claims of a grocer or manufacturer.
-
Consumers would not prefer to purchase products labeled “IPM” (integrated pest management) unless the label indicated that the product was produced with less pesticide; about 50% of consumers surveyed would be motivated to buy food produced with IPM methods (reduced chemical pesticides); this fraction increases to more than 60% if IPM is used with pesticide reduction in combination with such other practices as soil and water conservation.
At an increasing rate, consumers in Europe, Asia, and United States, are objecting to genetically modified foods. Consumers are demanding the right to know if their food purchases originate in genetically modified organisms (GMOs). In Europe, where the attacks on GMOs are the most extreme (Gaskell et al. 1999), experimental field plots containing genetically modified crops have been destroyed by anti-GMO activists. Major food retailers (such as Tesco, Marks and Spencer, and Salisbury) are responding and have chosen not to sell GMO foods. Major grain processors in the United States (such as ADM and Cargill), fearing refusal of their GMO grain at European ports, are shipping only non-GMO grain. However, a recent study (CGIAR, 2000) does suggest that, despite current levels of concerns, biotechnology is expected to play a major role in enhancing food security in developing nations. Furthermore, recommendations to strengthen regulations surrounding GMO products (NRC, 2000) will probably assuage public concerns about the safety of these products. Policy-makers and nongovernment groups expect the GMO issue to continue to be a key issue in global trade negotiations (Helmuth, 2000).
To the extent that concern about pesticide residue does influence organic food-purchases, it is limited to a small segment of the population. Despite its rapid growth, organic-food demand makes up a miniscule share of total food demand. In 1996, for example, organic food sales were $3.5 billion, only 0.46% of total food expenditures of $756.1 billion (Natural Foods Merchandiser 1997, Council of Economic Advisers 1998). That share is consistent with the finding that relatively few consumers are willing to pay a large premium for residue-free produce.
Although there has been some moderation in attitudes, public perceptions of pesticides today are overwhelmingly negative relative to attitudes toward many other classes of chemicals. According to Petty (1995), attitudes toward pesticides are “more negative than attitudes toward
other potentially ‘unsafe' substances” for several reasons. Unlike other potentially dangerous components of the diet, such as saturated fats and excess salt, pesticide residues offered no tangible positive consequences for consumers. That pesticide use might play a role in producing blemish-free fruits and vegetables is not readily apparent to a population that is increasingly removed from agriculture. Whereas in 1900, 80% of the US public was involved in food production, the percentage has shrunk to less than 2% in 1990. Moreover, the amelioration of pesticides as a risk factor is perceived as a responsibility beyond that of the individual; responsibility for correction lies with producers rather than consumers (in contrast with other forms of risky substances in the diet).
In urban settings, pesticides remain a source of concern. A telephone survey conducted in Kentucky in 1994 (Potter and Bessin, 1998) revealed that, although a substantial majority of respondents (over 90%) were concerned about the presence of insects in their homes the same respondents were collectively (77%) either very or somewhat concerned about pesticide use in their homes. Those respondents also were very to somewhat concerned about pesticide use in workplaces (about 73%) and in their children's schools (about 87%). Those concerns were expressed by respondents independently of their socioeconomic level. As to the nature of the concerns, close to two-thirds of respondents who had opinions expressed the belief that pesticides can cause cancer. A similar majority expressed a preference for biologically based alternatives to chemicals if such were available, on the basis of a belief that these products are “safer”; and 82.8% indicated willingness to pay more for pest-control operators who use less pesticide. Surprisingly, 98.6% of respondents could not define the meaning of “IPM”, the pest-management philosophy that has prevailed in the field for close to 4 decades. Over 96% could not define the philosophy even after the abbreviation was identified. Such overwhelming majorities indicate that efforts on the part of the EPA, USDA, and FDA to educate consumers and promote acceptance of IPM approaches have not been particularly effective (Potter and Bessin, 1998).
Another factor influencing public attitudes toward pesticides is perceptions of the reliability of information providers. In general, information derived from sources that stand to benefit from dissemination of that information is perceived as less trustworthy than information derived from sources that enjoy no apparent benefit from dissemination. Thus, information from proponents of pesticide use—chemical companies and food growers and distributors—is perceived as less trustworthy. Another potential factor in public perception is the accessibility of the information provided from different sources and the accessibility of that information to a general public with little science education (Augustine 1998).
REFERENCES
Agrios, G.N. 1988. Plant Pathology. San Diego: Academic Press.
Alavanja, M.C.R., D.P. Sandler, S.B. McMaster, S.H. Zahm, C.J. McDonnell, C.F. Lynch, M. Pennybacker, N. Rothman, M. Dosemeci, A.E. Bond, and A. Blair. 1996. The agricultural health study. Env. Health Pers. 104:362–69.
Altieri, M.A., C.A. Francis, A. Schoonhoven, and J. Doll. 1978. Insect prevalence in bean (Phaseolus vulgaris) and maize (Zea mays) polycultural systems. Field Crops Research 1:33–49.
Archibald, S.O., and C.K. Winter. 1990. Pesticides in our food: Assessing the risks. Pp. 1-50 in Chemicals in the Human Food Chain, C. K. Winter, J. N. Seiber and C .F. Nuckton, eds. New York: Van Nostrand.
Arnold S. F., D. M. Klotz, B. M. Collins, P. M. Vonier, L. J. Guillette, Jr. and J. A. McLachan. 1996. Synergistic activities of estrogen receptor with combinations of environmental chemicals. Science 272:1489–1491.
Aspelin, A. L., and A. H. Grube. 1999. Pesticide Industry Sales and Usage. 733-R-99-001. Washington, DC: US Environmental Protection Agency, Office of Pesticide Programs.
Augustine, N. 1998. What we don't know does hurt us: How scientific illiteracy hobbles society. Science 279:1640-1641.
Babcock, B. A., E. Lichtenberg, and D. Zilberman. 1992. Impact of damage on the quality and quantity of output. Am. J. of Ag. Ec. 74:163–172.
Baginsky, E. 1967. P. 35 in Occupational Disease in California Attributed to Pesticides and Other Agricultural Chemicals. Berkeley: State Department of Public Health.
Baker, G. A., and P. J. Crosbie. 1993. Measuring food safety preferences: identifying consumer segments. J. of Ag. and Res. Ec. 18:277–287.
Baker, L. S., D. L. Fitzell, J. N. Seiber, T. R. Parker, T. Shibamoto, M.W. Poore, K. E. Longley, R. P. Tomlin, R. Propper and W. Duncan. 1996. Ambient air concentrations of pesticides in California. Env. Sci. Tech. 30:1365–1368.
Bakir, R., S. F. Damluji, L. Amin-Zaki, M. Murtadha, A. Khalidi, N. Y. Al-Rawi, S. Tikriti, H. I. Dhahir, T. W. Clarkson, J. C. Smith, and R. A. Doherty. 1973. Methylmercury poisoning in Iraq. Science 181:230–241.
Ball, V. E. 1985. Output, input and productivity measurement in US agriculture. Am. J. of Ag. Ec. 67:476–486.
Ball, V. E. 1988. Modeling Supply Response in a Multiproduct Framework. Am. J. of Ag. Ec. 70:813–825.
Ball, V. E., J.C. Bureau, R. Nehring, and A. Somwaru. 1997. Agricultural productivity revisited. Am. J.of Ag. Ec. 79:1045–1063.
Barbash, J. E., and E. A. Resek. 1996. Pesticides in Ground Water: Distribution, Trends, and Governing Factors . Chelsea, Mich: Ann Arbor Press.
Barton, J., and F. Oheme. 1981. Incidence and characteristics of animal poisonings seen at Kansas State University from 1975 to 1980. Vet. Human Toxicol. 23:101–102.
Bealer, R. C., and F. K. Willits. 1968. Worriers and non-worriers among consumers about farmers' use of pesticides. J. Cons. Affairs 2:188–204.
Beasley, R., and H. Trammel. 1989. Insecticide. Pps. 97–107 in Current Veterinary Therapy: Small Animal Practice, R. W. Kirk, ed. Philadelphia: W. B. Saunders.
Benbrook, C. M. 1996. Pest Management at the Crossroads. Yonkers, N.Y.: Consumers Union.
Bleiburg, J., M. Wallen, R. Brodkin, and I. Applebaum. 1964. Industrially acquired porphyria. Arch. Dermatol. 84:793-797.
Blondell, J. 1997. Epidemiology of pesticide poisonings in the United States, with special reference to occupational cases. Occ. Med.: State of the Art Reviews 12(2):209–220.
Blus, C. .J., and C. J. Henery. 1997. Field studies on birds: unique and unexpected relations. Ecol. App. 7:1125–1132.
Brattsten, L. B. and S. Ahmad, eds. 1986. Molecular Aspects of Insect-Plant Interactions. New York: Plenum Press.
Bridges, D. C., and R. L. Anderson. 1992. Crop Losses Due to Weeds in the United States. Champaign, Ill.: Weed Science Society of America.
Brock T. D., and M. T. Madigan. 1988. Biology of Microorganisms, 5th edition. Englewood, N.J: Prentice-Hall.
Bruhn, C., M. K. Diaz-Knauf, N. Feldman, J. Harwood, G. Ho, E. Ivans, L. Kubin, C. Lamp, M. Marshall, S. Osaki, G. Stanford, Y. Steinbring, I. Valdez, E. Williamson, and E. Wunderlich. 1992. Consumer food safety concerns and interest in pesticide-related information . J. of Food Safety. 12:253–262.
Brunn, D. 1990. Consumer acceptance of cosmetically imperfect produce. J. of Consumer Affairs. 24(2):268–279.
Brusseau, M. L. 1994. Transport of reactive contaminants in porous media. Rev. of Geophys. 32(3):285–314.
Buchmann, S. L., and G. P. Nahan. 1996. The Forgotten Pollinators. Washington, DC: Island Press.
California EPA 1994. Pesticide Usage Report, 1993. Sacramento: California Department of Pesticide Regulation,. [Online]. Available: HtmlResAnchor http://www.cdpr.ca.gov/docs/dprdocs/docsmenu.htm.
California EPA 1995. California Pesticide Illness Surveillance Program Summary Report – 1993. Sacramento: California Environmental Protection Agency, Dept. of Pesticide Regulation .
California EPA 1996. California Pesticide Illness Surveillance Program Summary Report – 1994. Sacramento: California Environmental Protection Agency, Dept. of Pesticide Regulation .
California EPA 1997. Overview of the California Pesticide Illness Surveillance Program – 1995. Sacramento: California Environmental Protection Agency, Dept. of Pesticide Regulation .
Capalbo, S. M., and J. M. Antle, eds. 1988. Agricultural Productivity: Measurement and Explanation. Washington, DC: Resources for the Future.
Carlson, G. A. 1977. Long run productivity of insecticides. Am. J. of Ag. Ec. 59:43–548.
Carlson, G. A., and C. E. Main. 1976. Economics of disease loss management. Ann. Rev. of Phyt. 17:149–161.
Carlson, G. A., and L. Suguiyama. 1985. Economic evaluation of area-wide cotton insect management: boll weevils in the Southeastern United States. Bulletin 473. Raleigh: North Carolina State University, North Carolina Agricultural Research Service.
Carlson, G. A., G. Sappie, and M. Hammig. 1989. Economic Returns to Boll Weevil Eradication. Agricultural Economic Report No. 621, Washington, DC: US Department of Agriculture, Economic Research Service.
Carrasco-Tauber, C., and L. J. Moffitt. 1992. Damage control econometrics: functional specification and pesticide productivity. Am. J. of Ag. Ec. 74:158–162.
Casey, P., and J. A. Vale. 1995. Deaths from pesticide poisoning in England and Wales 1945-1989. Human and Exptl. Tox. 13:95–101.
CGIAR (Consultative Group on International Agricultural Research) and US National Academy of Sciences. 2000. Agricultural Biotechnology and the Poor, Conference Proceedings, G. J. Persley and M. M. Lantin, eds. Washington, DC: CGIAR.
Chambers, R. G., and E. Lichtenberg. 1994. Simple econometrics of pesticide productivity. Am. J. of Ag. Ec. 76:407–418.
Chambers, R. G., and E. Lichtenberg. In press. Pesticide productivity and pest damage in the United States: an aggregate analysis. In The Economics of Pesticides and Food Safety: Essays in Memory of Carolyn Harper. C. E. Willis and D. Zilberman, eds. Boston: Kluwer Academic Publishing.
Chambers, R. G., and R. D. Pope. 1994. A virtually ideal production system: specifying and estimating the vips model. Am. J. of Ag. Ec. 76:105–113.
Chavas, J. P., and T. Cox. 1988. A nonparametric analysis of agricultural technology. Am. J. of Ag. Ec. 70:303–310.
Cheng, H. H., ed. 1990. Pesticides in the Soil Environment: Processes, Impacts, and Modeling . Soil Science Society of America Book Series, No. 2. Madison, Wis: Soil Science Society of America.
Clement, C.R. and T.. Colborn. 1992. Herbicides and fungicides: a perspective on potential human exposure . Pp. 368–384 in Chemically-induced Alterations in Sexual and Functional Development: The Wildlife/Human Connection. T. Colborn and C. Clement, eds. N.J.: Princeton Scientific Publishing Company.
Columbia Legal Services. 1998. Enforcement of Farm Worker Pesticide Protection in Washington State . Report, Nov. 1998. Seattle, Wash.: Columbia Legal Services.
Connaughton, D. F., J. R. Stedinger, L. W. Lion, and M. L. Shuler. 1993. Description of time-varying desorption kinetics: Release of naphthalene from contaminated soils. Enviro. Sci. Tech., 27(11):2397–2403.
Coulston, F., and F. Pocchiari. 1983. Accidental Exposure to Dioxins – Human Health Aspects. New York: Academic Press.
Council of Economic Advisers. 1998. Economic Report of the President. Washington, DC: Government Printing Office.
Council of Economic Advisers. 2000. Economic Report of the President. Washington, DC: Government Printing Office.
Cramer, H. H. 1967. Plant Protection and World Crop Production. Leverkusen, Germany: Bayer Pflanzenschutz.
Cramp, S. 1963. Toxic chemicals and birds of prey. Brit. Birds 56(4):124.
Croft, B. 1990. Pesticide effects on arthropod natural enemies: a database summary . Chapter 2 in Arthropod Biological Control Agents and Pesticides. New York: J. Wiley.
CTIC (Conservation Technology Information Center). 1998a. 1998 Crop Residue Management Executive Summary (1998 Conservation Tillage Report). [Online]. Available: HtmlResAnchor http://www.ctic.purdue.edu/Core4/CT/CT.html.
CTIC (Conservation Technology Information Center). 1998b. 1990–1998 Conservation Tillage Trends. [Online]. Available: http:/www.ctic.purdue.edu/Core4/CT/CTSurvey/NationalData.html
Curtis, C. G., L. M. Cook and R. J. Wood. 1978. Selection for and against insecticide resistance and possible methods of inhibiting the evolution of resistance in mosquitoes. Ecol. Ent. 3:273–287.
Davis, S., and R. Schliefer. 1998. Indifference to Safety: Florida's Investigation into Pesticide Poisoning of Farmworkers. Washington, DC: Farmworker Justice Fund, Inc.
Debach, P., and D. Rosen. 1991. Biological Control by Natural Enemies. NewYork: Cambridge University Press.
Dempster, J .P. 1969. Some effects of weed control on the numbers of the small cabbage white (Pieris rapae) on Brussels sprouts. J. Appl. Ecol. 6:339–345.
Dempster, J. P., and T.H. Coaker. 1974. Diversification of crop ecosystems as a means of controlling pests . Pp. 59–72 in Biology in Pest and Disease Control. D. Price-Jones and M. E. Solomon, eds. Oxford: Blackwell Scientific.
DuBois, K. P. 1969. Combined effects of pesticides. Can. Med. Assoc. J. 100:173–179.
Duffy, D. L., C. A. Mitchell, and N. G. Martin, 1998. Genetic and environmental risk factors for asthma. Am. J. Respir. Crit. Care Med. 157:840–845.
Dunlap, R. E., and C. E. Beus. 1992. Understanding public concerns about pesticides: an empirical examination . J. Cons. Aff. 26(2):418–438.
Dyte, C. E. 1972. Resistance to synthetic juvenile hormone in a strain of flour beetle, Tribolium castaneum. Nature. 238:48.
Ecobichon, D. J. 1991. Toxic Effects of Pesticides. Pp. 610–611 in: Casarett and Doull's Toxicology, M. O. Amdur, J. Doull and C.D. Klassen, eds. New York: Pergamon Press.
Ecobichon, D. J. 1996. Toxic Effects of Pesticides. Pp. 643-689 in: Casarett and Doull's Toxicology, 5th Edition, C. D. Klaassen, ed., New York: McGraw Hill.
Ehrlich, P. R., D. S. Dobkin and D. Wheye. 1988. The Birder's Handbook. New York: Simon and Schuster.
Elkins, E. R. 1989. Effect of commercial processing on pesticide residues in selected fruits and vegetables. J. Assoc. Off. Anal. Chem. 72(3):533–535.
EPA (US Environmental Protection Agency). 1992. Worker Protection Standard, Hazard Information, Hand Labor Tasks on Cut Flowers and Ferns Exception; Final Rule, And Proposed Rules . Federal Register 57(163):38102–38176.
EPA (US Environmental Protection Agency). 1998. Status of Pesticides in Registration, Reregistration, and Special Review (Rainbow Report). Washington, DC: EPA, Office of Pesticide Programs.
EPA (US Environmental Protection Agency). 1999. Office of Pesticide Programs 1999 Programs Biennial Report for FY 1998 and 1999. Washington, DC: US Government Printing Office.
EPA (US Environmental Protection Agency). 2000. Clinton-Gore administration acts to eliminate major uses of pesticide dursban to protect children and public health. Headquarters Press Release June 8.
ERS (Economic Research Service). 1997. Agricultural Resources and Environmental Indicators 1996-97. Agricultural Handbook No. 712. Washington, DC: US Department of Agriculture
Farnsworth, R. L., and L. J. Moffitt. 1981. Cotton production under risk: an analysis of input effects on yield variability and factor demand. W. J. Ag. Ec. 6:155–163.
Feldmann, R. J., and H. I. Maibach. 1974. Percutaneous penetration of some pesticides and herbicides in man . Toxicol. & Appl. Pharmacol. 28:126–132.
Ferrer, A., and R. Cabral. 1995. Recent epidemics of poisoning by pesticides. Tox.. Let. 82(3):55–63.
Firestone, D. 1977. The 2,3,7,8-tetrachlorodibenzo-p-dioxin problem: A review. In., Chlorinated phenoxy acids and their dioxins: Mode of action, health risks, and environmental effects, C. Ramel, ed. Ecol. Bull. (Stockholm) 17.
Flickinger, E. L., G. Juenger, T. J. Roffe, M. R. Smith, and R. J. Irwin. 1991. Poisoning of Canada geese in Texas by parathion sprayed for control of Russian wheat aphid. H. Wildl. Dis. 27:265–268.
Food Marketing Institute. 1989. 1989 Trends: Consumer Attitudes and the Supermarket. Washington, DC: Food Marketing Institute.
Foster, M. S., and W. G. Ruesink. 1984. Influence of flowering weeds associated with reduced tillage in corn on a black cutworm (Lepidoptera: Noctuidae) parasitoid, Meteorus rubens (Nees von Esenbeck). Env. Ent. 13:664–668.
FQPA (Food Quality Protection Act). 1996. US Public Law 104-170. 104th Congress, August 1996.
Fry, M. E., R. J. Risser, H. A. Stubbs and J. P. Leighton. 1986. Species selection of habitat evaluation procedures. In Wildlife 2000: Modeling Habitat Relationships of Terrestrial Vertebrates , J. Verner, M.L. Morrison and C.J. Ralph, eds. Madison: University of Wisconsin Press.
Fryer, J. D. 1982. The British Crop Production Council and Weed Research Organization: an interwoven history Great Britain. Pp. 78–83 in Report – Weed Research Organization. Brighton, England: British Crop Protection Council,
Gadon, M. 1996. Pesticide poisonings in the lawn care and tree service industries . J. Occ. and Env. Med. 38:794–799.
Gallo, M. A., R. J. Scheuplein, and K. A. van der Heijden, eds. 1991. Biological basis for risk assessment of dioxins and related compounds . Banbury Report 35. Cold Spring Harbor, N.Y.: Cold Spring Harbor Laboratory Press.
Gallup. 1989. Gallup Poll Report 286. Princeton, N.J: Gallup Poll Publishing.
Gaskell, G., M. W. Bauer, J. Durant, and N. C. Allum. 1999. Worlds apart? The reception of genetically modified foods in Europe and the US. Science 285:384–387.
Gelardi, R. C., and M. K. Mountford. 1993. Infant Formulas: evidence of the absence of pesticide residues. Reg. Tox.. Pharm. 17(2,pt.1):181–192.
Georghiou, G. P. 1972. The evolution of resistance to pesticides. Ann. Rev. Ecol. Syst. 3:133–168.
Georghiou, G. P., and C. E. Taylor, 1976. Pesticide resistance as an evolutionary phenomenon. Proc. XV Int. Cong. Ent. 1976:759–785.
Georghiou, G.P., and R. Mellon. 1983. Pesticide resistance in time and space. Pp. 1–46 in. Pest Resistance to Pesticides, G. Georghiou and T. Saito, eds. New York: Plenum Press.
Gergen, P. J., K. M. Mortimer, P. A. Eggleston, D. Rosenstreich, H. Mitchell, D. Ownby, M. Kattan, D. Baker, E. C. Wright, R. Slavin, and F. Malveaux, 1999. Results of the National Inner-City Asthma Study (NCICAS) environmental intervention to reduce allergen exposure in inner-city homes. J. Allergy Clin. Immunol. 103:501–506.
Goldman, B. J., and K .L. Clancy. 1991. A survey of organic produce purchases and related attitudes of food cooperative shoppers. Am. J. Alt. Ag. 6(2):89–92.
Gotsch, N., and U. Regev. 1996. Fungicide use under risk in swiss wheat production. Ag. Ec. 14:1–9.
Greig-Smith, P.W. 1994. Understanding the impact of pesticides on wild birds by monitoring incidents of poisoning. Pp. 301-319 in Wildlife Toxicology and Population Modeling, R.J. Kendall and T.E. Lacher, eds. Boca Raton, Fla.: CRC Press.
Griliches, Z. 1963. The sources of measured productivity growth: US agriculture, 1940-1960 . J. Pol. Ec. 71:331–364.
Hammitt, J. K. 1986. Estimating Consumer Willingness to Pay to Reduce Food-borne Risk. (R-3447-EPA). Santa Monica, Calif.: Rand Corporation.
Harper, J. L. 1957. Ecological aspects of weed control. Outlook Agric. 1:197–205.
Hartman Group. 1996. The Hartman Report: Food and the Environment: A Consumer's Perspective. Bellevue, Wash.: Hartman Group.
Hartung, R. 1975. Occupational hazards of selected pesticides. Pp. 833–842 in Occupational Medicine, C. Zenz, ed. Chicago, Ill.: Yearbook Medical Publishers.
Hartung, R. and B. D. Dinman, eds. 1972. Environmental Mercury Contamination. Ann Arbor, Mich.: Ann Arbor Science Publications.
Hayes, W. J., Jr. 1963. Clinical Handbook on Economic Poisons: Emergency Information for Treating Poisoning. Public Health Service Publication No. 476. Washington, DC: US Government Printing Office.
Headley, J. C. 1968. Estimating the productivity of agricultural pesticides. Am. J. of Ag. Ec. 50:13–23.
Heap, I. M. 1997. The occurrence of herbicide-resistant weeds worldwide. Pesticide Science. 51:235–234.
Helm, R. M., A. W. Burks, L. W. Williams, D. E. Milne and R. J. Brenner. 1993. Identification of cockroach aeroallergens from living cultures of German or American cockroaches. Int. Arch. Allergy & Appl. Immunol. 101:359–363.
Helmuth, L. 2000. Both sides claim victory in trade pact. Science 287:782–783.
HEW (US Department of Health, Education and Welfare). 1969. Report of the Secretary's Commission on Pesticides and Their Relationship to Environmental Health. Washington, DC: US Government Printing Office.
Higley, L. G., and W. K. Wintersteen. 1992. A novel approach to environmental risk assessment of pesticides as a basis for incorporating environmental costs into economic injury levels. Am. Entomol. 38:34–39.
Honaganahalli, .P.S., and J. N. Seiber. 1997. Health and environmental concerns over the use of fumigants in agriculture: the case of methyl bromide. Pp. 1–13 in: Fumigants: Environmental Fate, Exposure, and Analysis, J. N. Seiber, J.A. Knuteson, J.E. Woodrow, N.L. Wolfe, J. V. Yates, and S. R. Yates, eds. ACS Symposium Series 652. Washington, DC: American Chemical Society.
Horowitz, J. K., and E. Lichtenberg. 1993. Insurance, moral hazard, and chemical use in agriculture. Am. J. of Ag. Ec. 75(4):926–935.
Horowitz, J.,K., and E. Lichtenberg. 1994. Risk-increasing and risk-reducing effects of pesticides. J. Ag. Ec. 45(1):82–89.
Hoy, C. W., G. P. Head, and F. R. Hall. 1998. Spatial heterogeneity and insect adaptation to toxins. Ann. Rev. of Ent. 43:185–205.
Hueth, D., and U. Regev. 1974. Optimal pest management with increasing pest resistance. Am. J. of Ag. Ec. 56:456–465.
Jacobsen, B. J. 1997. Role of plant pathology in integrated pest management. Ann. Rev. Phyto. 35:373–391.
Jaenicke, E. C. 1997. The Myths and Realities of Pesticide Reduction: A Readers's Guide to Understanding the Full Economic Impacts. Greenbelt, Md.: Henry A. Wallace Institute of Alternative Agriculture.
Johnson, D. A., T. F. Cummings, P. B. Hamm, R. C. Rowe, J. S. Miller, R. E. Thornton, and E. J. Sorensen. 1997. Potato late blight in the Columbia Basin: An economic analysis of the 1995 epidemic. Plant Disease. 81:103–106.
Johnson, D. W., L. P. Kish, and G. E. Allen. 1976. Field evaluation of selected pesticides on the natural development of the entomopathogen, Nomuraea rileyi, in the velvetbean caterpillar in soybean. Env.. Ent. 5:964–966.
Johnson, M. K. 1982. The target for the initiation of delayed neurotoxicity by organophosphorus esters: biochemical studies and toxicological applications. Rev. of Biochem. Tox. 4:141–212.
Jolly, D. A. 1991. Determinants of organic horticultural products consumption based on a sample of California consumers. Acta. Hort. 295:141–148.
Jolly, D. A., H. G. Schutz, K. V. Diaz-Knauf, and J. Johal. 1989. Organic foods: consumer attitudes and use. Food Tech. 43(11):60–66.
Jordan, N. R., and J. L. Jannink. 1997. Assessing the practical importance of weed evolution: a research agenda. Weed Res. 37:237–246.
Jussaume, R. A., and D. H. Judson. 1992. Public perceptions about food safety in the United States and Japan . Rural Soc. 57(2):235–249.
Kamel, F., T. Moreno, A. S. Rowland, L. Stallone, G. Ramirez-Garcia, and D. P. Sandler. 1998. Community participation and response rates in a study of farmworkers . J. Epid. 9:5117 (4 Suppl.).
Keifer, M. C., and R. K. Mahurin. 1997. Chronic neurologic effects of pesticide overexposure. Occ. Med.: State of the Art Reviews. 12(2):291–304.
Kimbrough, R. D., H. Falk, P. Stehr, and G. Fries. 1984. Health implications of 2,3,7,8-tetrachlorodibenzodioxin (TCDD) contamination of residential soil. J. Tox..Env. Health. 14:47–93.
Klassen, W. 1995. World food supply up to 2010 and the global pesticide situation. In Eighth International Congress of Pesticide Chemistry, Options 2000, N. N .Ragsdale, P.C. Kearney, and J .R. Plimmer, eds. Washington, DC: American Chemical Society.
Knutson, R. D., C. R. Hall, E. G. Smith, S. D. Cotner, and J. W. Miller. 1993. Economic Impacts of Reduced Pesticide Use on Fruits and Vegetables . Washington, DC: American Farm Bureau Federation.
Knutson, R. D., C. R. Taylor, J. B. Penson, and E. G. Smith. 1990. Economic Impacts of Reduced Chemical Use. College Station, Tex.: Knutson and Associates.
Kolpin, D. W., J. E. Barbash, and R. J. Gilliom. 1998. Occurrence of pesticides in shallow groundwater of the United States: Initial results from the national water-quality assessment program . Env. Sci. Tech. 32:558-566.
Ku, H. S. 1987. Potential industrial applications for allelochemicals and their problems . Pp. 449–454 in Allelochemicals: A Role in Agriculture and Forestry, G. Waller, ed. Symposia Series 330. Washington, DC: American Chemical Society.
Kurtz, D. A., ed. 1990. Long Range Transport of Pesticides. Chelsea, Mich.: Lewis Publishers.
Landres, P. B., J. V. Verner, and J. W. Thomas. 1988. Ecological uses of vertebrate indicator species: a critique. Cons. Biol. 2:316–328.
Larson, S. J., P. D. Capel, and M. S. Majewski. 1997. Pesticides in Surface Waters: Distribution, Trends, and Governing Factors. Chelsea, Mich: Ann Arbor Press.
Leber, A. P. and T. J. Benya, 1994. Chlorinated Hydrocarbon Insecticides. Pp. 1503–1566 in Patty's Industrial Hygiene and Toxicology, 4th Ed., G.D. Clayton and F.E. Clayton, eds: Vol. II, Part B. New York: John Wiley & Sons.
Leung, H. W., and D. J. Paustenbach. 1989. Assessing health risks in the work place: a study of 2,3,7,8-tetrachlorodibenzo-p-dioxin . Pp. 689–710 in The Risk Assessment of Environmental and Human Health Hazards, D.J. Paustenbach, ed. New York: John Wiley & Sons.
Levine, E., and H. Oloumi-Sadeghi. 1991. Management of diabroticite rootworms in corn. Ann. Rev. Ent. 36:229–255.
Levine, R. 1991. Recognized and possible effects of pesticides in humans. Pp. 275–360 in Handbook of Pesticide Toxicology, Volume 1, W. J. Hayes, Jr. and E. R. Laws, Jr., eds. San Diego, Calif.: Academic Press.
Lichtenberg, E., and D. Zilberman. 1986. The econometrics of damage control: why specification matters. Am. J. of Ag. Ec. 68:261–273.
Lichtenberg, E., and D. Zilberman. 1997. Storage Technology and the Environment. Working Paper No. 90-05. College Park: University of Maryland, Department of Agricultural and Resource Economics ,.
Lichtenberg, E., D. D. Parker, and D. Zilberman. 1988. Marginal analysis of welfare effects of environmental policies: the case of pesticide regulation. Am. J. of Ag. Ec. 70(4):867–874.
Lin, B-H., M. Padgitt, L. Bull, H. Delvo, D. Shank, and H. Taylor. 1995. Pesticide and Fertilzer Use and Trends in US Agriculture. Agricultural Economic Report Number 717. Washington, DC: US Department of Agriculture, Economic Research Service.
Linn, D.,M., F. H. Carski, M. L. Brusseau, and F. H. Chang, eds. 1993. Sorption and Degradation of Pesticides and Organic Chemicals in Soil . Madison, Wisc.: Soil Science of America; American Society of Agronomy.
Loague, K., D.L. Corwin, and T.R. Ellsworth. 1998. The challenge of predicting nonpoint source pollution. Env. Sci. Tech. 32(5):130A–133A.
Majewski, M. S., and P. D. Capel. 1995. Pesticides in the Atmosphere: Distribution, Trends, and Governing Factors. Chelsea, Mich.: Ann Arbor Press.
Mayer, F. L. Jr., and M. R. Ellersieck. 1986. Manual of Acute Toxicity: Interpretation and Data Base for 410 Chemicals and 66 Species of Freshwater Animals. Resource Publication No. 160. Washington, DC: US Fish and Wildlife Service.
McEwen, F. L., and G. R. Stephenson. 1979. The Use and Significance of Pesticides in the Environment. New York: John Wiley & Sons.
McKenna and Cuneo, L.L.P. 1996. Summary and Analysis of the Food Quality Protection Act of 1996, Public Law 104-170, August 3, 1996. Prepared for the American Crop Protection Association.
Mehler, L. N., M. A. O'Mally, and R. I. Krieger. 1992. Acute pesticide morbidity and mortality: California. Rev. Env. Contam. Tox. 129:51–66.
Melander, A. L. 1914. Can insects become resistant to sprays? J. Econ. Ent. 7:167.
Merck & Co., Inc. 2000. Venomous bites and stings (Chapter 287, section 24) in Merck Manual of Medical Information. Whitehouse Station, N.J.: Merck & Co.
Methyl Bromide Global Coalition. 1992. The Methyl Bromide Science Workshop Proceedings, M. W. Ko, and N. D. Sze, eds. Arlington, Va.: Methyl Bromide Global Coalition.
Mileson, B. E., J. E. Chambers, W. L. Chen, W. Dettbarn, M. Ehrich, A. T. Eldefrawi, D. W.Gaylor, K. Hamernik, E. Hodgson, A. G. Karczmar, S. Padilla, C. N. Pope, R. J. Richardson, D. R. Saunders, L. P. Sheets, L. G. Sultatos, and K. B. Wallace. 1998. Common mechanism of toxicity: a case study of organophosphorus pesticides . Tox. Sci. 41:8–20.
Misra, S. K., C. L. Hung, and S. L. Ott. 1991. Consumer willingness to pay for pesticide-free fresh produce. W. J. of Ag. Ec. 16:218–227.
Moody, R. P., C. A. Franklin, and L. Ritter. 1990. Dermal absorption of the phenoxy herbicides 2,4-D, 2,4-D amine, 2,4-D isooctyl, and 2,4,5-T in rabbits, rats, rhesus monkeys, and humans: a cross-species comparison. J. Tox. and Env. Hlth. 29:237–245.
Morgan, J., and B. Barbour. 1991. Marketing organic produce in New Jersey: obstacles and opportunities . Agribusiness 7:143–163.
NAPIAP (National Agricultural Pesticide Impact Assessment Program) . 1997. Pesticides and the Bottom Line, D. R. Pike, F. Whitford, and S. Kamble, eds. Crop Science Special Report 1997-10. Urbana-Champaign: University of Illinois.
NASS. 1999. 1998 Childhood Agricultural Injuries. NASS Document SP CR8 (10-99) Washington DC. US Department of Agriculture.
National Opinion Research Center. 1994. General Social Surveys, 1972-1994: Cumulative Codebook. Chicago, Ill: National Opinion Research Center.
Natural Foods Merchandiser. 1997. Market Overview '96. June.
Noling, J. W. 1997. Role of soil fumigants in Florida agriculture. Pp. 14–24 in Fumigants: Environmental. Fate, Exposure, and Analysis, J. N. Seiber, J. A. Knuteson, J. E. Woodrow, N. L. Wolfe, M. V. Yates, and S. R. Yates, eds. ACS Symposium Series 652. Washington, D.C: American Chemical Society.
Norgaard, R.B. 1976. The economics of improving pesticide use. Ann. Rev. of Ent. 21:45–60.
NRC (National Research Council). 1986. Pp. 100–110 in Pesticide Resistance: Strategies and Tactics for Management. Washington, DC: National Academy Press
NRC (National Research Council). 1987. Regulating Pesticides in Food: The Delaney Paradox. Washington, DC: National Academy Press.
NRC (National Research Council). 1993. Pesticides in the Diets of Infants and Children. Washington, DC: National Academy Press.
NRC (National Research Council). 1994. Groundwater Vulnerability Assessment. Washington, DC: National Academy Press.
NRC (National Research Council). 2000. Genetically Modified Pest-Protected Plants: Science and Regulation . Washington, DC: National Academy Press
Oerke, E. C., H. W. Dehne, F. Schonbeck, and A. Weber. 1994. Crop Production and Crop Protection: Estimated Losses in Major Food and Cash Crops. Amsterdam: Elsevier.
Onstad, D. W., M. G. Joselyn, S. A. Isard, E. Levine, J. L. Spencer, L. W. Bledsoe, C. R. Edwards, C. D. DiFonzo, and H. Wilson. 1999. Modeling the spread of western corn rootworm (Coleoptera: Chrysomelidae) populations adapting to soybean-corn rotation. Env. Ent.. 28(2):188–194
Osteen, C. D., and P. I. Szmedra. 1989. Agricultural Pesticide Use Trends and Policy Issues. Agricultural Economic Report No. 622. Washington, DC: US Department of Agriculture, Economic Research Service,
OTA (US Congress, Office of Technology Assessment). 1988. Pesticides Residues in Food: Technologies for Detection (OTA-F-398) . Washington, D.C: US Government Printing Office.
Ott, S. L. 1990. Supermarket shoppers' pesticide concerns and willingness to purchase certified pesticide residue-free produce. Agribusiness 6:593–602.
Padgitt, M., D. Newton, and C. L. Sandretto. 2000. Production Practices in US Agriculture, 1990-97, Statistical Bulletin . US Department of Agriculture, Economic Research Service. Washington, DC: US Government Printing Office. (in press).
Pannell, D. J. 1991. Pests and pesticides, risk and risk aversion. Ag. Ec. 5(4):361–383.
Parker, D. D., and D. Zilberman. 1993. Hedonic estimation of quality factors affecting the farm-retail margin . Am. J. of Ag. Ec. 75:458–466.
Pepper, I., C. Gerba, M. L. Brusseau, eds. 1997. Pollution Science. San Diego, Calif.: Academic Press.
Perrin, R. M. 1977. Pest management in multiple cropping systems. Agro-ecosystems. (Amsterdam). 3(2):93–118.
Peterle, T. J. 1991. Wildlife Toxicology. New York: Van Nostrand Reinhold.
Peterson, R.K.D. and B. A. Shurdut 1999. Human health risks from cockroaches and cockroach management; a risk analysis approach. Amer. Ent. 45:142–148.
Petty, R. E. 1995. Understanding public attitudes toward pesticides. Pp. 21-24 in The Public and Pesticides: Exploring The Interface, C. R. Curtis, ed. Washington, DC: US Dept. of Agriculture, National Agricultural Pest Impact Assessment Program
Pfadt, R.E. 1978. Fundamentals of Applied Entomology. New York: MacMillan Publishers Co.
Pignatello, J .J., C. R. Frink, P. A. Marin, and E. X. Droste. 1990. Field-observed ethylene dibromide in an aquifer after two decades . J. Contam. Hydrol., 5:195–210.
Pimentel, D., H. Acquay, M. Biltonen, P. Rice, M. Silva, J. Nelson, V. Lipner, S. Giordano, A. Horowitz, and M. D'Amore. 1992. Environmental and economic costs of pesticide use. Bioscience. 42(10):750–760.
Pimentel, D., J. Krummel, D. Gallahan, J. Hough, A. Merrill, I. Schreiner, P. Vittum, F. Koziol, E. Back, D. Yen, and S. Fiance. 1978. Benefits and costs of pesticide use in US food production. BioScience. 28 (772):778–784.
Pimentel, D., L. McLaughlin, A. Zepp, B. Lakitan, T. Kraus, P. Kleinman, F. Vancini, W. J. Roach, E. Graap, W.S. Keeton, and G. Selig. 1991. Environmental and economic impacts of reducing US agricultural pesticide use. In CRC Handbook of Pest Management in Agriculture, Volume I, 2nd Edition, David Pimentel, ed. Boca Raton, Fla.: CRC Press.
Pocchiari, F., A. Di Domenico, V. Silano, and G. Zapponi. 1979. Human health effects from accidental releases of tetrachlorodibenzo-p-dioxin (TCDD) at Seveso, Italy. Ann. N. Y. Acad. Sci. 320:311.
Porter Novelli. 1990. Pesticide Perceptions. Washington, DC: American Farm Bureau Federation.
Potter, M. F. and R. T. Bessin 1998. Pest control, pesticides, and the public: attitudes and implications . Am. Ent. 44:142–147.
Potts, G. R. 1986. The Partridge: Pesticides, Predation and Conservation. London: Collins Professional and Technical.
Powell, W. 1986. Enhancing parasitoid activity in crops. Pp. 319–340 in Insect Parasitoids: 13th Symposium of the Royal Entomological Society of London, J. Waage and D. Greathead, eds. London: Academic Press.
Rabb, R. L., R. E. Stinner, and R. van den Bosch. 1976. Conservation and augmentation of natural enemies. Pp. 233-54. In. Theory and Practice of Biological Control, C.B. Huffaker and P.S. Messenger, eds. New York: Academic Press.
Radosevich, S., J. Holt, and C. Ghersa. 1997. Weed Ecology, 2nd Edition. New York: John Wiley & Sons.
Rasmussen, P. E., K. W. T. Goulding, J. R. Brown, P. R. Grace, H. H. Janzen, and M. Korschens. 1998. Long-term agroecosystem experiments: assessing agricultural sustainability and global change. Science; 282:892–896.
Regev, U., H. Shalit, and A. P. Gutierrez. 1983. On the optimal allocation of pesticides with increasing resistance: The case of alfalfa weevil. J. of Env. Ec. and Mgmt. 10:86–100.
Regev, U., N. Gotsch, and P. Rieder. 1997. Are fungicides, nitrogen, and plant growth regulators risk reducing? J. of Ag. Ec. 48:167–178.
Risch, S .J., D. Andow, and M. A. Altieri. 1983. Agroecosystem diversity and pest control: data, tentative conclusions and new directions. Env. Ent. 12:625–629.
Robbins, C.S., D. Bystrak, and P.H. Geisler. 1986. The Breeding Bird Survey: Its First Fifteen Years 1965–1979. Resource Publication 157. Washington, DC: US Department of the Interior Fish and Wildlife Service.
Robinson, W. S., R. Nowogrodzki, and R. A. Morse. 1989. The value of honey bees as pollinators of US crops. Am. Bee Journal 129(7):477–487.
Roby, D. M., and W. W. Melichar. 1996. 1,3-Dichloropropene regulatory issues. Pp. 25–31 in Fumigants: Environmental Fate, Exposure, and Analysis, J. N. Seiber, J. A. Knuteson, J E. Woodrow, N. L. Wolfe, J. V. Yates, and S. R. Yates, eds. ACS Symposium Series 652. Washington, D.C: American Chemical Society.
Rosenheim, J. A., and B. E. Tabashnik. 1990. Evolution of pesticide resistance: interactions between generation time and genetic, ecological, and operational factors. J. Econ. Ent. 83:1184–1193.
Ryszkowski, L., J. Karg, G. Margalit, M. G. Paoletti, and R. Zlotin. 1993. Above ground insect biomass in agricultural landscapes of Europe. In Landscape Ecology and Agroecosystems, R. G. H Bunce, L. Ryszkowski and M.G. Paoletti, eds. Ann Arbor, Mich.: Lewis Publications.
Sachs, C., D. Blair, and C. Richter. 1987. Consumer pesticide concerns: A 1965 and 1984 comparison. J. Cons. Aff. 21:96–107.
Saha, A., C. R. Shumway, and A. Havenner. 1997. The economics and econometrics of damage control. Am. J. Ag. Ec. 79:773–785.
Sanderson, W. T., V. Ringenburg, and R. Biagini. 1995. Exposure of commercial pesticide applicators to the herbicide alachlor . Am. Ind. Hyg. Assoc. J. 56(9):890–897.
Sawhney, B. L., and K. Brown, eds. 1989. Reactions and Movement of Organic Chemicals in Soils. Special Pub. No. 22. Madison, Wisc. Soil Science Society of America.
Scribner, S. L., T. R. Benzing, S. Sun, and S. A. Boyd. 1992. Desorption and bioavailability of aged simazine residues in soil from a continuous corn field. J. Env. Qual. 21:1115–1121.
Seiber, J. N., and J. E. Woodrow. 1995. Origin and fate of pesticides in air. Pp.157-172 in Eighth International Congress of Pesticide Chemistry: Options 2000 , N.N. Ragsdale, P.C. Kearney and J.R. Plimmer, eds. Washington, DC: American Chemical Society
Seiber, J. N., and J. E. Woodrow. 1998. Air transport of pesticides. Rev. Tox. 2(14):287–294.
Senanayake, N. and H. Peiris. 1995. Mortality due to poisoning in a developing country: trends over 20 years. Hum. Exp. Toxicol. 14(10):808–811.
Smith, J. A., C. T. Chiou, J. A. Kammer, and D. E. Kile. 1990. Effect of soil moisture on the sorption of trichloroethene vapor to vadose-zone soil at Picatinny arsenal, New Jersey. Env. Sci. Tech. 24:676–682.
Sparks, T. C. and B. D. Hammock. 1983. Insect growth regulators: resistance and the future. Pp. 615–668 in Pest Resistance to Pesticides: Challenges and Prospects, G. P. Georghiou, T. Saito, eds. New York: Plenum Press.
Staiff, D. C., S. W. Comer, J. F. Armstrong, and H. R. Wolfe. 1975. Exposure to the herbicide, paraquat. Bull. Env. Contam. Tox. 14:334-340.
Steinberg, S. M., J. J. Pignatello, and B. L. Sawhney. 1987. Persistence of 1,2-dibromoethane in soils: Entrapment in intraparticle micropores. Env. Sci. Tech. 21:1201–1210.
Stone, W. B., and P. B. Gradoni. 1985. Wildlife mortality related to the use of the pesticide diazinon. Northeast. Env. Sci. 4:30–38.
Thomas, J. A., 1996. Toxic responses of the reproductive system.. Pp.547–582 in: Casarett & Doull's Toxicology, 5th ed.., C. D. Klaassen, ed. New York: McGraw-Hill..
Ulrich, A., W. H. Furtan, and A. Schmitz. 1987. The cost of a licensing system regulation: an example from Ccanadian prairie agriculture. J. of Pol. Ec. 95:160–178.
USDA (US Department of Agriculture). 1996. Agricultural Statistics 1995-96. Washington, DC: US Government Printing Office.
van den Bosch, R., and V. Stern. 1962. The integration of chemical and biological control of arthropod pests . Ann. Rev. Ent. 7.
van den Bosch, R., M. Brown, C. McGowan, A. Miller, M. Moran, D. Pelzer, and J. Swartz. 1975. Investigation of the Effects of Food Standards on Pesticide Use, Report to the US Environmental Protection Agency. Washington, DC:
Van Emden, H. F. 1965. The role of uncultivated land on the distribution of the cabbage aphid (Brevicoryne brassicae) on adjacent crop. J. Appl. Ecol. 2:171–196.
Van Emden, H. F. 1990. Plant diversity and natural enemy efficiency in agroecosystems. Pp. 63-77 in Critical Issues in Biological Control, M. Mackauer and L. E. Ehler, eds. Andover: Intercept LTD.
van Ravenswaay, E. O. 1995. Public Perceptions of Agrichemicals, Task Force Report No.123. Ames, Iowa: Council on Agricultural Science and Technology.
van Ravenswaay, E. O. and J. P. Hoehn. 1991a. The impact of health risks on food demand: A case study of alar and apples. In The Economics of Food Safety, J. Caswell, ed. New York: Elsevier Science Publishing Co.
van Ravenswaay, E. O., and J. P. Hoehn. 1991b. Willingness to pay for reducing pesticide residues in food: Results of a nationwide survey. Staff paper no. 91-18. East Lansing: Michigan State University, Department of Agricultural Economics.
van Ravenswaay, E. O., and J. P. Hoehn. 1991c. Contigent valuation and food safety: The case of pesticide residues in food. Staff paper no. 91-18.. East Lansing: Department of Agricultural Economics, Michigan State University.
Wania, F., and D. Mackay. 1993. Global fractionation and cold condensation of low volatility organochlorine compounds in polar regions. Ambio 22:10-18.
Ware, G. W. 1983. Pesticides: Theory and Application. San Francisco, Calif.: W. H. Freeman and Company.
Warren, G. F. 1998. Spectacular increases in crop yields in the United States in the Twentieth Century. Weed Technology. 12(4):752–760.
Weaver, R. D., D. J. Evans, and A. E. Luloff. 1992. Pesticide use in tomato production: Consumer concerns and willingness-to-pay . Agribusiness 8:131–142.
White, D. H., C. A. Mitchell, L. D. Wynn, E. L. Flickinger, and E. J. Kolbe. 1982. Organophosphate insecticide poisoning of Canada geese in the Texas Panhandle. J. Field Ornithol. 53:22–27.
Whitmore, R. W., J. E. Kelly, P. L. Reading, E. Brandt, and T. Harris. 1993. National home and garden pesticide use survey. Pp. 18-36 in Pesticides in Urban Environment: Fate and Significance, K. D. Racke and A. R. Leslie, eds. Washington, DC: American Chemical Society,
Winter, D. K. 1992. Pesticide tolerances and their relevance as safety standards. Reg. Tox. and Pharm. 15:137–150.
Yarkin, C., D. Sunding, D. Zilberman, and J. Siebert. 1994. Cancelling methyl bromide for postharvest use to trigger mixed economic results. Calif. Ag. 48:16–21.
Zabik, J. M., and J. N. Seiber. 1993. Atmospheric transport of organophosphate pesticides from California 's Central Valley to the Sierra Nevada mountains. J. Env. Qual. 22:80–90.
Zahm, S. H., and M. H. Ward. 1998. Pesticides and Childhood Cancer. Environmental Health Perspectives 106 (Supplement 3). Rockville, Md.: National Cancer Institute.
Zilberman, D., A. Schmitz, G. Casterline, E. Lichtenberg, and J.,B. Siebert. 1991. The economics of pesticide use and regulation. Science 253:518–22.


