
CHAPTER TWO
What Does TIMSS Say about Student Achievement?
TIMSS provided a wealth of information on the knowledge and skills of students in mathematics and science. In each of the three student groups studied by TIMSS, the achievement tests included questions on different topics in mathematics and science, so that particular strengths and weaknesses could be measured. In addition, for populations 1 and 2, TIMSS tested students in adjacent grades, providing a measure of gains achieved between those two grades (third and fourth grades and seventh and eighth grades in the United States).
As described in the previous chapter, the achievement test results were just one of many kinds of data produced by TIMSS. Taken together, these data provide an unprecedented amount of information about the teaching practices, educational policies, school characteristics, student attitudes, and other factors that contribute to academic strengths and weaknesses in each participating country. However,
as might be expected, the achievement scores have garnered the most public attention. Much of this attention has focused on the ''horserace'' aspects of TIMSS—how did U.S. students do compared with students in other countries? This emphasis on the bottom line of the achievement scores can obscure potentially more interesting results. For instance, in what subjects did U.S. students perform well and in which did they perform poorly, and how are these areas aligned with common U.S. mathematics and science curricula? Do U.S. students learn as much from grade to grade as students in other countries? How are student scores linked to the characteristics of the schools they attend?
The questions in the TIMSS achievement tests were based on the curricula in participating countries, and to the extent that these curricula reflected national standards in science and mathematics, the tests provide a general indication of how well students are meeting those standards. However, the TIMSS achievement tests were not aligned with the standards of any one country, such as those of the United States (Beatty, 1997, pp. 27–28; National Research Council, 1997, p. 3). The TIMSS results therefore do not provide a direct measure of whether students are achieving the standards and benchmarks specified by national organizations (National Council of Teachers of Mathematics, 1989; American Association for the Advancement of Science, 1993; National Research Council, 1996) or the standards in place at the state, national, or local levels.
Nevertheless, an important message from the achievement results is that there is considerable room for improvement in U.S. education (Table 2-1). While U.S. fourth graders scored considerably above the international average in both science and mathematics, U.S. eighth graders scored just above the average in science and below it in mathematics. U.S. high school seniors performed even less well overall in tests of general mathematical and scientific knowledge and had particularly low mean scores on the assessments of advanced mathematics and physics. On an international scale, U.S. students, particularly in the upper grades tested, are not achieving high standards.
Furthermore, many students are not achieving even at the level indicated by the average U.S. score. While the variability of U.S. scores was not markedly greater than in other countries (Stedman, 1997), variability among student scores in the United States was strongly linked to the specific classes a student took (for example, regular mathematics versus algebra in middle school or junior high) and to differences among schools (Schmidt et al., 1999, pp. 163–180). These findings suggest that many students are not being given the educational opportunities needed to achieve at high levels.
This chapter looks first at the achievement results in mathematics and then at those in science. It applies a somewhat different analysis to each discipline, partly to reveal particularly noteworthy results and partly to demonstrate different ways of using the achievement results. Much more extensive analyses of the achievement results, along with sample problems, can be found in the reports from the TIMSS International Study Center (Beaton et al., 1996a, 1996b; Harmon et al., 1997; Martin et al., 1997; Mullis et al., 1997, 1998) and in the summary reports from the U.S. Department of
Education (1996, 1997b, 1998). The publicly released test items for populations 1, 2, and 3 also can be ordered from the TIMSS International Study Center or can be downloaded from the World Wide Web at http://www.csteep.bd.edu/TIMSS1/TIMSSPublications.html#International
MATHEMATICS ACHIEVEMENT
In mathematics the population 1 assessment asked students 102 questions overall. Each student tested answered just a subset of questions, but by combining student responses it is possible to calculate "student scores" for the entire set of achievement items. Using this method, U.S. fourth graders answered 64 of the 102 questions correctly on average, which is 10 to 13 items below the average performance of students in the top four countries and in a band of performance comparable with that found in the Czech Republic, Iceland, and Canada (Table 2-2a). In the population 2 assessment, U.S. eighth graders answered a mean of 80 questions out of 151 correctly (Table 2-2b). Students in the four top-scoring countries—Singapore, Japan, Korea, and Hong Kong—answered an average of between 105 and 119 questions correctly.
The questions on the population 1 assessment were grouped into six areas:
-
whole numbers
-
data representation, analysis, and probability
-
geometry
-
patterns, relations, and functions
-
fractions and proportionality
-
measurement, estimation, and number sense
U.S. students at grade four achieved above the international mean performance in the first four of the content areas listed above. (This analysis considers just the students in the upper grades of both populations 1 and 2.) They did less well in the area of fractions and proportionality (though still near the international mean) and less well than that in the area of measurement, estimation, and number sense.
The population 2 assessment was divided into six somewhat different topic areas:
-
data representation, analysis, and probability
-
fractions and number sense
-
geometry
-
algebra
-
measurement
-
proportionality
Only in the first two areas listed above—data representation, analysis, and probability, and fractions and number sense—did U.S. eighth graders score near the international mean. They scored below the international mean in geometry, algebra, measurement, and proportionality.
In the final year of secondary school the performance of U.S. students is even farther below international standards (U.S. Department of Education, 1998, pp. 17–18). The population 3 results can be difficult to evaluate because of sampling issues and other problems mentioned in Chapter 1. For example, of the 21 countries that participated in the general
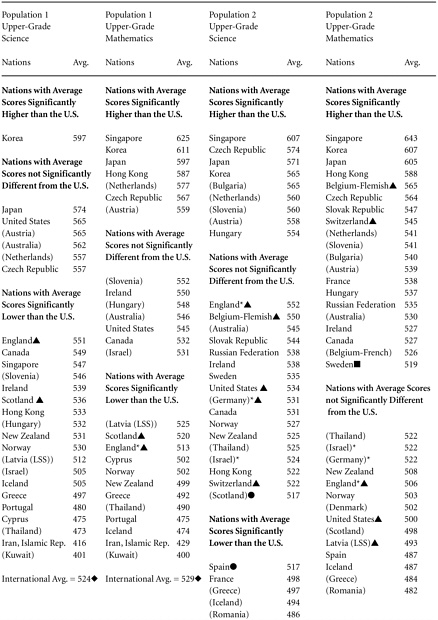


TABLE 2-2a Mean Number of Questions Answered Correctly by Upper-Grade Students in Population 1 for Countries Participating in Both the Population 1 and Population 2 TIMSS Assessments
|
Country |
Mean Number of Items Correct for Population 1 Upper-Grade Students (102 items total) |
|
Singapore |
77.52 |
|
Korea |
77.52 |
|
Japan |
75.48 |
|
Hong Kong |
74.46 |
|
Czech Republic |
67.32 |
|
United States |
64.26 |
|
Iceland |
64.26 |
|
Canada |
61.20 |
|
England |
58.14 |
|
Cyprus |
55.08 |
|
New Zealand |
54.06 |
|
Norway |
54.06 |
|
Portugal |
48.96 |
|
Iran |
38.76 |
|
Source: John Dossey, 1998, "Some Implications of the TIMSS Results for Mathematics Education," paper commissioned by the Continuing to Learn from TIMSS Committee. |
|
TABLE 2-2b Mean Number of Questions Answered Correctly by the Upper-Grade Students in Population 2 for Countries Participating in Both the Population 1 and Population 2 TIMSS Assessments
|
Country |
Mean Number of Items Correct for Population 2 Upper-Grade Students (151 items total) |
|
Singapore |
119.29 |
|
Japan |
110.23 |
|
Korea |
108.72 |
|
Hong Kong |
105.70 |
|
Czech Republic |
99.66 |
|
Canada |
89.09 |
|
New Zealand |
81.54 |
|
Norway |
81.54 |
|
United States |
80.03 |
|
England |
80.03 |
|
Iceland |
75.50 |
|
Cyprus |
72.48 |
|
Portugal |
64.93 |
|
Iran |
57.38 |
|
Source: John Dossey, 1998, "Some Implications of the TIMSS Results for Mathematics Education," paper commissioned by the Continuing to Learn from TIMSS Committee. |
|
mathematics and science literacy assessment, only 8 met the TIMSS guidelines for sample participation, and the United States was not among those 8 (Mullis et al., 1998, p. 3). Nevertheless, if potential difficulties with the data are kept in mind, the test scores still reveal much about the mathematical abilities of U.S. high school seniors. On the assessment of general knowledge in mathematics—the level of mathematics deemed necessary to function effectively in society as adults—14 countries outperformed the United States, 4 countries were not significantly different, and 2 countries were below. On the assessment of advanced mathematics—which was given to students who had taken or were taking precalculus, calculus, or Advanced Placement calculus in the United States—11 countries outperformed the United States and no countries performed worse.
The data reveal that U.S. eighth graders performed at a lower level compared with other countries than did U.S. fourth graders, and relative performance declined again between the eighth and twelfth grades. For example, student performance in the area of measurement, which was already below average at grade four, was the lowest recorded area of U.S. performance across the two populations in grade eight. In the areas of geometry and data representation, analysis, and probability, student performance started above the international mean in grade four and moved to below it in grade eight. Mathematical literacy was not broken into subareas at the population 3 level.
Despite the often-expressed concern that the basics are slighted in U.S. education, U.S. students did not falter on items calling for straightforward algorithmic work relative to their international peers. For example, U.S. fourth graders performed at or above the international mean on the following questions:
-
selecting the largest of 2735, 2537, 2573, and 2753
-
selecting the answer to 6000-2369
-
selecting what part of a figure was shaded
-
finding the solution to a word problem involving decimal subtraction
At the same time, fourth graders were below the international mean in solving a number problem for a missing addend and using a ratio to calculate a larger proportional value, which are both considered more advanced skills in the United States.
At the grade eight level, U.S. students performed at or above the international mean in:
-
selecting the answer to 6000-2369
-
writing a fraction larger than 2/7
-
writing a weight that might have rounded to a given number
-
selecting the correct ratio of red to total paint in a mixture
However, eighth graders fell below the mean in determining the portion of a purchase that belonged to one individual and in determining the number of one part of a proportion given the ratio of parts and the total.
Overall, student performance in grade eight in the areas of number and operation-based computations was at or above the international level. In other mathematical content areas, however, U.S. performance was much weaker. At the grade eight level, several of the items indicated that U.S. students have a weak ability to conceptualize measurement relationships. For example, when asked which of four students had the longest pace given a table of paces it took each student to measure a room's width, only 48 percent of U.S. students selected the student who used the fewest paces, versus the international average of 74 percent.
Geometry performance showed perhaps the greatest relative change between grades four and eight. At grade four, U.S. student performance was over one-half of a standard deviation above the international mean for the countries that participated in both the population 1 and population 2 assessments. By grade eight, it had decreased to almost one standard deviation beneath the mean for this set of countries. At grade four, U.S. performance showed that students were near or above the mean in locating objects on a grid and in dealing with visual perception and line reflections. These items were in large part items dependent on following simple directions and knowing the names of figures.
By grade eight, U.S. students had fallen behind in identifying a rotated figure, identifying necessary properties of a parallelogram, and selecting congruent triangles based on angle measurement and figure reflection properties. However, they remained at the international average in determining which of five given points fell on a line determined by two other points when the points were given as ordered
pairs. At the eighth-grade level, the differences seemed to fall along the lines of being able to use definitions and properties to reason about geometric figures and actions in the plane. At grade four the emphasis in the TIMSS assessments was on name recognition, where U.S. students did relatively well. At grade eight, the emphasis was on understanding the properties of mathematical objects and the consequences of actions on those objects, where more U.S. students faltered.
A related observation about the skills conveyed in mathematics classes came from the TIMSS videotape study (Stigler and Hiebert, 1997; Stigler et al., 1999). Researchers used the tapes of eighth-grade mathematics classes to compare the kinds of mathematical reasoning evident in the lessons. Using a reasonably generous definition of deductive reasoning, in which conclusions are drawn from axioms or premises through explicit logical steps, no examples of such reasoning were found in the U.S. lessons. In contrast, there were instances of deductive reasoning in 53 percent of Japanese lessons and 10 percent of German lessons. This feature of U.S. lessons seems to point toward an emphasis on fact and definition and a lack of emphasis on deductive reasoning.
The national standards in mathematics and many sets of state standards call for students to achieve proficiency in exploring mathematical ideas, conjecturing, using logical reasoning, and solving nonroutine problems. The relative weaknesses of U.S. students in areas of the TIMSS assessments related to these abilities indicates that many students are not yet achieving the standards' objectives.
SCIENCE ACHIEVEMENT
As in mathematics, the scores of U.S. students in science were relatively high on an international scale at the population 1 level and declined at the population 2 and 3 levels. U.S. third and fourth graders scored among the highest of students in all TIMSS countries. At the population 2 level, U.S. students ranked with those in a band of countries close to the international mean. During the final year of secondary school, a much greater number of nations scored significantly higher than did the United States. According to TIMSS, U.S. students are leaving high school with substantially less proficiency in science than are students in many other countries.
The calculated gains in student learning between adjacent grades also point to declining achievement compared to other countries. As explained in the previous chapter, TIMSS sampled from the two adjacent grades with the most 9 year olds for population 1 and with the most 13 year olds for population 2. Therefore, it is possible to look at how much students "gained" in learning between grades three and four and between grades seven and eight, even though the students tested actually were in successive grades rather than being the same set of students tested in two successive years.
For population 1 the United States ranked eleventh in achievement gain between grades three and four out of the 17 countries following all of the sampling procedures (Martin et al., 1997, p. 29). This relatively modest gain from grade to grade compared to other countries foreshadows the relative decline in the U.S. standing between populations 1 and 2. For
population 2, U.S. students ranked 26th in gain between grades seven and eight out of the 27 countries following all of the sampling procedures (Beaton et al., 1996b, p. 29).
As with the mathematics scores, the science scores were broken down into a number of subject areas and subareas. For population 1 the four main content areas were:
-
earth science
-
life science
-
environmental issues and the nature of science
-
physical science
One notable aspect of performance in these four areas involves the early appearance of weaknesses in the physical sciences among U.S. students (Schmidt et al., 1999, p. 120). Even in population 1, where only Korean students scored significantly better than U.S. students overall in science, the deficit of learning in the physical sciences among U.S. students is apparent. U.S. population 1 students did not score significantly above average in any of the four subareas within the physical sciences, whereas Korean and Japanese students scored significantly higher in all four and Dutch students in three of the four.
Another measure of the relative weakness of U.S. students in the physical sciences involves the 12 performance tasks given at both the population 1 and population 2 levels (Harmon et al., 1997). All but one of the five science tasks dealt with physical science topics, and U.S. students scored at or below the international average on all of these. For example, U.S. students did particularly poorly with a task involving batteries at the eighth-grade level, where they scored 11 percentage points below the international average and 20 percentage points (or more) behind Singapore, England, Romania, and Switzerland, the highest-scoring countries.
At the population 2 level, the performance tests were broken down into five broad categories:
-
earth science
-
life science
-
environmental issues and the nature of science
-
chemistry
-
physics
Again, eighth-grade students in the United States notably lagged in their performance in physics. Population 2 students scored near the bottom of the distribution of 22 countries in four of the six subareas within the physical sciences (Schmidt et al., 1999, pp. 125–127).
At the population 3 level, the measured level of overall U.S. science performance was very low. Even countries that explicitly track their students into different streams in upper secondary school—for example, academic, technical, vocational, and general—demonstrated higher student achievement for mathematics and science literacy in the latter three streams than the United States does for its academic students (Mullis et al., 1998, p. 83). And for the physics test, which measured the proficiency in physics of students who were completing or had completed a physics or advanced physics course, U.S. student achievement was the lowest of the 16 countries
participating. Even comparing the best U.S. students—the 1 percent of U.S. seniors taking Advanced Placement physics courses—versus all of the students taking the advanced physics test in other countries (representing 10 to 15 percent of all students in their final year of secondary school), U.S. students could do no better than low average (U.S. Department of Education, 1998, p. 52).
These results clearly demonstrate that in the United States a considerably smaller percentage of students meet high performance standards in science than do students in other countries. And even the small percentage of "elite" U.S. students do not excel compared to the larger proportion of "elites" in other countries.
One notable aspect of the U.S. science performance at all three levels is the relative lack of gender differences. Even at the population 3 level, which is the only level with a statistically significant difference between genders, this difference is the lowest (along with that of Cyprus) among the 21 participating countries (Mullis et al., 1998, p. 52). Historically in the United States, gender differences favoring males in science achievement have been considerably greater than is the case for the TIMSS results. Perhaps the results reflect the considerable attention given to involving and supporting female students in the sciences. Indeed, TIMSS data for the United States show equal numbers of male and female students taking science in the twelfth grade, although the specific courses taken are not indicated (Mullis et al., 1998, p. 90).
CONCLUSION
The 1998 draft revision of the mathematics standards issued by the National Council of Teachers of Mathematics reaffirms the NCTM's commitment "to providing the highest-quality mathematics instructional program for all students." Similarly, the National Science Education Standards issued by the National Research Council (1996) describe standards as "criteria to judge progress toward a national vision of learning and teaching science in a system that promotes excellence."
By these measures the results of TIMSS suggest that U.S. students are falling short. Although U.S. fourth graders compare favorably to their international peers, U.S. eighth graders and high school seniors achieve at a lower level than do students in many other countries.
The next three chapters of this report examine factors related to student learning in mathematics and science. Chapter 3 looks at selected qualities of science and mathematics curricula. Chapter 4 discusses instructional practices, including examples of representative classrooms in different countries. Chapter 5 considers the support systems available to teachers and students in seeking to achieve high standards.


