
Protein and Amino Acids, 1999
Pp. 255-277. Washington, D.C.
National Academy Press
12
Skeletal Muscle Markers
Dympna Gallagher, Steven B. Heymsfield,1and Zi-Mian Wang
INTRODUCTION
Skeletal muscle is the largest non-adipose tissue body component and serves both voluntary and involuntary life-sustaining functions. Skeletal muscle composition can be considered in terms of atomic, molecular, cellular, and tissue-system level components (Wang et al., 1992). The traditional concept of skeletal muscle is the non-adipose tissue component shown in Figure 12-1. However, with aging and obesity increased amounts of adipose tissue become interspersed between muscle bundles, and this composite structure is referred to as anatomic skeletal muscle (Wang et al., 1992; Heymsfield et al., 1995). Some methods of measuring skeletal muscle mass rely on quantification of one or more of the components shown in the figure.
Skeletal muscle is almost one-fifth of body weight in the newborn; this proportion doubles in the mature male (Bortz, 1982; Hochachka, 1994; Lexell et al., 1988; Snyder et al., 1975; Tomlinson et al., 1969) (Table 12-1). Both cross
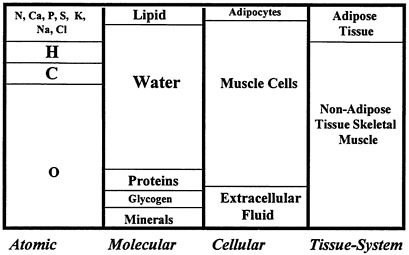
FIGURE 12-1 Anatomic skeletal muscle components at the first four body composition levels. The fifth level, whole body, is not shown.
TABLE 12-1 Proportional Contribution of Skeletal Muscle to the Body Weight of a Man at Different Stages of Development
|
Developmental Stage |
Skeletal Muscle (% of Body Weight) |
|
Birth |
21 |
|
Weaning |
18 |
|
Adolescent |
36 |
|
Adult |
45 |
|
Elderly |
27 |
|
SOURCE: Adapted from Heymsfield et al., 1995. |
|
TABLE 12-2 Distribution of Total Body Protein in the 70 kg Reference Man
|
Organ or Tissue |
Protein Mass (kg) |
% of Total Body Protein |
|
Skeletal muscle |
4.8 |
45.3 |
|
Brain |
0.11 |
0.10 |
|
Liver |
0.32 |
3.0 |
|
Kidney |
0.053 |
0.50 |
|
Heart |
0.008 |
0.50 |
|
Blood |
0.99 |
9.3 |
|
Skin |
0.75 |
7.1 |
|
Skeleton |
1.9 |
7.9 |
|
Total body |
10.5 |
100 |
|
SOURCE: Adapted from Snyder et al., 1975. |
||
sectional and longitudinal studies demonstrate a gradual decline in skeletal muscle mass with advancing age, and "sarcopenia" (as this decline is called) is an important problem in elderly populations (Bortz, 1982; Lexell et al., 1988; Tomlinson et al., 1969). On average, skeletal muscle contains the largest protein pool in the body (˜45%) as shown for the Reference Man in Table 12-2 (Snyder et al., 1975). With the exception of adipose tissue, which is found in variable proportions in adults, skeletal muscle is the largest at the tissue-system level body composition component. Skeletal muscle thus plays a central metabolic and functional role, particularly in relation to military activities and physical performance.
Method Organization
At present, most in vivo methods of skeletal muscle assessment are static in that they are designed to quantify skeletal muscle at a single point in time, and dynamic method development is limited (Figure 12-2). Skeletal muscle measurement methods that are applied in vivo are indirect and rely on measurable properties and known components, some of which are outlined in Table 12-3 (Wang et al., 1995). Broadly viewed, these properties are used with two types of models for deriving skeletal muscle mass estimates.
The first model is a descriptive or type I model that shares in common the following characteristics: a reference method is used to estimate skeletal muscle mass in a well-defined subject group in whom the property is also measured; and a statistically derived component prediction equation is developed and then cross-validated in a new subject group (Wang et al., 1995). All methods in this category are formulated conceptually around the following formula:
(1) skeletal muscle mass = Σ[a ×(measurable quantities)] + b,
where a and b are the slope and intercept of the prediction formula based on linear regression analysis. The main methods in this category are outlined in Table 12-3. All descriptive methods are population specific and must be cross-validated in new subject groups before they can be applied with confidence.
The second modeling approach is formulated on stable-component relationships, many of which can be understood in terms of underlying mechanisms. These are referred to as mechanistic or type II models (Wang et al., 1995). The methods in this category are formulated conceptually around the following formula:
(2) skeletal muscle = Σ [a ×(measurable quantities)],
where a is the stable proportion or other assumed constant biological characteristic. The main methods in this category are outlined in Table 12-3.

FIGURE 12-2 Organization of body composition methods. Source: Adapted from Wang et al., 1995.
TABLE 12-3 Characteristics of Skeletal Muscle Mass Measurement Methods
TABLE 12-4 Methods of Measuring Skeletal Muscle Mass In vivo
Methods of measuring skeletal muscle can also be organized according to body composition level as shown in Table 12-4. This approach is useful in understanding differences in skeletal muscle components as measured by the various methods. For example, anthropometry quantifies anatomic skeletal muscle whereas urinary creatinine excretion is a marker of muscle cell mass (Heymsfield et al., 1995; Lukasksi et al., 1996).
An overview is now provided that is organized as outlined in Table 12-3. This overview begins with the simpler methods such as anthropometry and progresses to the complex research-based methods of estimating skeletal muscle mass, such as in vivo neutron activation analysis.
AVAILABLE METHODS
Anthropometry
Development of anthropometric skeletal muscle prediction methods are limited. There are also very few model-based anthropometric methods for estimating regional skeletal muscle mass.
An example of a descriptive method is the anthropometric approach suggested by Martin and colleagues (Martin et al., 1990). Anthropometric dimensions were quantified on 12 male Caucasian cadavers who were then dissected and their muscles weighed. The average age (Standard deviation ± SD), weight, and stature of the Caucasian cadavers were 72 ± 8 years, 66.2 ± 12.5 kg, and 169.1 ± 8.2 cm, respectively. A regression equation was then
developed in which skeletal muscle (SM) was the dependent variable and anthropometric measurements the independent variables,
SM (g) = Stat ×(0.0553 ×CTG2 + 0.0987 ×FG2 + 0.0331 ×CCG2) -2445,
where Stat is stature in cm, CTG is thigh circumference corrected for the front thigh skinfold thickness in cm, FG is uncorrected forearm circumference in cm, and CCG is calf circumference corrected for the medial calf skinfold thickness in cm. The equation has a coefficient of determination R2 of 0.97 and an Standard Error of the Estimate (SEE) of 1.53 kg. There have not yet been any independent cross-validations of this anthropometric method.
Model-based regional anthropometric methods are widely used for estimating mid-calf, thigh, and upper arm circumferences or areas (Heymsfield et al., 1984). The model used is relatively simple: the limb is assumed to be a concentric set of three cylinders: inner bone, middle muscle, and outer adipose tissue. Limb circumference and a corresponding skinfold thickness are used in the model to calculate muscle area, which includes the enclosed bone. Models are also published for estimating bone-free skeletal muscle areas (Heymsfield et al., 1992)
Although the geometric models are relatively simple, the limb and its associated muscle compartment are complex. For example, calculated arm muscle area overestimates skeletal muscle by 15 to 25 percent in young nonobese subjects (Heymsfield et al., 1982). About one-half of the overestimate is due to the aforementioned inclusion of bone in the estimated area, and the remaining overestimate is due to assumption errors and non muscle tissue (e.g., neurovascular bundle) inclusion in the muscle compartment. Forbes et al. (1988) and Baumgartner et al. (1993) also reported that arm muscle area assumptions are inaccurate in obese and elderly subjects, respectively.
Another problem, particularly in elderly and malnourished subjects, is that atrophic skeletal muscle chemical composition differs from that of normal tissue (4-6). Water, lipid, and collagen are increased per unit tissue mass whereas noncollagen proteins are reduced (Heymsfield et al., 1992). The relative concentration of "functional" proteins is thus lower in atrophied muscle. Abrupt changes in muscle glycogen, as might occur with dieting or glycogen loading, can also change muscle size by approximately 5 to 10 percent as a result of the water-binding properties of glycogen.
The important potential for developing anthropometric muscle estimation equations now exists due to the development of magnetic resonance imaging (MRI) muscle mass measurement methods (discussed in a later section). A simple example demonstrating this potential is shown in Figure 12-3. In this study, multislice whole body MRI was used to estimate total body skeletal muscle volume in 79 healthy adults. Arm, thigh, and calf muscle areas were then calculated using the above mentioned geometric model based on skinfold
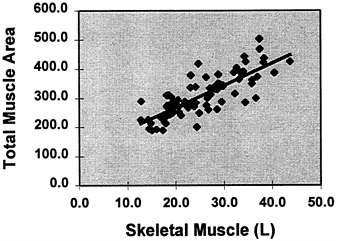
FIGURE 12-3 Sum of anthropometric limb muscle areas [cm2] versus total body skeletal muscle volume measured by multislice MRI in 79 healthy adults. (Total muscle area [cm2] = 7.6 × [Total MRI muscle volume, L) +115.4, R2 = 0.64, p < 0.001).
thickness and limb circumference (Heymsfield et al., 1984). The three anthropometric muscle areas were then summed and plotted against total skeletal muscle volume by MRI. As shown in the figure, there was a good skeletal muscle volume by MRI (Total muscle area [cm2] = 7.6 ×[total MRI muscle volume, in L) + 115.4, r2 = 0.64, p < 0.001). Anthropometric prediction equations could be developed by systematically extending this technique to specific populations.
Ultrasound
Ultrasound methods can be used to quantify mainly regional skeletal muscle thicknesses or diameters (Sipila et al., 1991), although as with skinfolds, the potential exists to develop whole body prediction formulas. Ultrasound, which was originally developed to detect underwater movement of submarines during World War II, is now used in cardiology, obstetrics, and many other branches of medicine throughout the world.
Two main ultrasound system types are in use, A mode and B mode. The first to be developed, the A mode system, passes an ultrasound signal from the system's probe, which is then reflected off anatomic structures. These reflected sound waves return to the probe as echoes. With A mode systems, tissue interfaces can be identified and the thickness of a muscle established. An important consideration and potential source of error is that with A mode systems, the ultrasound beam must be directed perpendicular to the skin surface, and the muscle site measured must be reproducible.
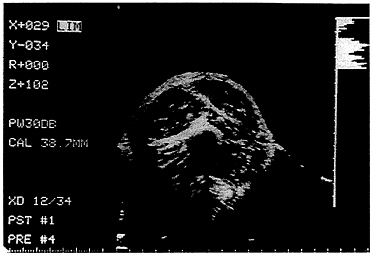
FIGURE 12-4 B-mode ultrasound cross-sectional image of the upper mid-arm in a healthy adult male.
The more-recent B mode systems produce a two-dimensional image of the scanned area, and muscle interfaces are identified as bright lines. An ultrasound cross-sectional image of the biceps muscle is presented in Figure 12-4. Current systems are mainly of the B mode type, operating at frequencies between 3 and 5 MHz.
Bioelectric Impedance Analysis
Bioelectric impedance analysis (BIA) was the subject of a conference and multi-author publication organized by the Nutrition Coordinating Center at the National Institutes of Health (Yanovski et al., 1996). The BIA method involves passing an alternating current at one or more frequencies via electrodes across a tissue bed, and the impedance or voltage drop to electrical flow is measured. Components rich in electrolytes, such as body fluids, impose minimal impedance while lipids and compact minerals impose a high impedance to electrical flow (Chumlea et al., 1994). Tissue composition is therefore the main determinant of impedance and its two components, resistance and reactance. Notably, impedance to electrical flow is determined primarily by the fluid volume present and length of the electrical pathway. The possibility exists to measure impedance of the extremities, skeletal muscle is the main determinant of extremity impedance. Appendicular and total body skeletal muscle can therefore potentially be estimated from measured extremity impedance or resistance by calibration against skeletal muscle mass using a reference method such as MRI or dual x-ray absorptionmetry (DXA).
Important recent advances permit the measurement of extremity impedance and other electrical characteristics such as reactance and phase angle. Baumgartner and colleagues (1989) examined segmental impedance and its relationship to total body impedance (Baumgartner et al., 1989). In this and other studies, investigators applied gel electrodes at predefined anatomical locations on the proximal and distal limb. A typical evaluation required two sets of injector and receiver electrodes, respectively. An important advance was made in 1994 by Organ and colleagues (1994), who developed a lead-switching algorithm for evaluating segmental impedance without the need for electrodes placed on the proximal aspect of the limb. By alternating voltage and current electrodes, the researchers were able to isolate the impedance of each arm and leg using six sets of distal limb gel electrodes. This laboratory expanded on these earlier studies by developing a BIA system for evaluating segmental impedance in the standing subject (Nunez et al., 1997). In this experimental system, conventional gel electrodes are replaced with stainless steel contact electrodes designed for both hands and feet (Figure 12-5). Electrical switching algorithms alternate current and voltage input so as to allow rapid measurement of each extremity impedance. In a recent study, researchers in this lab observed excellent agreement between extremity impedance measured with the new system and extremity impedance quantified using conventionally positioned limb gel electrodes (Nunez et al., 1997). Moreover, there was good agreement between limb or stature-adjusted impedance index (e.g., height squared/ impedance) and limb skeletal muscle mass (Nunez et al., 1997). For example, there was a strong correlation between ht2/leg-to-leg impedance and leg muscle as quantified by DXA (R2 = 0.72, p < 0.001) (Figure 12-6). Although this information is preliminary, the potential for evaluating the muscle compartment of each limb separately and total appendicular skeletal muscle mass is evident. Work in this area is Ongoing in this laboratory and at other research centers. The possibility also exists to extend this methodology to multifrequency BIA systems and to limb muscle water compartmentation.
Urinary Metabolites
Two metabolic end products, creatinine and 3-methylhistidine, are excreted in urine and classically have served as indices of skeletal muscle mass. Creatinine is produced by non enzymatic conversion of creatinine, which is distributed mainly in skeletal muscle. Catabolism of actomyosin, the primary skeletal muscle contractile protein, results in 3-methylhistidine release (Lukasksi et al., 1981). Both terminal products of metabolism are excreted in urine and to a lesser extent into the gastrointestinal tract and other secretions. A summary of the underlying assumptions of these two methods is presented in Table 12-5 (Lukasksi et al., 1981; Heymsfield et al., 1983).
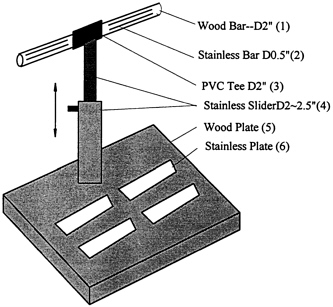
FIGURE 12-5 Electrode stand for measuring appendicular impedance. Four pairs of stainless steel electrodes contact each distal extremity, and electrical switching algorithms are used to measure the impedance of each limb and various limb combinations. This impedance approach can be used to estimate appendicular skeletal muscle mass.
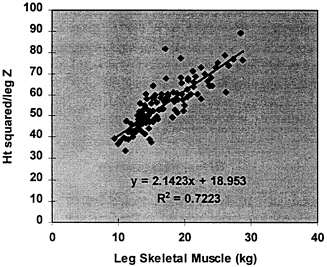
FIGURE 12-6 Stature-adjusted resistance (Ht2/Z) versus appendicular skeletal muscle estimated by DXA in 103 healthy adults [R2 = 0.72, p < 0.001]. Y = H2/Z; X, leg skeletal muscle; Z, impedance in ohms.
TABLE 12-5 Main Characteristics of Urinary Metabolite Methods
|
Method |
Creatinine |
3-Methylhistidine |
|
Model |
creatinine = K ×[Cr] ×SM SM = creatinine/(K ×[Cr]) |
3-MH = K ×[protein] ×SM SM = 3MH/(K ×[protein]) |
|
Assumptions |
Creatine is almost all within skeletal muscle. |
Histidine is in two muscle proteins, actin within all muscle fibers, and myosin in white fibers. |
|
Skeletal Muscle (SM) |
|
|
|
• Creatinine [Cr] and protein [protein] concentrations |
On a meat-free diet, the average concentration of creatine remains constant, and the total creatine pool remains constant. |
On a meat-free diet, the average protein concentration in muscle remains constant, and the total muscle protein pool remains constant. |
|
• Creatine or muscle protein daily fractional breakdown rate (K) |
Creatine is converted to creatinine at a constant daily rate. |
Muscle protein synthesis and catabolism are in balance, and thus, 3-MH is produced at a constant daily rate. |
|
• Urinary creatinine or 3-MH |
Creatinine is neither metabolized nor reused in metabolism and completely excreted in urine. |
3-MH is neither metabolized nor reused in metabolism and completely excreted in urine. |
|
• Prediction Equations |
SM = 18.9 ×creatinine + 4.1; r = 0.92, p < 0.001. |
SM = 0.0887 ×3MH + 11.8; r = 0.88. p < 0.001. |
Ideally, urine is collected under controlled dietary conditions (i.e., meat free) over several days, and the results are averaged. The between-day coefficient of variation for both methods is reasonably high (2-10%), even in careful and well-instructed participants.
The main concept of both methods is that the creatinine and 3-methylhistidine excreted in urine is related to the total endogenous pool and hence total body skeletal muscle mass. Although the data are limited, evidence supporting this hypothesis is reasonably good for healthy, weight-stable adults.
A traditional concept has been that creatinine excretion is directly proportional to total body skeletal muscle mass (Heymsfield et al., 1983). This is shown in Figure 12-7 and can be expressed mathematically as skeletal muscle/creatinine = constant or ''K." This led to the concept of a creatinine equivalence, in which 1 g of creatinine excreted in urine per day was purportedly equivalent to a specified weight of skeletal muscle mass. This hypothesis is not supported by experimental observations as the creatinine: skeletal muscle mass ratio is not constant, but varies as a function of muscle mass (Heymsfield et al., 1983). This phenomenon is thought to be due to the presence of non skeletal muscle sources of creatinine (Figure 12-7). For example, creatine is found in brain tissue and contributes to the urinary creatinine pool. Similarly, the 3-methylhistidine:skeletal muscle mass ratio is not constant (Wang et al., 1998), and 3-methylhistidine is also produced by
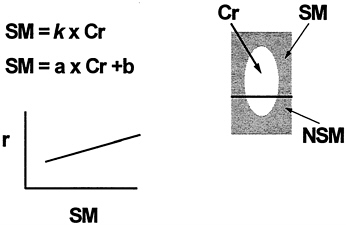
FIGURE 12-7 Muscle Mass: Urinary Creatinine Method. Main features of the 24-h urinary creatinine (Cr) method of estimating total body skeletal muscle mass (SM). The traditional view is that all of urinary creatinine is derived from SM and that the SM:Cr ratio is a constant (k). Experimental observations, however, indicate nonskeletal muscle (NSM) sources of Cr and a nonzero intercept when Cr is plotted against measured SM. Hence, prediction of SM by Cr requires descriptive regression model development with slope a and intercept b.
FIGURE 12-8 Total body skeletal muscle mass measured by computerized tomography (CT) (in kg) on the ordinate versus 24-hour urinary creatinine excretion (in g/d) on the abscissa (n = 12; SM = 18.9 ×Cr + 4.1; r = 0.92, p = 2.55 ×10⁻⁵; SEE = 1.89 kg). Source: Wang et al., 1996a.
tissues other than skeletal muscle. As a result, both methods can be formulated on descriptive mathematical functions (i.e., skeletal muscle = a ×Cr + b) developed using regression analysis with methods such as computerized axial tomography (CT) and MRI as the skeletal muscle reference. For example, this group studied healthy men on a 7-day, meat-free diet (Wang et al., 1998; Wang et al., 1996a). Urine was collected on the last three experimental days, and results creatinine (g) (Wang et al., 1997) and 3-methyl histidine excretion (μmol) (Wang et al., 1998) and skeletal muscle volume by 22 slice CT as shown in Figures 12-8 (SM = 18.9 ×Cr + 4.1; r = 0.92, p = 2.55 ×10⁻⁵; SEE = 1.89 kg) and 12-9 (SM = 0.0887 ×3MH + 11.8; r = 0.88, p < 0.001; SEE = 2.3 kg), respectively. In both examples, the lack of a "zero" intercept for the urinary metabolite versus skeletal muscle regression line indicates a non constant ratio of urinary metabolite to skeletal muscle mass.
The strong associations observed between urinary metabolites and skeletal muscle mass provide an opportunity to develop skeletal muscle prediction formulas. Additional studies are needed across groups that differ widely in age, gender, and ethnicity. Such studies could provide useful skeletal muscle prediction formulas based on urinary metabolite excretion. The limitation of these methods is the high level of subject participation required for dietary compliance and accurate urine collection. Also, 3-methylhistidine can be measured only in specialized laboratories, whereas creatinine is an almost universally available and inexpensive test.
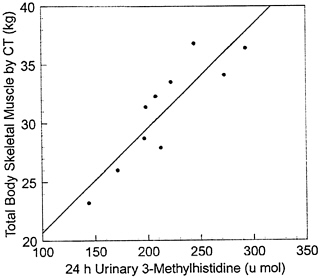
FIGURE 12-9 Total body skeletal muscle mass measured by computerized tomography (CT) (in kg) on the ordinate versus 24-hour urinary 3-methylhistidine excretion (3MH, in μmol) on the abscissa (n = 10; SM = 0.0887 ×3MH + 11.8; r = 0.88, p < 0.001; SEE = 2.3 kg). Source: Wang et al., 1998.
Imaging Methods
Imaging methods represent the most important advance in the evaluation of skeletal muscle mass. Two main types of imaging systems are now in use, CT and MRI. These methods are extensively reviewed in Heymsfield et al., 1997a and Sjöström, 1991. Both CT and MRI are capable of gathering cross-sectional images at predefined anatomic locations. The cross-sectional image per se can then be used to quantify selected muscle areas. Multiple cross-sectional images can be used to reconstruct whole muscle groups or total body skeletal muscle mass.
Imaging methods gather data in the form of picture elements or "pixels." Addition of thickness to the pixel creates a volume element or "voxel." When the outer and inner edges of a muscle group are traced on the system scanner, the enclosed pixels include myofibers, nerves, adipocytes, and other components, which collectively are referred to as anatomic skeletal muscle (Figure 12-1).
Historically, CT was the first available imaging method, introduced in 1971 by Hounsfield (1973). Although the underlying physical concepts related to MRI were developed in 1946, it was not until 1984 that in vivo images were first reported (Foster et al., 1984). The CT method relies on x-ray attenuation data collected as the tube and detector rotate in a plane perpendicular to the subject. Images produced by MRI are related to signals measured during alternating magnetic field and radio frequency pulses. The main nuclear effects involve abundant hydrogen and hydrogen proton (i.e) imaging is widely used in the clinical setting. A typical MRI study is shown in Figure 12-10, which demonstrates cross-sectional slices through selected muscle groups and visceral organs (Heymsfield et al., 1997b).
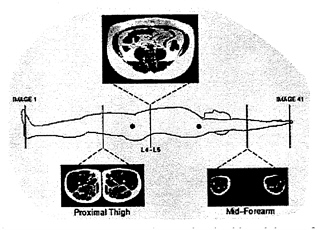
FIGURE 12-10 Three magnetic resonance images in a healthy adult, one from the abdomen and two from the appendicular region. The images were acquired using a Tl-weighted, spin-echo pulse sequence. Using this protocol adipose tissue appears white and nonadipose tissue is dark on all images. SOURCE: With permission, from the Annual Review of Nutrition, Volume 17, © 1997, by Annual Reviews, http://www.AnnualReviews.org.
Many studies have examined the validity of CT- and MRI- measured cross-sectional image areas and whole body components (Heymsfield et al., 1997a). Volumes of phantoms, isolated cadaver organs, and in situ cadaver organs measured by CT and MRI are in close agreement with actual values (Sjöström et al., 1991; Heymsfield et al., 1997a). Converting volume estimates to mass requires an assumed tissue density, which for skeletal muscle is 1.04 g/cc. CT and MRI validation studies are reviewed by Heymsfield et al. (1997a).
An important issue not yet totally resolved is the accuracy of CT and MRI in quantifying adipose tissue-free skeletal muscle. The enclosed area within a traced muscle includes entrapped adipose tissue, a component that increases on a relative basis with some diseases and advancing age. Careful manual tracing with the scanner's computerized track-ball device allows exclusion of obvious adipose tissue, and more complex pixel separation algorithms are also possible. Nevertheless, it is difficult to separate out completely all intramuscular adipose tissue using imaging methods, and more advanced techniques may be necessary. With CT, it is possible to identify specific attenuation (i.e., based on Hounsfield units) ranges for adipose tissue and muscle, and this approach appears to provide reasonable separation of the two components. Magnetic resonance spectroscopy methods are becoming increasingly available for in vivo human research, and this may aid in pixel separation (Gadian et al., 1995). Spectroscopic methods based on various nuclei may also eventually be able to quantify skeletal muscle molecular level components, such as water and glycogen in humans (Jue et al., 1989).
At present, most investigators have at their disposal both CT and MRI, although high cost remains a problem at some medical centers. The disadvantage of CT is radiation exposure, which can be substantial for multislice whole body studies. Some subjects become claustrophobic inside the MRI system's magnet bore, although open systems are currently being sold.
Both CT and MRI are based on measured physical properties and well-established reconstruction formulas. Assuming image slices are spaced closely, or even adjacent to one another, there is little question that imaging-derived skeletal muscle can serve as a reference for other methods.
Dual-Energy X-Ray Absorptiometry
DXA systems are the most recent version of methods designed to quantify bone characteristics in the study of osteoporosis (Cameron et al., 1963). Two main photon energy peaks are produced by alternating an x-ray source kVp or by rare-earth filtration. Attenuation of photons occurs as the two energy peaks pass through tissue, and those remaining are counted as they impinge on appropriately positioned detectors. Photon attenuation is characteristic of the applied x-ray energies and elemental characteristics of the tissue under study. These differing characteristics can be expressed mathematically as the ratio, R,
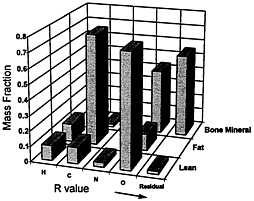
FIGURE 12-11 Mass fraction of main elements in lean soft tissues, fat, and bone mineral based on Reference Man. Residual Mass represents the sum of Na, Mg, P, S, Cl, K, Ca, and trace elements. The respective calculated R values at 40 keV and 70 keV for fat, lean, and bone mineral are 1.21, 1.37, and 2.86, respectively. Source: With permission, from the Annual Review of Nutrition, Volume 17, © 1997, by Annual Reviews, http://www.AnnualReviews.org.
attenuation at the low energy to that at the high energy. Fat, bone, mineral, and remaining bone mineral-free lean tissue have characteristic elemental makeup and hence R values (Figure 12-11), which allows for their separation using DXA attenuation Values and various mathematical algorithms. Many studies now generally support DXA-measured body composition components in humans and animals (Korht et al., 1995).
Most DXA systems allow isolation of different regions of the body, including the appendages. Lean mass of the upper and lower extremities can be assumed equivalent to appendicular skeletal muscle with a small and relatively constant amount of skin and other non muscle components (Heymsfield et al., 1990). Appendicular skeletal muscle is about 75 percent of total body skeletal muscle mass (Figure 12-12), and this fraction is assumed stable within and
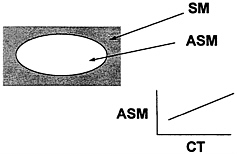
FIGURE 12-12 Appendicular Skeletal Muscle Mass DXA Method. Main features of the Dual X-Ray Absorpiometry method of estimating appendicular skeletal muscle mass (ASM). CT, computerized axial tomography; SM, skeletal muscle mass. See text for additional details.
between individuals. That is, a plot of DXA-estimated appendicular skeletal muscle mass versus total body skeletal muscle mass should show a strong correlation and an intercept not significantly different from zero. In such a study, Wang et al. (1996) measured total body skeletal muscle mass in 25 men using multislice CT. There was a strong correlation between DXA-determined appendicular skeletal muscle and total body skeletal muscle by CT (r = 0.95, p < 0.001). A plot of DXA appendicular skeletal muscle versus total body skeletal muscle volume by multislice MRI derived from archives in this laboratory supports the study of Wang et al. as shown in Figure 12-13 (n = 72, DXA appendicular skeletal muscle = 0.83 ×MRI skeletal muscle + 2.7, R2 = p < 0.001). Both studies demonstrate regression line slopes larger than (˜.083-.085) the expected (0.75), and the cause of this discrepancy is under investigation. In another study, Baumgartner et al. (in press) compared appendicular skeletal muscle estimated by DXA with muscle volume measured with MRI and found an equally good correlation (r2 in range of 0.95) between the two.
Considerably more progress can be made in modeling appendicular lean mass as derived by DXA. For example, formulas can be developed for converting lean tissue to muscle and appendicular muscle to total body muscle.
Repeated measurements by DXA of appendicular lean muscle mass indicated technical errors for arm, leg, and total body skeletal muscle of 7.0 ± 2.4 percent, 2.4 ± 0.5 percent, and 3.0 ± 1.5 percent, respectively (Clasey et al., 1997). More research is needed in establishing comparability of body composition estimates across manufacturers and in evaluating if, and to what
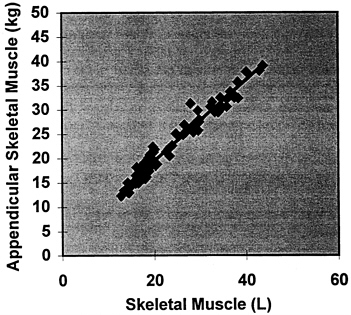
FIGURE 12-13 DXA-measured appendicular skeletal muscle versus total body skeletal muscle volume (L) by multislice magnetic resonance imaging in 72 healthy men and women.
TABLE 12-6 Summary of R Values of Various Human Soft Tissues for Three Age Groups
|
|
Age Groups |
|||
|
Soft Tissue |
Newborn |
4-7 months |
Adults |
R value |
|
Skeletal muscle |
1.35237 |
1.35187 |
1.35311 |
n.s. |
|
Heart |
1.35617 |
1.35422 |
1.35400 |
n.s. |
|
Liver |
1.35568 |
1.35333 |
1.35428 |
n.s |
|
Kidney |
1.35778 |
1.35971 |
n.s |
|
|
SOURCE: Reprinted from Applied Radiation Isotopes, Volume 49, Pietrobelli et al., lean value for DXA Two-component Soft-Tissue Model: Influence of Age and Tissue/Organ Type, Pages 743-744, Copyright 1998, with permission from Elsevier Science. |
||||
extent, variation in muscle hydration influences lean mass estimates by DXA. There appears to be no influence of age on DXA physical models used for estimating the three main components as shown in Table 12-6. Pietrobelli et al. (1998) observed similar attenuation ratios (i.e., r values) for skeletal muscle based on chemical analysis of biopsies in subject groups ranging in age from newborns to adults. Hence, for a low cost and with minimal radiation exposure, DXA allows quantification of a large proportion of total body muscle mass.
In Vive Neutron Activation/Whole Body Counting
Skeletal muscle tissue has a relatively small extracellular fluid compartment and large myofibrillar mass (Synder et al., 1975). As a result, skeletal muscle is relatively rich in intracellular potassium when referenced to other components such as total body protein (i.e., nitrogen). Anderson (1963) and later Burkinshaw (1978) and their colleagues exploited this property of muscle tissue to develop multicomponent models. Notably, Burkinshaw's classic model was based on a known and constant ratio of potassium (K) to nitrogen (N) in muscle (3.03 mmol/g) and non-muscle lean tissue (1.33 mmol/g) (Figure 12-14). Burkinshaw, and later Cohn et al. (1980), developed their models based on chemically analyzed tissue samples. A two-component model can be developed:
skeletal muscle (kg) = [TBK (mmol) -1.33 ×TBN (g)] / 51.0
non-skeletal muscle (kg) = [3.03 ×TBN (g)-TBK (mmol)] / 61.2
Where TBK is total body potassium and TBN is total body nitrogen, prompt-γ neutron activation analysis is used to measure TBN, and whole-body 40K counting is used to measure TBK (Cohn et al., 1980).
Although the K:N model is of historic interest, there are a number of problems now recognized with the method. First, the K:N ratio is probably not constant in muscle and non muscle lean tissues but may change with age and other factors such as physical activity level. As a result, large between-individual differences most likely exist in the above model constants. Accordingly, Wang et al. (1996) observed a significant correlation between total
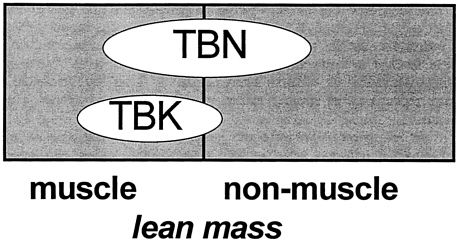
FIGURE 12-14 Muscle Mass: TBN-TBK Model. Main features of the neutron activation-whole body counting method of estimating muscle and nonmuscle lean tissue mass. TBK and TBN are total body potassium and nitrogen, respectively. The applied model assumes stable TBK/TBN ratios of muscle and nonmuscle lean mass components.
body skeletal muscle derived by the Burkinshaw-Cohn model and total body skeletal muscle by CT in healthy men and men with acquired immunodeficiency syndrome (AIDS) [SMBurkinshaw = 0.990 ×SMcr -6.4; r = 0.83, p = 0.0001, SEE = 4.4 kg, n = 25]. Compared with CT, the Burkinshaw method underestimated skeletal muscle by a mean of 6.9 kg (20.1%, p = 0.0001) and 6.3 kg (23.2%, p = 0.01) in healthy men and men with AIDS, respectively. The hypothesized cause of large between-individual differences in estimated versus measured skeletal muscle (R2 of 0.65 and SEE of 4.4 kg) and observed bias is model errors (Wang et al., 1996b). Second, the method involves radiation exposure, and alternative methods are available with little or no radiation exposure and with equivalent or superior accuracy. Lastly, very few centers have the necessary facilities for measuring TBN and TBK.
The potential exists to develop improved skeletal muscle mass formulas based on TBN and TBK, and studies such as these should be carried out in the future.
Monitoring Changes in Skeletal Muscle Mass Over Time
An important and inadequately studied topic is selection of a measurement method for monitoring changes in skeletal muscle mass and composition over time. The following is an overview of the potential role of each method in evaluating skeletal muscle changes over time.
Anthropometric and ultrasound methods quantify anatomic skeletal muscle and are thus influenced by all muscle components. Observed temporal changes can reflect, for example, alterations in intramuscular adipose tissue at the tissue system level or in water and glycogen at the molecular level. A change in anthropometrically- or ultrasound-derived muscle mass may therefore not always reflect parallel changes in the main component of interest, muscle proteins.
A second concern related to anthropometry and ultrasound is measurement error, which is relatively large for both methods (e.g., within- and between-observer technical errors in the range of ˜5-8%) (Nelson et al., 1996). Both anthropometric and ultrasonic measurements are useful mainly in evaluating large skeletal muscle mass changes over long time periods. The cost of these methods is relatively low and the measurements can be made in field settings.
Urinary metabolites are markers of muscle cell mass, but as already mentioned, there are non muscle sources of both creatinine and 3-methylhistidine. These methods require careful urine collection protocols and subject compliance on a meat-free diet. Even under well-controlled conditions, the between-day coefficient of variation is relatively large (i.e., 4-8%). These methods may therefore be useful in evaluating large muscle mass changes over time or changes in groups of subjects. As creatinine is easy to measure, this method may be applicable in settings without sophisticated analytical equipment.
Bioelectric impedance analysis requires strict attention to measurement protocol (Nelson et al., 1996). Under carefully controlled conditions, the between-measurement technical error of BIA is very small (˜1-3%). Measured impedance may, however, reflect changes in electrolyte concentrations, fluid distribution, and adiposity that occur in patients followed over time. Because BIA methods are inexpensive and simple, they have value in field settings. More studies of the ability of BIA methods to quantify small changes in skeletal muscle mass are needed.
Imaging methods have the most potential for quantifying small skeletal muscle mass and composition changes. At present, the CT method is well suited to measure adipose tissue-free muscle (Sjöström et al., 1991; Heymsfield et al., 1997b), and the same applies to MRI although lingering concerns remain. Specifically, validated procedures for estimating adipose tissue content of muscle by MRI have not yet been published. Both of these imaging methods will record a change in muscle mass related to any one or more components including protein, water, glycogen, and various fluid spaces. With this proviso, the between-measurement technical errors for skeletal muscle areas and volumes by CT and MRI are small (< 2%) (Sjöström et al., 1991; Heymsfield et al., 1997b; Wang et al., 1996a; Ross et al., 1995), particularly if repeated measurements are made by the same observer. Hence, the likelihood of detecting small muscle volume changes by CT and MRI is good. The disadvantage of these methods is their relatively high cost and limited access.
The DXA method has relatively low technical errors for appendicular skeletal muscle mass measurements (e.g., 2.4 ± 0.5% for leg). As DXA measures total extremity lean mass, changes in mass may be brought about by alterations in skeletal muscle water, fluid spaces, and glycogen. The relative safety and increasing availability of DXA makes it a good choice for longitudinal studies of skeletal muscle mass. However, some concerns are arising on the validity of DXA body composition measurements carried out over time, and more studies are needed to examine the validity of longitudinal DXA skeletal muscle mass estimates.
The in vivo neutron activation method was used in longitudinal studies prior to the development of the newer aforementioned methodologies. The technical error of both TBN (i.e., 3.6%) and TBK (i.e., 3.2%) are high, and method availability is limited. Therefore, this method cannot be recommended for longitudinal studies of skeletal muscle mass.
CONCLUSIONS
Great strides have been made in quantifying skeletal muscle mass over the past decade, and many studies are under way to refine further the many available methods. Moreover, the important potential now exists to link muscle mass with muscle metabolic processes and function using currently available methodology. These advances should prove to be of value in studying issues of importance to military operations.
REFERENCES
Anderson, E.C. 1963. Three component body composition analysis based on potassium and water determinations. Ann NY Acad Sci. 110:189-212.
Baumgartner R.N., W.C. Chumlea, and A.F. Roche. 1989. Estimation of body composition from bioelectric impedance of body segments. Am J Clin Nutr. 50:221-226.
Baumgartner R.N., R.L. Rhyne, P.J. Garry, S.B. Heymsfield. 1993. Imaging techniques and anatomical body composition in aging. J Nutr. 123:444-448.
Baumgartner, R.N., R. Ross, S.B. Heymsfield, Z. Wang, D. Gallagher, Y. Martel, J. De Guise, W. Brooks. In Press. Cross-validation of DXA versus MRI methods of quantifying appendicular skeletal muscle . Applied Radiation and Isotopes.
Bortz W.M. II. 1982. Disuse and aging. JAMA 248:1203-1208
Burkinshaw, L., G.L. Hill, D.B. Morgan. 1978. Assessment of the distribution of protein in the human body by in-vivo neutron activation analysis. International Symposium on Nuclear Activation Techniques in the Life Sciences. Vienna: International Atomic Energy Association.
Cameron, J. R., J. Sorenson. 1963. Measurement of bone mineral in vivo. Science 42:230-232.
Chumlea W.C., S.S. Guo. 1994. Bioelectrical impedance and body composition: Present status and future directions. Nutr Rev. 52: 123-131.
Clasey, J.L., M.L. Hartmen, J. Kanaley, L. Wideman, C.D. Teates, C. Bouchard, A. Weltman. 1997. Body composition by DEXA in older adults: Accuracy and influence of scan mode. Med Sci Sports Exerc.29:560-567.
Cohn, S.H., D. Vartsky, S. Yasumura, A. Sawitsky, I. Zanzi, A. Vaswani, K.J. Ellis. 1980. Compartmental body composition based on total-body nitrogen, potassium, and calcium. Am J Physiol. 39: E524-530.
Forbes G.B., M.R. Brown, H.J.L. Griffiths. 1988. Ann muscle plus bone area: Anthropometry and CAT scan compared. Am J Clin Nutr. 47:929-931.
Foster, M.A., J.M.S. Hutchison, J.R. Mallard, and M. Fuller. 1984. Nuclear magnetic resonance pulse sequence and discrimination of high- and low-fat tissues. Mag. Res. Imaging 2:187-192.
Gadian, D.G. 1995. NMR and Its Applications to Living Systems, 2nd edition. New York: Oxford University Press.
Heymsfield S.B., C. McManus, J. Smith, V. Stevens, D.W. Nixon. 1982. Anthropometric measurement of muscle mass: Revised equations for calculating bone-free arm muscle area. Am J Clin Nutr. 36:680-690.
Heymsfield, S.B., C. Arteaga, C. McManus, J. Smith, S. Moffitt. 1983. Measurement of muscle mass in humans: Validity of the 24-hour urinary creatinine method. Am J Clin Nutr. 37: 478-494.
Heymsfield S.B., C. McManus III, S. Seitz, D. Nixon, J. Smith. 1984. Anthropometric assessment of adult protein-energy malnutrition. Pp. 27-82 in RA Wright and SB Heymsfield (eds). Nutritional Assessment of the Hospitalized Patient. Boston: Blackwell Scientific Publications, Inc.
Heymsfield, S.B., R. Smith, M. Aulet, B. Bensen, S. Lichtman, J. Wang, and R.N. Pierson, Jr. 1990. Appendicular skeletal muscle mass: Measurement by dual-photon absorptiometry. Am. J. Clin. Nutr. 52: 214-218.
Heymsfield S.B., A. Tighe, Z. Wang. 1992. Nutritional assessment by anthropometric and biochemical methods. In: Shils ME, Olson JA, Shike M (Eds) Modem Nutrition in Health and Disease. Philadelphia: Lea and Febiger, Eighth Edition.
Heymsfield, S.B., D. Gallagher, M. Visser, C. Nunez, Z. Wang. 1995. Measurement of skeletal muscle: laboratory and epidemiological methods. J. Gerontol. 50A:23-29.
Heymsfield, S.B., R. Ross, Z. Wang, D. Frager. 1997a. Imaging Techniques of Body Composition: Advantages of Measurement and New Uses. Pp. 127-150 in Emerging Technologies for Nutrition Research, S.J. Carlson-Newberry and R.B. Costello, eds. Institute of Medicine. Washington, DC: National Academy Press.
Heymsfield, S.B., Z. Wang, R.N. Baumgartner, R. Ross. 1997b. Human body composition: Advances in models and methods. Ann. Rev. Nutr. 17:527-558.
Hochachka P. 1994. Muscles as Molecular and Metabolic Machines. Boca Raton: CRC Press.
Hounsfield, G.N. 1973. Computerized transverse axial scanning (tomography). Br. J. Radiol. 46:1016.
Jue, T., D.L. Rothman, G.I. Shulman, B.A. Tavitian, R.A. DeFronzo, and R.G. Sulman. 1989. Direct observation of glycogen synthesis in human muscle with 13C NMR. Proc of the National Academy of Sciences. 86:4489-4491.
Kohrt, W. 1995. Body composition by DXA: Tried and true? Med. Sci. Sports Exerc. 27:1349-1353.
Kushner, R.F., R. Gudivaka, D.A. Scholler. 1996. Clinical Characteristics influencing bioelectrical impedance analysis measurements. Am J Clin Nutr. 64(suppl):423S-427S.
Lexell J., C.C. Taylor, M. Sjöström. 1988. What is the cause of the aging atrophy? J Neurol Sci. 84:275-294.
Lukasksi, H.C. 1996. Estimation of muscle mass. Pps. 109-128 in Human Body Composition, A.F. Roche, S.B. Heymsfield, T.G. Lehman, eds. Champaign, Ill.: Human Kinetics Publishers.
Lukasksi, H.C., J. Mendez, E.R. Buskirk, S.H. Cohn. 1981. Relationship between endogenous 3-methylhistidine excretion and body composition. Am J Physiol. 240:E302-E307.
Martin A.P., L.F. Spenst, D.T. Drinkwater, J.P. Clarys. 1990. Anthropometric estimation of muscle mass in men . Med Sci Sports Exerc. 22:729-733.
Nelson, M.E., M.A. Fiatarone, J.E. Layne, I. Trice, C.D. Economoc, R.A. Fielding, R. Ma, R.N. Pierson, W.J. Evans Nunez C, D. Gallagher, M. Visser, F.X. Pi-Sunyer, Z. Wang, S.B. Heymsfield. 1996. Analysis of body composition techniques and models for detecting change in soft tissue with strength training. Am J Clin Nutr. 63:678-686.
Nuñez, C., D. Gallagher, M. Visser, F.X. Pi-Sunyer, Z. Wang, and S.B. Heymsfield. 1997. Bioimpedance analysis: Evaluation of leg-to-leg system based on pressure contact footpad electrodes. Med. Sci. Sports Exerc. 29:524-531.
Nunez C., J. Grammes, D. Gallagher, R.N. Baumgartner, Z. Wang, S.B. Heymsfield. 1996. Appendicular skeletal muscle: Estimation by total limb impedance measured with new electrode system. Faseb J. 10:3.
Organ L.W., G.B. Bradham, D.T.W. Gore, S.L. Lozier. 1994. Segmental bioelectrical impedance analysis: Theory and Application of a new technique. J. Appl. Physiol. 77:98-112.
Pietrobelli, A., D. Gallagher, R. Baumgartner, R. Ross, S.B. Heymsfield. R. 1998. Lean value for DXA Two-component Soft-Tissue Model: Influence of Age and Tissue/Organ Type. Appl. Radiat. Isot. 49(5-6):743-744.
Ross, R., H. Pedwell, J. Rissanen. 1995. Response of total and regional lean tissue and skeletal muscle to n program of energy restriction and resistance exercise. Int J Obes. 19:781-787.
Sipila S., H. Suominen. 1991. Ultrasound imaging of the quadriceps muscle in elderly athletes and untrained men. Muscle and Nerve 14:527-533.
Sjöström, L.A. 1991. A computer-tomography based multicompartment body composition technique and anthropometric predictions of lean body mass, total and subcutaneous adipose tissue. Int J Obesity. 15:19-30.
Snyder W.S., M.J. Cook, E.S. Nasset, L.R. Karhausen, G.P. Howells, I.H. Tipton. 1975 Report of the Task Group on Reference Man. Oxford: Pergamon Press.
Tomlinson B.E., J.N. Walton, J.J. Rebeiz. 1969. The effects of aging and of cachexia upon skeletal muscle. A histopathological study. J Neurol Sci. 9:321-346.
Wang Z., R.N. Pierson Jr, and S.B. Heymsfield. 1992. The five-level model: A new approach to organizing body composition research. Am. J. Clin. Nutr. 56:19-28.
Wang Z., S. Heshka, R. Pierson, S.B. Heymsfield. 1995. Systematic organization of body-composition methodology: An overview with emphasis on component-based methods. Am J Clin Nutr. 61: 457-465.
Wang, Z., D. Gallagher, M. Nelson, D. Matthews, S.B. Heymsfield. 1996a. Total body skeletal muscle mass: Evaluation of 24 hour urinary creatinine excretion method by computerized axial tomography. Am. J. Clin. Nutr. 63:863-869.
Wang, Z., M. Visser, R. Ma, R. Baumgartner, D. Kotler, D. Gallagher, and S.B. Heymsfield. 1996b. Skeletal muscle mass: Evaluation of neutron activation and dual-energy x-my absorptiometry methods. J. Appl. Physiol. 80(3):824-831.
Wang, Z., P. Deurenberg, D. Matthews, S.B. Heymsfield. 1998. Urinary 3-methylhistidine excretion: Association with total body skeletal muscle mass by computerized axial tomography. J. Parenter. Enteral. Nutri. 22:82-86.
Yanovski, S.Z., V.S. Hubbard, S.B. Heymsfield, H.C. Lukasksi. 1996. Bioelectrical Impedance Analysis in Body Composition Measurement. Proceedings of ay National Institutes of Health Technology Assessment Conference. Bethesda, Maryland, December 12-14, 1994. Am. J. Clin Nutr. 64(3S):387-532S.


