
Evolution of the North American Transportation Sector
There are many economic and technological changes that may influence the evolution of the transportation sector in the coming decades. Richard Mudge, of Apogee Research Inc., identified some of these trends including:
-
International trade continues to increase, as does per capita consumption of goods and services.
-
Light manufacturing and the service industry are the fastest growing business sectors, and most jobs today are created by small businesses.
-
New paradigms for how business operates, such as less bulk inventory, just-in-time delivery, and dispersion of production facilities mean that transportation is becoming more specialized and is often contracted out.
-
There is increasing use of Intelligent Transportation Systems (ITS), which use new computer and communications technology, global positioning systems, and automated vehicle identification to prevent accidents, to smooth the flow of traffic, and to develop more targeted transport pricing.
-
The telecommunications revolution may change many patterns of work, although it is not clear at this point if it will substitute for travel or stimulate more travel.
Alan Pisarski discussed the demographic trends that will alter the transportation sector in the coming decades. In the United States, stabilizing forces include the fact that neither the population nor the size of the labor force is projected to grow significantly; also, certain segments of the population (white males) have reached saturation in the number of new driver's licenses. Other forces will lead to more growth in the use of personal passenger vehicles; in particular, the percentage of women, minorities, and immigrants who are licensed drivers will all likely continue to increase. At this time, the number of vehicles actually exceeds the number of drivers.The majority of American households have two or more vehicles, and most future growth in car and light truck purchases will be from multi-vehicle households.
Pisarski also reviewed some discouraging transportation trends in the United States with regards to fuel conservation. From 1980 to 1990, 22 million drive-alone workers were added to the roads while car pooling rates dropped sharply. Use of transit remains stagnant or is declining in most areas. Cities are continuing to spread out as jobs are now following people to the suburbs, and these suburban-suburban flows dominate growth in traffic. Ken Ogilvie, of the Ontario Roundtable, noted that Canadian cities like Toronto are also heading towards this urban sprawl model. In the newer suburban areas, vehicle ownership is almost twice as high and there are three times as many ‘lane-kilometers ' of roads per capita than in the more mature, built-up areas.
Lee Schipper, from Lawrence Berkeley National Laboratory, explained that recent auto efficiency trends (for the United States) are discouraging as well. The fuel efficiency of new cars steadily improved from 1970 to the mid-1980s, but has since leveled off (Figure 1). There is a lot of potential for energy savings in the transportation sector; however, it is not happening for several reasons:
-
Real prices for gasoline in the United States are lower than they were twenty years ago.
-
A significant share of the gains made in improved engine efficiency are going to boost vehicles' power and performance, not to improving their fuel economy.
-
There is a mismatch between vehicle design and operation. Most cars and light trucks are optimally designed for long distance travel, yet the great majority of their use is for short, local trips.
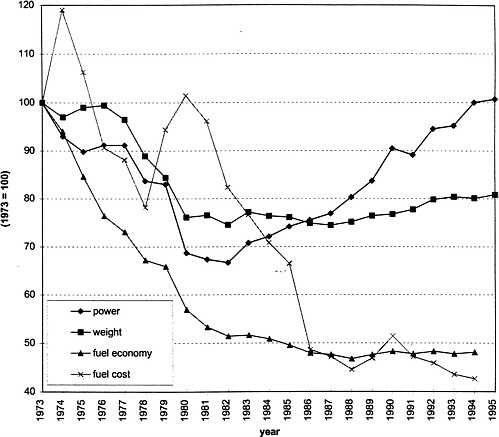
Figure 1. Evolution of the new car fleet in the United States. Shown are relative changes (normalized to the year 1973) in the new car fleet's average maximum engine power, average vehicle weight, average fuel consumption rate, and average consumer gasoline prices (in real dollars). From Lee Schipper, International Energy Agency, based in part on data from the U.S. National Highway Transportation Safety Association.
Mariano Bauer, from Universidad Nacional Autonoma de Mexico, emphasized that while Mexico may be following some of the same transportation trends as the United States and Canada, it is on a very different point in the development curve. For instance, there are more cars in the state of California than in the entire country of Mexico, and the dominant form of transportation in Mexico City is the ‘microbus ', not private vehicles. This difference is reflected in Mexico's much lower per capita CO2 emissions ( Figure 2 ). Bauer also reminded participants that, in addition to the many economic, technological, and demographic forces influencing the evolution of the transportation sector, there are less quantifiable cultural forces that play just as big a role in shaping trends.
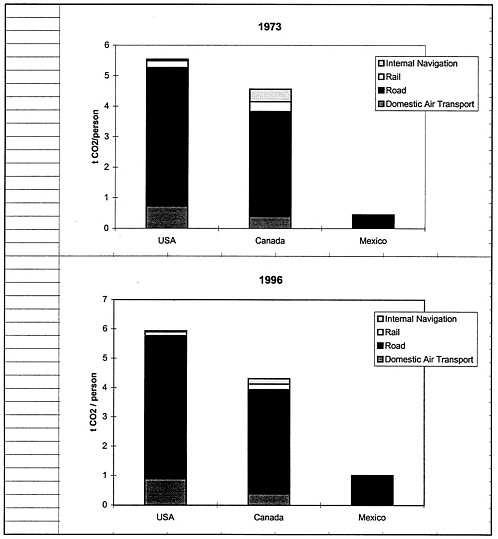
Figure 2. CO2 emissions per capita, coming from different segments of the transportation sector in the United States, Canada, and Mexico. From Lee Schipper, International Energy Agency.


