
Linking Information Across the Acquisition Process
The acquisition of military weaponry and equipment is a multistage process that includes various milestones involving information and data support that lead to the next stage of the process.
THE ACQUISITION PROCESS
After mission needs are determined, a cost and operational effectiveness analysis identifies possible systems that meet those needs and, for each system, estimates the cost and the system effectiveness across tasks and environments. The COEA is updated later in the acquisition process when a single system has been identified. Performance and cost estimates are less variable for this update since it is a more focused analysis. The system then undergoes developmental testing. Developmental tests frequently identify problems with the initial design, such as a failure to achieve needed performance standards, and consequently the design is improved and then tested again. Finally, when the development process is completed, the system is operationally tested under a variety of realistic conditions.
As noted above, there are many potential sources of information about how well a prospective system is likely to perform. These sources include data on how similar systems have performed in the past, data on how system components have performed when used in other systems, data from earlier COEAs on the present system, results of simulations, and expert judgment. Information from different sources is likely to come in different
formats, be expressed in different forms, and be directed toward answering different (although related) questions. The problem of integrating these diverse sources of information is beyond the scope of the standard statistical methods with which most test analysts are familiar. Several statisticians in the group suggested some less familiar statistical approaches that show promise for this purpose.
BAYESIAN INFERENCE AND HIERARCHICAL MODELING
Almost all statistics courses for nonspecialists adopt the classical frequentist approach to statistical inference. In the frequentist view, statistical methods can be legitimately applied only to data that can be regarded as coming from some random process. The Bayesian approach sees statistics as a set of tools for quantifying how our uncertainty about any phenomenon (random or simply unknown) changes as we acquire more information about it. Problems that are particularly well-suited to Bayesian analysis are those in which (1) there exists substantial, reliable expertise regarding the phenomenon under study and (2) the amount of direct, experimental data is small. If, in such problems, the information contained in expert opinion is not quantified and used, consequent inferences based only on the sparse data will often fail to meet reasonable standards of precision.
The chief motivation for the subsequent discussion of Bayesian inference is that problems of this type arise repeatedly in DoD evaluation and testing. In principle, the Bayesian paradigm can be used to incorporate all sources of information about a weapon system to arrive at an overall assessment of how well the system is likely to perform and the degree of uncertainty surrounding the assessment. In practice, some problems may involve fairly straightforward applications of existing techniques while other problems may involve difficult modeling issues and require the development of new methods.
In the Bayesian approach, one's uncertainty about any phenomenon may be represented by a probability distribution for the quantity of interest under consideration. The field of Bayesian statistics studies how this probability distribution changes as new information about the quantity of interest is obtained. The three basic components of Bayesian inference are:
-
The prior distribution is a probability distribution that represents the state of knowledge about the quantity of interest before the data to be analyzed have been incorporated.
-
The likelihood function is a set of probability distributions, one for each possible value of the quantity of interest, that expresses how likely it is that the data would have arisen given each possible value.
-
The posterior distribution is the result of a Bayesian analysis. Computed
-
from the prior distribution and the likelihood function, it represents the new state of knowledge after the information from the data has been assimilated.
For a given problem, if one is able to specify a set of possible actions and quantify the consequences of making different decisions under different conditions (i.e., construct a loss function), then statistical decision theory can be applied as a formal mechanism for determining the optimal decision. Athough attention in this section is restricted to statistical inference, the possible use of decision analysis is discussed further in the next section.
An Example
Consider the problem of assessing a particular measure of effectiveness, such as the probability that a certain target will be hit from a certain distance under given conditions. Suppose that the hit rate for a current system under similar conditions is equal to 75 percent. Using some combination of engineering judgment and modeling to assess the impact of improvements in component reliability, assume that it is agreed that an increase of 10 percentage points in the hit rate is technically feasible under the new system design. Thus, one might assign a prior distribution over the true underlying hit rate in which values near 85 percent are most likely. Because we are not certain that the true hit rate is 85 percent, there is dispersion about this value. That is, there is some probability that the value is above 85 percent and some probability that the value is below 85 percent. Figure 1 shows an example of a prior distribution that might be used for this problem. Probability density measures the relative likelihood of different values of the true hit probability. From the figure it can be seen that the hit probability is almost certain to lie between 30 and 100 percent (the density function is practically zero for values below .3). Note that density function is highest for values near .85.
Now suppose a test is performed in which 7 of 10 targets are hit by the new system. Figure 2 shows the posterior probability distribution (solid line) for the hit probability given this new sample. Note that this density function has its peak at a smaller value than the prior density function (dashed line), reflecting the fact that the sample had fewer hits than expected. However, the posterior distribution is centered at a value higher than the observed frequency of 70 percent, reflecting the influence of the prior distribution (the expected value is about .73). The posterior distribution is also less dispersed than the prior distribution because the data have reduced our uncertainty about the hit probability. In general, for small sample sizes the posterior distribution will be similar to the prior distribution; for large sample sizes it will be tightly concentrated around the observed hit frequency; and for intermediate sample sizes it will be moder-
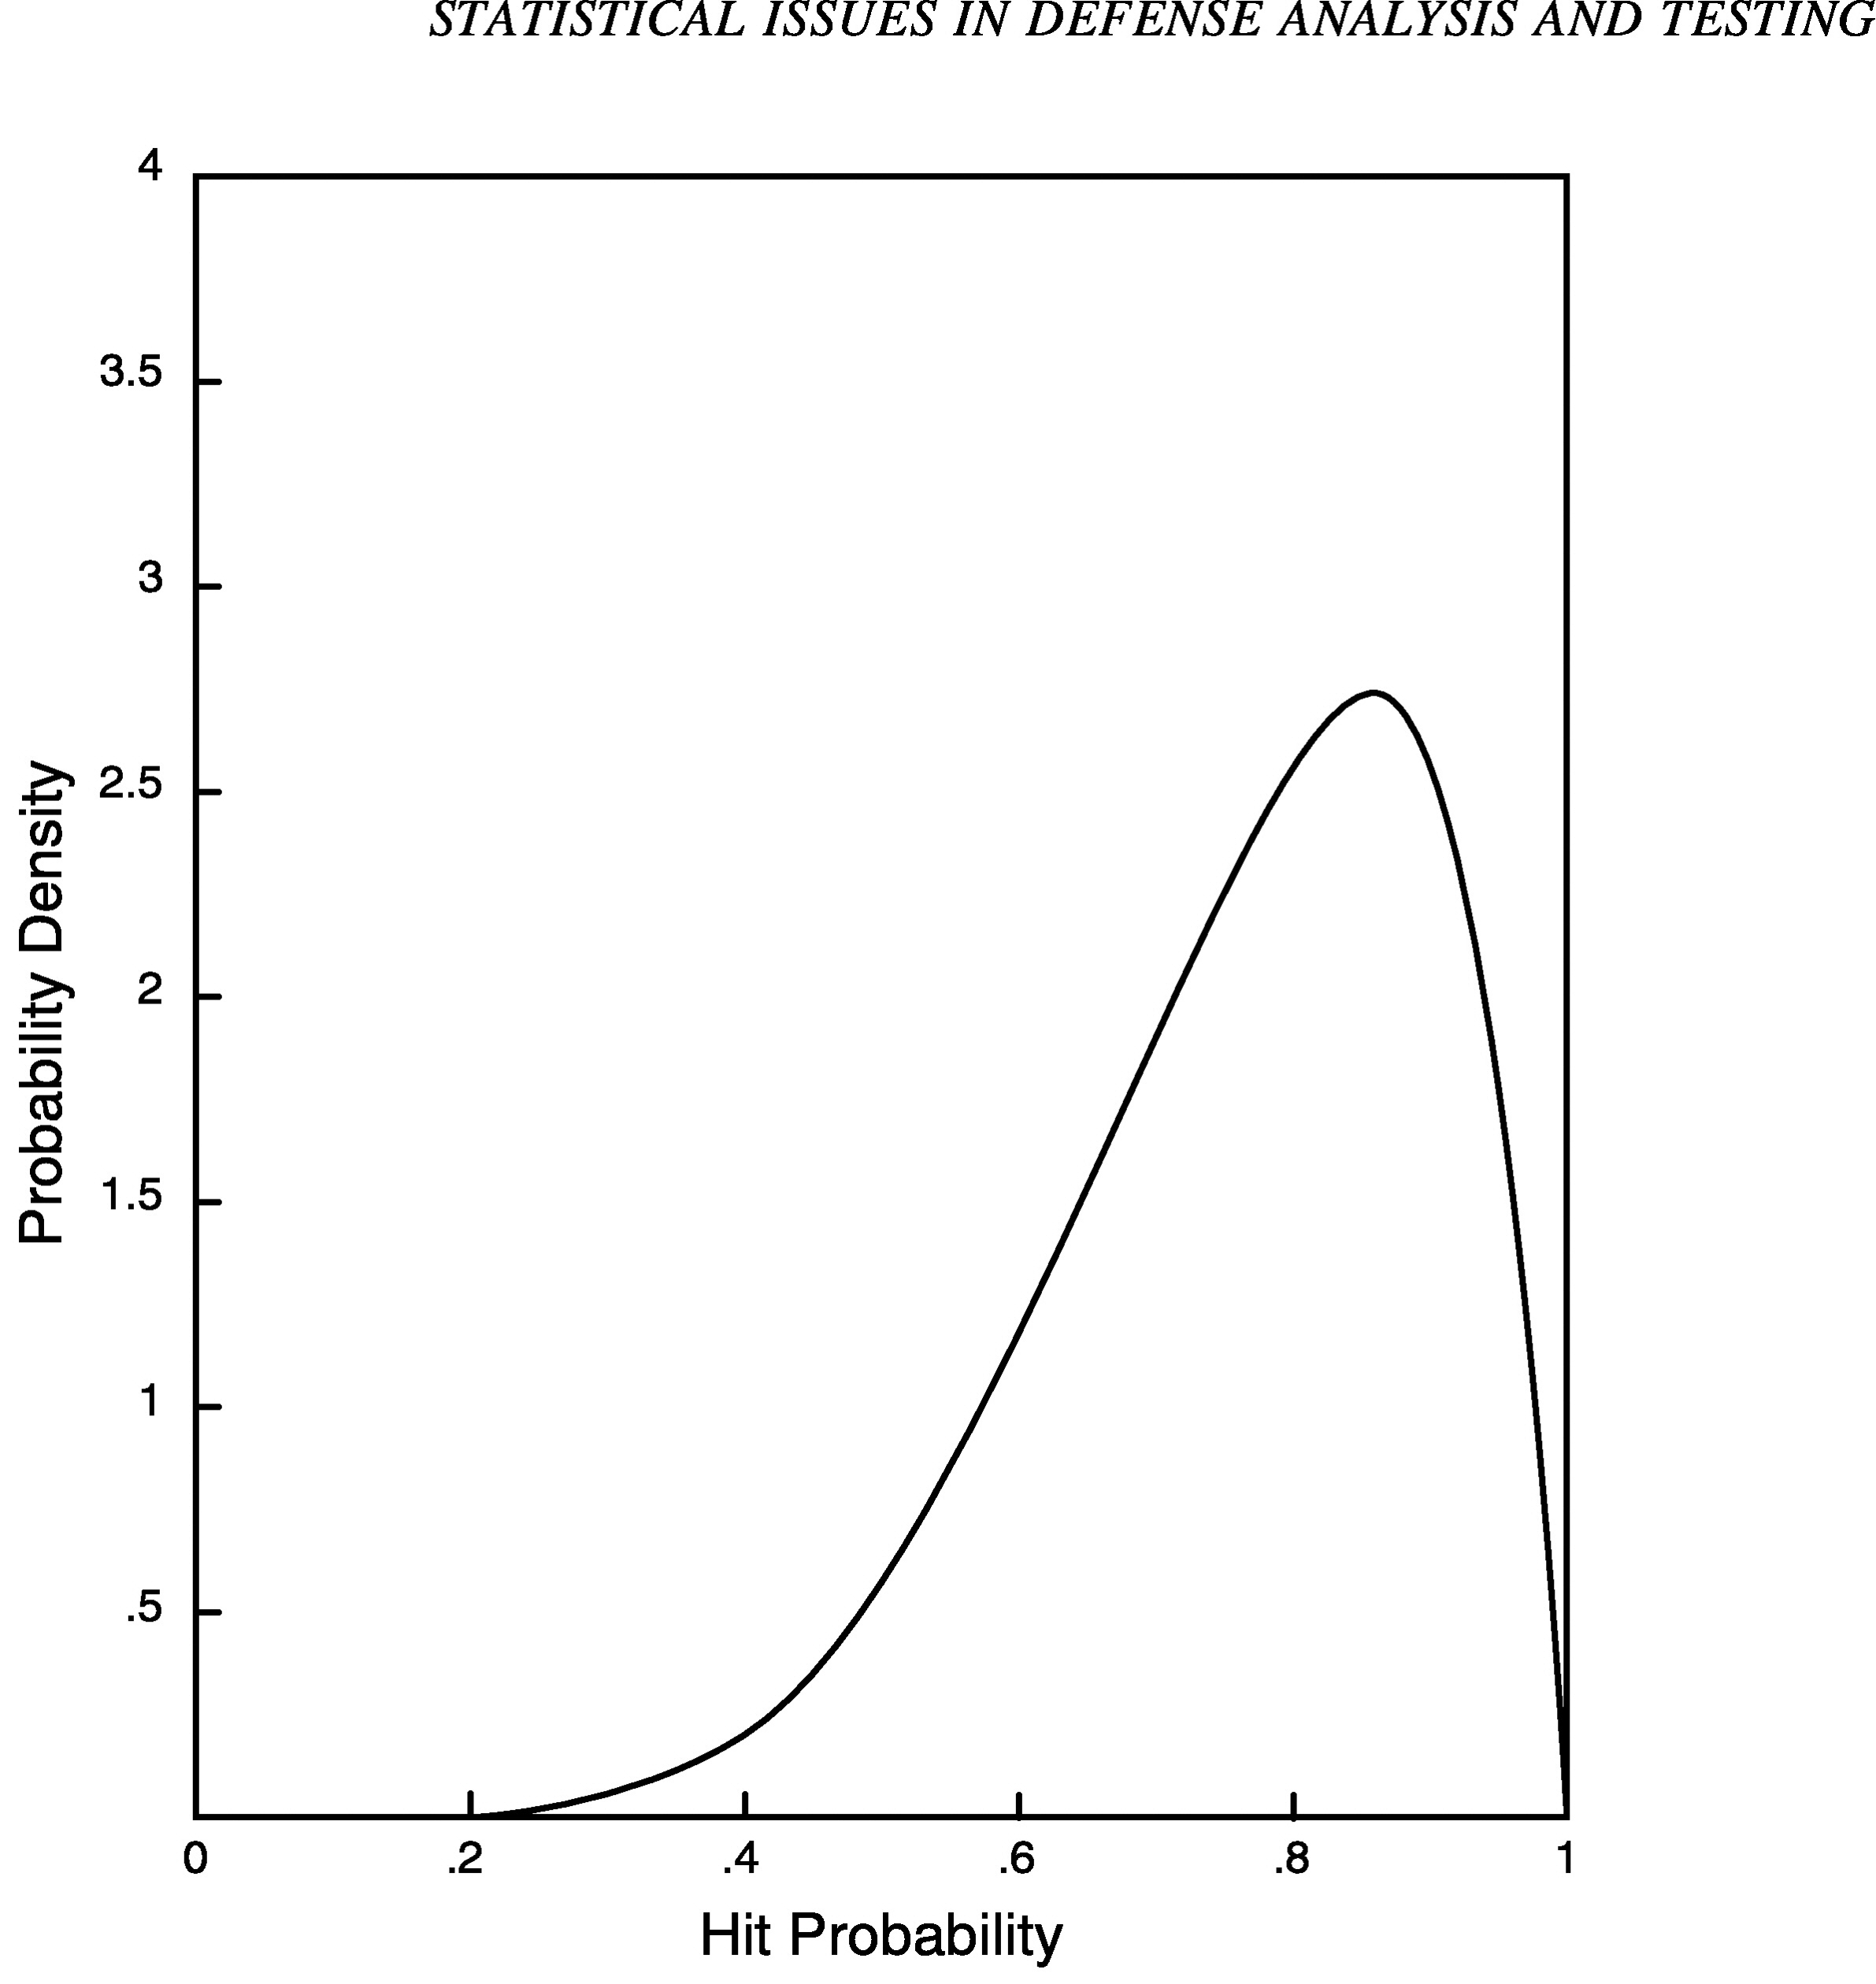
FIGURE 1 Prior distribution for hit probability.
ately concentrated about some value between .85 and the observed frequency.
It is also instructive to compare the posterior distribution in Figure 2 with results that would be obtained without using the engineering judgment described above. For example, suppose that, instead of being modeled by the prior distribution in Figure 1, the hit frequency is taken a priori to be uniformly distributed between zero and one. That is, suppose the prior distribution is a horizontal line, indicating that all values for the hit frequency between zero and one are, in a rough sense, equally likely. (More precisely, the hit frequency has an equal chance of falling in all subintervals of equal length.) Figure 3 presents the corresponding posterior distribution after the new system hits 7 of 10 targets. Note that the distribution (solid line) is centered slightly below .70 (the posterior expected value is .67) and reflects greater uncertainty than the posterior distribution from Figure 2 (dashed line). As illustrated here, incorporating prior information may reduce the amount of uncertainty associated with a testing problem; an impor-
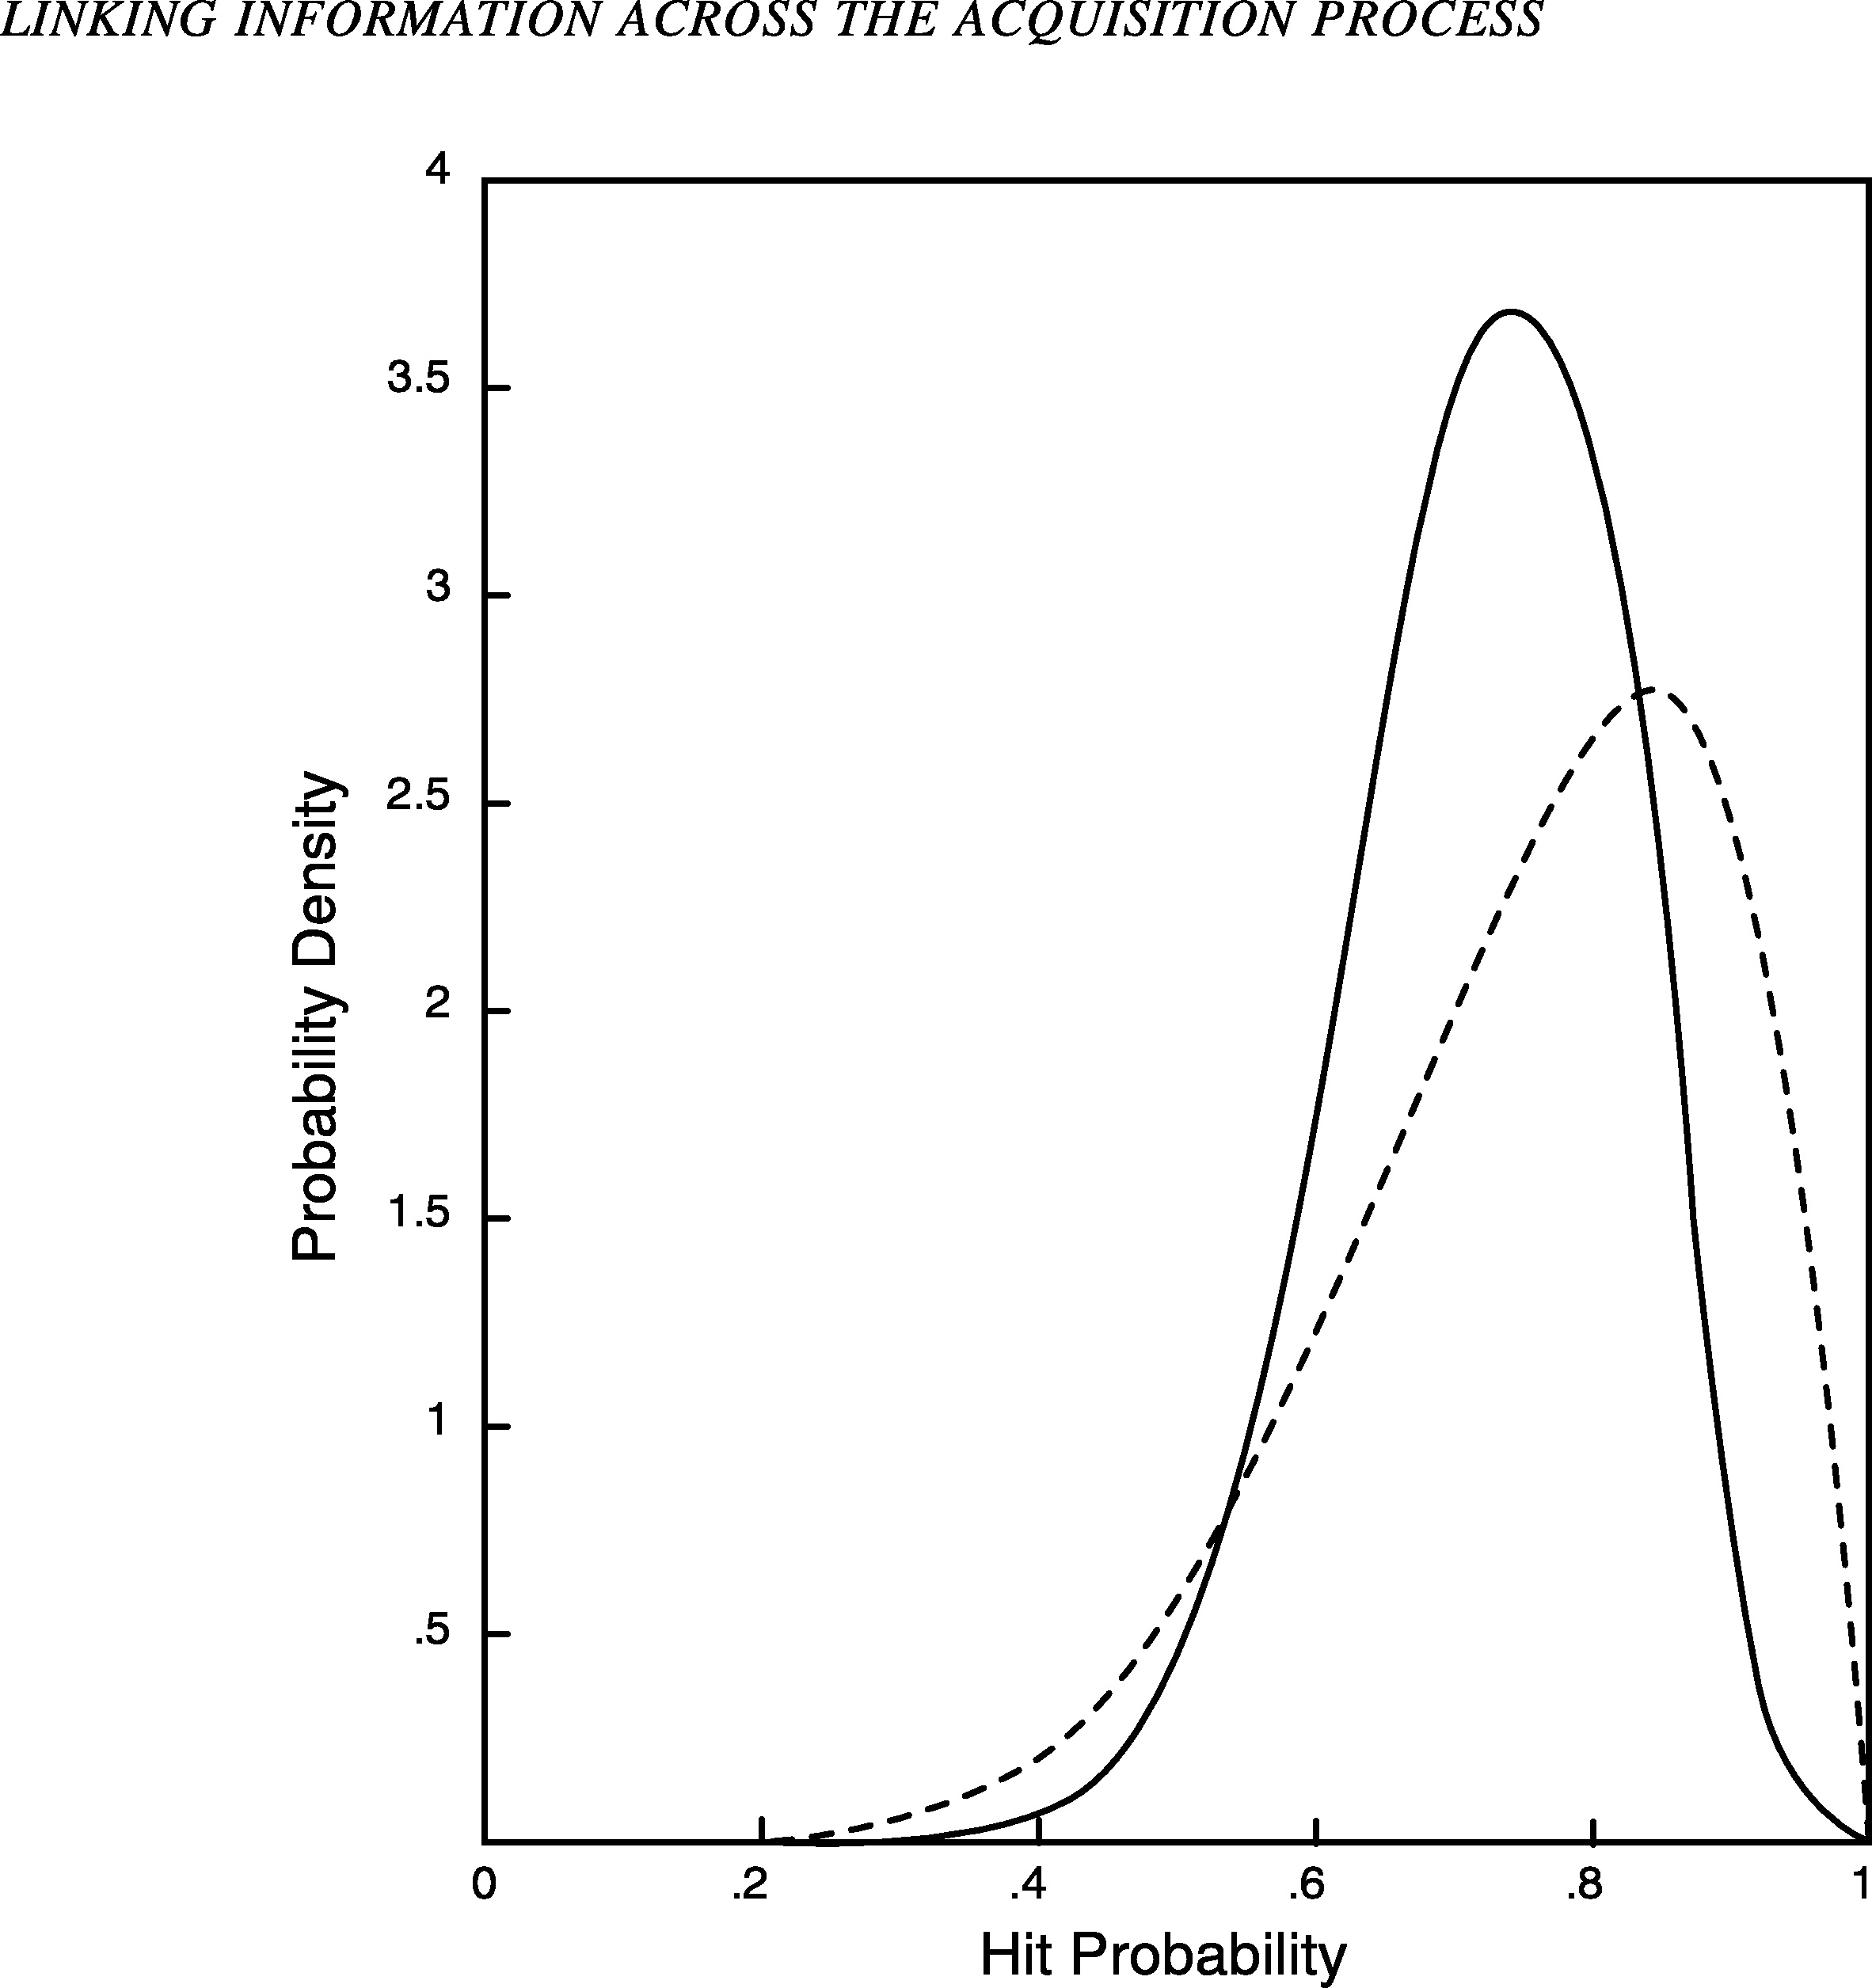
FIGURE 2 Prior and posterior distributions for hit probability.
tant consequence is that smaller test sample sizes may be required to reach definitive conclusions.
The result of this analysis is a posterior distribution that reflects uncertainty about the hit probability after the test is run. When a point estimate is required, it is common to specify a loss function that reflects the relative costs of underestimating or overestimating the hit probability by different amounts. A commonly used loss function is squared error loss (appropriate only when underestimation and overestimation are equally costly). The point estimate that results when squared error loss is used is the posterior expected value of the hit probability (.73 in our case). Many panel participants stressed the need to report some measure of dispersion along with point estimates. In the example, we might tell the decision maker that there is a 90 percent posterior probability that the hit probability lies between 59 and 100 percent. Alternatively, if interest centers on determining whether the new system performs better than the current system, we could give posterior odds of approximately 11 to 9 against the new system performing
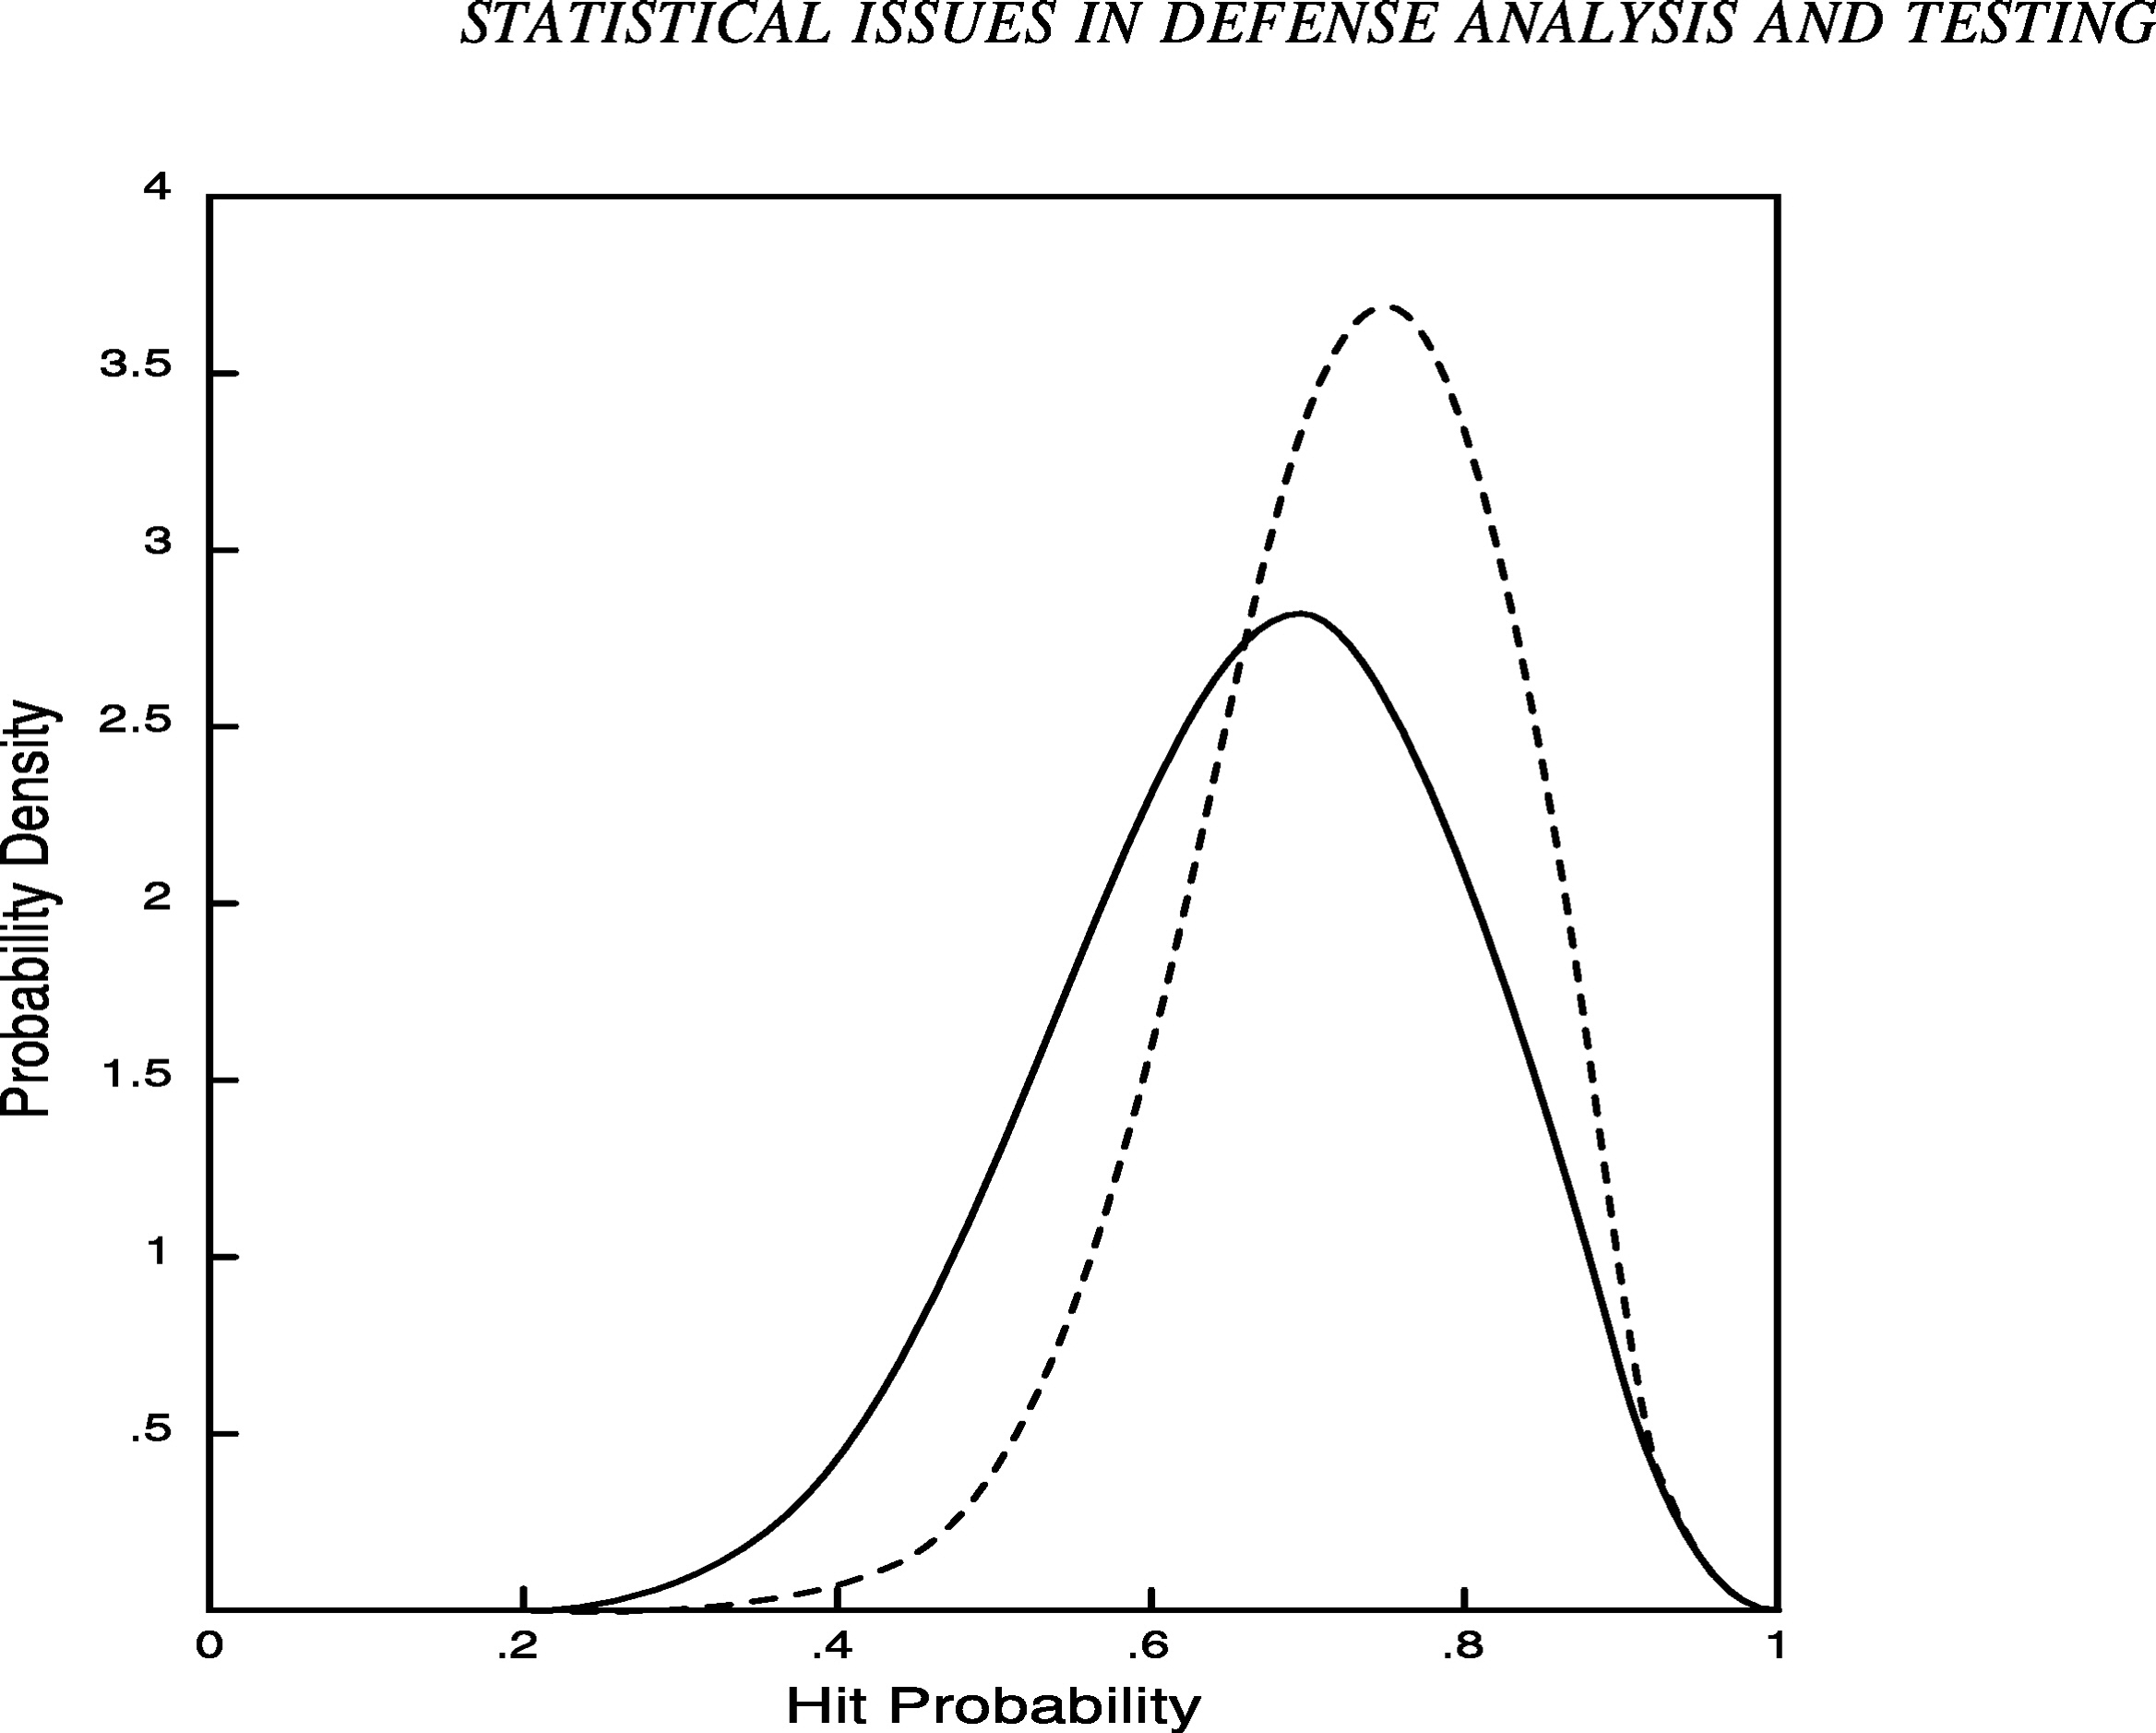
FIGURE 3 Posterior distributions with varying degrees of prior information.
better than the current system. These statements and all other statistical inferences are based on the posterior distribution, which reflects both prior information and the observed test data.
Combining Information
We have described how one might combine engineering judgment, prior knowledge about similar systems, and developmental test results to arrive at an overall assessment of knowledge about a system's performance with respect to some measure of effectiveness. In the same way, one could use the posterior distribution from this analysis as the prior distribution for the analysis of data from operational testing. One could also use engineering judgment to modify the distribution to reflect design changes since the last test and, more important, differences between developmental and operational test conditions. However, an independent test would be required to determine the acceptability of an improved system when the original system was found to be unacceptable. Hierarchical Bayesian methods can be useful for modeling the relationship between similar but not identical experiments. To relate developmental testing, operational testing, and combat performance, one could specify a three-level hierarchy. The lowest level of the hierarchy would be the data from developmental and operational testing. At the next level would be the three hit probabilities from developmental
test, operational test, and combat. At the top level of the hierarchy would be a model relating these three probabilities to each other. Such a model provides a coherent framework for using all available sources of information to project system performance in combat. For a general discussion of statistical methods for combining information, see National Research Council (1992).
Prior Distributions and Their Source
One common objection to the use of Bayesian methods is that the prior distribution is not always based directly on data and therefore is inherently subjective. This does raise difficult issues, such as the charge of bias if a program is canceled due to failure to meet specifications when the system might have passed had a different prior distribution been used. There are a number of responses to this concern. First, there is a subjective element to any analysis, frequentist or Bayesian. For example, operational testing conditions are rarely precisely reflective of combat conditions, so the projection of test results to combat performance is necessarily subjective. There are a number of points in any statistical modeling effort at which engineering judgment is used to select assumptions and to assess the direction and severity of the impact if the assumptions are violated. A carefully documented Bayesian analysis highlights exactly where in the analysis the judgment enters. Whenever possible, of course, subjectively assessed probability distributions should reflect a consensus of expert engineering judgment.
Second, there are a number of accepted methods for assessing and reducing the effect of subjective assumptions. One can perform a sensitivity analysis, in which the prior distribution is varied to assess the effect of a plausible range of prior distributions on conclusions of the analysis. Sensitivity analysis is especially important when there is serious disagreement over the prior distribution. One can also explicitly model uncertainty in the prior distribution by adding another hierarchical level to express uncertainty over the prior distribution. This is one way to implement suggestions given in the earlier sections on sources of variability and communicating uncertainty.
Hierarchical Structures
There are varieties of Bayes and Bayes-like inference. For example, for different situations one might use hierarchical Bayes analysis (Deely and Lindley, 1981). Hierarchical models combine a prior distribution with a structured relationship between various data sources and consequently reduce the number of parameters on which the inference is conditioned. More generally, the concept of a superpopulation can provide a helpful
model structure in which data sources are viewed as a sample of possible sources. A closely related approach is to view the prior distribution as databased; this approach is known as empirical Bayes analysis (Morris, 1983). A good discussion of hierarchical Bayes and empirical Bayes methods can be found in Berger (1985). Gaver and O'Muircheartaigh (1987) apply empirical Bayes methods in assessing the reliability of similar components whose failure histories are modeled using a Poisson process. Finally, there are frequentist approaches, such as variance components and random- and fixed-effects models (e.g., Harville, 1977; Robinson, 1991), which are essentially hierarchical models and lead to similar inferences.
Bayes inference has at least one potential disadvantage, which is that the judgmental element of the prior distribution may have a significant effect on the inference. This may be problematic, because any decision, including the cancellation of a system due to failure to meet specifications, resulting from use of a particular prior distribution would open the process to charges of bias. If this is an issue, any judgment involved should be exercised by an analyst who does not have a stake in the outcome. As a practical matter, however, hierarchical Bayes analyses are frequently indistinguishable from their empirical Bayes counterparts, which retain the hierarchical structure but estimate the prior distribution directly from the data rather than subjectively determining it.
Classical Approaches
Other non-Bayesian (frequentist) approaches retain some of the advantages of Bayes and Bayes-like inference, while avoiding the controversial connotations of the Bayes label. Some possibilities are: (1) testimation— initially testing whether the new design has a higher reliability than the earlier assessment then, depending on the results of the test, either using the new estimate alone or using a combination of the earlier assessment and the current test results; (2) combining different test results to determine whether the new system's performance meets specifications (Fisher's methods for combining p-values might be useful; see Hedges and Olkin, 1985: Ch. 3); and (3) using linear combinations of estimates from various stages by weighting estimates inversely according to their estimated variances. For all these methods, the fact that the different tests are in different environments presents a challenging complication. The field of meta-analysis holds some promise for providing ways to synthesize results from different laboratory and field-testing experiments, although some research would be needed to adapt it to these problems. General references on meta-analysis include Light and Pillemar (1984), Hedges and Olkin (1985), Wachter and Straf (1990), Cook et al. (1992), and National Research Council (1992).
RELIABILITY GROWTH MODELS
Another approach that uses information from earlier stages in evaluating operational tests is reliability growth modeling. In this approach, the incremental increases in reliability over time due to design improvements are modeled to estimate the future performance of a system. This is good engineering and seems naturally adaptable to the acquisition process as it currently operates. There is a military handbook (U.S. Department of Defense, 1981) that discusses reliability growth management from the DoD perspective. Martin Meth and Robert Read (Appendix B) note that reliability growth tests—or, to use their term, “changing configuration tests”—are being used more frequently for complex, single-shot equipment (e.g., missiles) with high unit costs and for highly reliable electronic subsystems that would require operational tests with a fixed configuration to be carried out over a period of several thousand hours.
Beyond current applications in defense testing, further employment of reliability growth methods during developmental and operational testing might involve setting performance targets for systems during an initial reliability growth period. The most promising prototype from this initial period might then be selected for further testing and considered for full development. Clearly, direct testing is continually needed to validate reliability growth models, but expanded use of these models might add important information to the assessment of performance in a dynamic setting.
ACCELERATED LIFE TESTING
Accelerated life testing is intended to provide information and statistical methods for estimating the performance of a system under normal operating conditions from testing conducted under higher than normal stress. Because DoD testing applications often require early decisions, these methods could be usefully applied during both developmental and operational testing. In particular, accelerated testing under extreme environments can serve as a basis for revising reliability estimates when normal operating environments shift during the acquisition process. Meeker and Escobar (1993) review recent research in accelerated life testing.
LEGAL CONSTRAINTS
A potential problem with combining information from previous stages of the acquisition process is that there are legal requirements that the system must be shown to have attained a certain level of reliability. Any new methods of designing and evaluating tests that use information from earlier stages, such as a superior performance of an earlier design in developmental
testing, must be sensitive to the wording of these requirements. According to the law, operational test and evaluation means: “(i) the field test, under realistic combat conditions, of any item of (or key component of) weapons, equipment, or munitions for the purpose of determining the effectiveness and suitability of the weapons, equipment, or munitions for use in combat by typical military users; and (ii) the evaluation of the results of such test” (10 U.S.C. § 138(a)(2)(B)).
Linking information collected in various stages of the acquisition process together has benefits besides assisting in the estimation of costs and performance. Models that are used to help estimate cost and performance can be evaluated and improved through the regular and systematic comparison of estimates based on models that use empirical observations later in the process.
Finally, it is worth mentioning that the present acquisition process often focuses rather early on an individual system. There are often advantages to developing two or three promising ideas in parallel. The advantages include matched-pair testing, resulting in better identification of superior systems, identification of subtle differences in various environments and against various threats, and better estimates of system cost. An obvious disadvantage is the extreme cost of developing more than one prototype. See Rich and Dews (1986) for further discussion of the pros and cons. However, in some situations even greater development costs will be outweighed by the above advantages. When a predecessor system exists, that system should serve as a relatively low-cost control (see the section above on experimental design).


