4
Spacecraft Sources of Operational Radiation Data
4.1 VALUE OF SPACECRAFT MONITORS IN SUPPORT OF ISS CONSTRUCTION
NASA operates a number of spacecraft able to provide space weather information relevant to managing radiation risk during the construction and operation of the International Space Station (ISS). Particularly useful in this regard are spacecraft at the upstream Lagrangian point (L1), the position where the Sun's gravity and Earth's gravity balance to form, curiously enough, a virtual planet around which satellites can orbit in a plane perpendicular to a line connecting the Sun and Earth. This orbital plane is about a half-hour to an hour of solar-wind travel time upwind from Earth, depending on solar wind speed. Consequently, these spacecraft can warn of an impending increase in the radiation level at ISS when a shock impacts the magnetosphere. By continuously measuring the solar wind and the IMF, they detect a CME's bow shock a half hour or more before it reaches Earth and after that the CME itself, and so give data from which to predict whether and by how much the SPE zones will widen. Moreover, they continuously monitor the full, unshielded intensity of the solar energetic particles, which specifies the radiation intensity within the SPE zones.
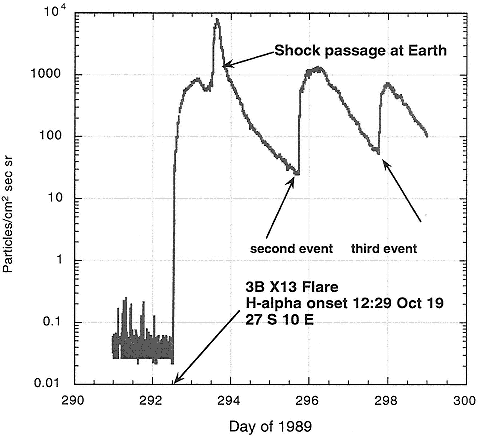
As an example of the radiation profiles that are relevant, Figure 4.1 shows a series of severe SPEs that included the most intense event of solar cycle 22 (that event produced some of the points in the danger area delineated in Figure 2.3). Arrows in Figure 4.1 point to three sudden rises in intensity at the Earth, with the first one being the most intense. These sudden rises were associated with flare explosions on the Sun that released high intensities of X rays; the first flare occurred near the center of the solar disk. Following the initial rise after the first event, there was a second increase that was due to the passage of an interplanetary shock. The shock passage occurred somewhat more than 1 day after the initial flare and was associated with the highest intensities of the entire period. The second and third events in the series did not have similar shock-associated increases in flux.
The data in Figure 4.1 show the essential features of SPEs and illuminate the extent to which L1 spacecraft can warn of increases in radiation level in the polar regions of interest to ISS. Although active regions on the Sun that produce SPEs like the one shown in Figure 4.1 can be observed for a long period (up to months in some cases), until recently the ability to predict when an actual region might erupt into a large flare has been poor. Although a propensity to flare could be noted, each flare onset was essentially a surprise. Recently, however, a characteristic sigmoidal structure in X-ray images has been identified that may be a reliable precursor of CMEs.1 This precursor should allow forecasters to predict the location of a CME (the location of the sigmoid). However, forecasters would not know precisely when, within a period of a few days, the CME would occur.

Figure 4.1 Intensities of protons near Earth during the most intense series of SPEs in solar cycle 22. Particles with the energies shown in this figure (>30 MeV) can penetrate spacecraft hulls .
As mentioned in Section 2.3, solar flares and CMEs contribute energetic particles to SPEs, although the particles they produce have different time profiles, compositions, fluences, and distributions in space. Compared with CME particles, flare particles generally arrive at Earth more promptly, have higher fluxes of relativistic electrons, are confined to a fairly narrow region of space that is magnetically connected to the flare site (on average, Earth is magnetically connected to flare sites at about 60 degrees west solar longitude), and have smaller total fluence. Compared with flare particles, CME particles generally take longer to arrive at Earth, have fewer relativistic electrons, reach higher energies, are spread over a wide area centered on the central meridian of the Sun, and have greater total fluence. Both CMEs and flares can produce their characteristic kind of SPEs in the absence of the other.2
A CME is an injection of solar material into interplanetary space at speeds often in excess of 1,000 km/s (2,000,000 mph). A typical travel time to Earth is about 48 hours. (The CME arrival in Figure 4.1 was atypically fast.) If a CME moves fast enough (supersonically with respect to the solar wind), a shock wave forms ahead of it that energizes particles as it moves through the interplanetary medium. According to one model of shock acceleration, a shock can produce both a long SPE profile, lasting 1 or 2 days, and a shock spike such as that seen in the first SPE in Figure 4.1.3 The severity of a shock-generated SPE depends on the speed of the parent CME and on its launch site on the Sun; the most intense cases are associated with events that occur near the center of the visible disk, as was the case for the event shown in Figure 4.1.
4.2 AN INTERAGENCY FLEET OF SPACECRAFT MONITORS
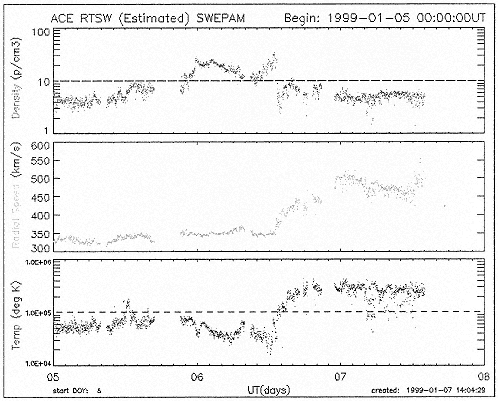
The data on the October 1989 event shown in Figure 4.1 were taken by instruments on the GOES series of spacecraft, which are in geostationary orbit, not at L1. Since then, the International Solar-Terrestrial Physics (ISTP) program has launched a suite of spacecraft, now at L1 and in Earth orbit, that, taken together with others such as Advanced Composition Explorer (ACE), SAMPEX, and Yohkoh, provide an unprecedented opportunity to attempt to predict and monitor any large SPE (see Table 4.1). Plate 2 illustrates this for the January 6-11, 1997, event, during which the Solar and Heliospheric Observatory (SOHO) observed the launching of a CME from the Sun on January 6. As often happens, this CME produced no SPE. The arrival time of the CME was predicted, and on January 10-11, the prediction was confirmed when a very powerful shock passed by the SOHO and WIND spacecraft, both of which were at L1. Thus, SOHO and WIND were able to directly detect the shock about half an hour before it impacted Earth. Currently, upstream monitoring is carried out using real-time data from the ACE spacecraft; a sample of ACE data taken from the Web site is shown in Figure 4.2. Plate 3 shows the correlation between solar wind speed increases observed during this period and radiation belt intensities as measured at about 600 km, somewhat higher than the ISS orbit. Although there were no SPE intensity increases in this case, the impact of the CME on Earth's magnetosphere greatly increased the radiation levels, as shown in the right-hand panel.
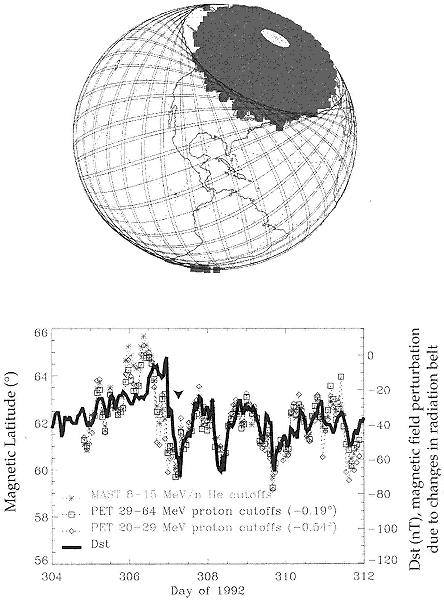
Since Earth's magnetic field shields ISS from solar particle radiation during most of its orbital path, the actual exposure will depend on the orbital location of ISS when radiation levels peak. Figure 4.3 (upper panel) illustrates the geometry of interplanetary particle access to ISS. In the panel, a series of ISS orbital tracks is superposed on a globe. The gray area in the polar regions marks the geographic location of energetic ions observed on SAMPEX during a large SPE (in November 1992). The gray area is offset from the ISS orbit because Earth's magnetic field is offset from the spin axis, and it can be seen that this causes some ISS orbits to pass into the gray zone of particle access, while other orbits miss it entirely. This effect was described quantitatively in Figure 1.5. Since it takes 24 hours for the ISS orbital track to repeat itself over the globe, a warning can be given to ISS many hours in advance if its location above Earth will not take it through the access region for a number of orbits. Of course, if the timing is unfavorable, there might be little or no additional warning time before ISS enters the polar region beyond the hour or so offered by ACE and WIND.
Figure 4.3 (bottom panel) illustrates another complication of ISS penetration into the region of polar cap access, namely that the passage of the CME perturbs the Earth's magnetic field, and this perturbation increases the size of the polar access region for hours at a time. Figure 4.3 shows the access region's boundary as measured on SAMPEX, along with a proxy location determined by a ground-based magnetic activity index (Dst). Note that the directly measured boundary moved before passage of the shock and before the change in the Dst index. Although this case is unusual in that the SPE zone widened before the storm started, it nonetheless suggests that the surest way to accurately determine the location and size of the SPE zones during a large shock event is direct particle measurement by satellites in low Earth polar orbits that cross the boundaries four times per orbit (95 minutes).
Table 4.1 Spacecraft and Data Sources Relevant to ISS Construction and Operation
|
Spacecraft |
Location |
Data Available |
Real-Time Data? |
|
SOHO |
L1 |
CME early warning |
20 h/day |
|
Yohkoh |
Near Earth |
X-ray flare images |
Once per day |
|
ACE |
L1 |
Solar wind, field, and particle data |
~24 h/day |
|
WIND |
Nearer Earth |
Solar wind, field, and particle data |
Flexible |
|
GOES |
Geosynchronous orbit |
Particle data and X-ray flare image |
24 h/day |
|
POES |
Near Earth |
Particle data, including cutoffs |
24 h/day |
|
DMSP |
Near Earth |
Particle data, including cutoffs |
24 h/day |
|
SAMPEX |
Low Earth orbit, high inclination |
Particle data, including cutoffs |
Twice per day |

Figure 4.2 An example of near-real-time data available from the ACE spacecraft. The plot shows data obtained from January 5 to 8, 1999. From top to bottom, the quantities plotted are solar wind density (particles/cm3), solar wind speed (km/s), and solar wind temperature (K). In addition to this information on solar wind, information on the magnetic field and energetic particle intensities is also available. All the real-time data from ACE are processed on board for conversion to scientific units and then telemetered continuously to ground stations worldwide. The data are collected by NOAA's Space Environment Center and made available on the Web.
Table 4.1 lists NASA Sun-Earth Connection, NOAA, and Department of Defense (DOD) spacecraft that provide relevant measurements and their capabilities for delivering data in the near-real-time manner that would be needed if required for ISS construction or operations. ACE, SOHO, GOES, the Defense Meteorology Satellite Program (DMSP), and POES gather a large quantity of near-real-time data; WIND and SAMPEX are more limited, but the amount of coverage could be increased if necessary. Other missions, such as Yohkoh, that indirectly sense the liftoff of CMEs through the brightening in X rays of magnetic arcades could also play a role in identifying candidate sources of SPEs.
4.3 FUTURE SPACECRAFT IN SUPPORT OF ISS OPERATIONS
Several future missions are expected to advance the study and forecasting of space weather. The High Energy Solar Spectroscopic Imager (HESSI) will be launched in mid-2000 to explore the basic physics of particle acceleration and energy release in solar flares by carrying out simultaneous, high-resolution imaging and spectroscopy of solar flares, from 3 keV X rays to 20 MeV gamma rays, with high time resolution. Like Yohkoh, HESSI

Figure 4.3 Top panel: Location of ground track of ISS orbits superposed on a globe along with polar cap areas (shown in gray), where multimega-electron volt solar energetic particles penetrated to low altitudes during an SPE in November 1997. (Courtesy of Leske et al.4) Bottom panel: time variation of the lower boundary of the polar cap measured by SAMPEX during the November 1997 SPE. The arrow marks the time of arrival of an interplanetary shock. The particle cutoff latitude measured on SAMPEX moved from ~66 degrees to ~60 degrees many hours before the arrival of the shock and even before Earth's magnetic field (heavy black line) registered a change.
can give flare warnings. A systematic study of CMEs and their development and effects near Earth is planned for the Solar Terrestrial Relations Observatory (STEREO) mission; however, its projected launch date of 2004 is later than the current schedule for ISS construction. The Inner Magnetospheric Explorer (IMEX) is scheduled for launch in mid-2001, just after the peak of solar cycle 23. Its mission is to study the dynamics of the inner magnetosphere during major geomagnetic storms. It will be the first mission in the inner magnetosphere to contain a full complement of field and particle detectors (especially electric fields) while there is a full-time upstream monitor in the solar wind (the ACE mission). In addition to these NASA missions there will be NOAA/DOD missions in the GOES/POES series that will include a Solar X-ray Imager (SXI).
4.4 SUMMARY AND RECOMMENDATION
A strategically placed fleet of spacecraft is currently taking data that can provide information on the radiation environment of the ISS orbit in real time and in advance of real time. Spacecraft in geostationary and L1 orbits monitor the Sun and its corona in multiple wavelengths and so can diagnose flare potency and warn of oncoming CMEs with considerable skill (see Section A.4). They also monitor SPE fluxes to give direct information on the radiation intensity within SPE zones. L1 spacecraft monitor solar wind and IMF parameters that can be used to predict the size and shape of SPE zones. Spacecraft in relatively low-altitude polar orbits monitor the flux of relativistic electrons in the outer radiation belt, which the ISS orbit transects. The information will provide flight managers with real-time, high-quality radiation-risk parameters. What is needed is a mechanism to channel the relevant information to the Space Radiation Analysis Group at Johnson Space Center.
Recommendation 4: Promptly convene a meeting of pertinent NASA Space Science Enterprise, SRAG, and SEC managers with the principal investigators of satellite instruments. The meeting would (1) consider ways to extend the capabilities of the current spacecraft fleet to provide real-time radiation data for driving models and specifying the ISS radiation environment and (2) formulate an implementation plan for swiftly channeling such data to radiation risk managers at JSC.


