
6
Race, Crime, and Juvenile Justice: The Issue of Racial Disparity
INTRODUCTION
The panel has noted major disparities in the extent of involvement of minority youth, particularly black youth, compared with white youth in the juvenile justice system. The existence of disproportionate racial representation in the juvenile justice system raises questions about fundamental fairness and equality of treatment of these youth by the police, courts, and other personnel connected with the juvenile justice system. Furthermore, what happens to youth in their dealings (or lack of dealings) with the juvenile justice system may have substantial consequences for subsequent development and prospects for the future.
Disproportional confinement of minorities has been recognized as a problem by the federal government. In 1988, Congress amended the Juvenile Justice and Delinquency Prevention Act of 1974 (P.L. 93-415, 42 U.S.C. 5601 et seq.) to require that states participating in the act's formula grants program address disproportionate confinement of minority juveniles in secure facilities. States were required to assess the level of confinement of minority juveniles and to implement strategies to reduce disproportionate minority representation where it was found to exist. In 1991, the Office of Juvenile Justice and Delinquency Prevention created the Disproportionate Minority Confinement initiative to help states comply with the mandate by testing various approaches for addressing the problem. Pilot projects funded by the initiative suggested that attention
should focus on all aspects of the juvenile justice system rather than only on confinement (Devine et al., 1998).
Research and social policy on race, crime, and the administration of justice in the United States are currently marked by a seeming conceptual and methodological impasse. This situation stems from efforts by researchers to explain the persistent overrepresentation of groups of racial and ethnic minorities in the juvenile and adult justice systems. Some researchers and commentators have tended to focus on racially disproportionate offending behavior patterns as the primary cause of such a disparity, whereas others have highlighted the persistence of biases among decision makers in the justice system. The most problematic feature of this “behavior versus justice system ” debate has been the suggestion that these can be viewed as alternatives, rather than as processes that feed into one another. Furthermore, much of the debate has been carried out with an exceedingly narrow focus that fails to take account of the role that social injustice has played in the production of crime (Clarke, 1998; Lane, 1986; McCord and Ensminger, in press).
Both selective inattention (ignoring the other point of view) and the either-or approach (mutually exclusive points of view), which have characterized academic and public discourse on race, crime and justice, are problematic in several respects. These explanations not only pose a false dichotomy, but they also oversimplify what is a very complex set of social phenomena. These approaches also detract from increasingly promising efforts by scholars and others to develop and examine more inclusive and complex models that may more fully account for the multiple factors that contribute to racial and ethnic disproportionality in the nation's justice system.
Key Terms
There is considerable confusion and variation in the meaning of terms used to examine and describe the racial disparity in the juvenile justice system. This confusion has contributed to divergent findings regarding the presence or absence of racial bias in the justice system and the tendency to attribute all racial differences in system outcomes to prejudice and bigotry (Walker et al., 1996). Therefore, it is important at the outset of this discussion to define the terms we will use. In this report, we use the terms disparity and disproportionality to refer to situations in which minority group members are either under- or overrepresented relative to their proportion in the general population. There is no judgment about the cause of the observed disparity; it may stem from differences in actual behavior, or from decision making within the system, including legitimate and extralegal factors, or both.
“Race” has been defined as phenotypic differences in skin color, hair, texture, and other physical attributes that have historically been perceived by some as the surface manifestations or markers of deeper, underlying differences in intelligence, temperament, physical prowess, sexuality, and propensity toward crime and violence. However, biologists, geneticists, and physical anthropologists, among others, have reached the conclusion that race is a biologically meaningless category, and not a scientific concept based on discernible biological differences among the various groupings commonly referred to as races today. In addition, cultural and social anthropologists, sociologists, and behavioral scientists have noted that the attributes often associated with specific racial categories are based frequently on stereotype rather than on evidence of actual differences across groups. Moreover, scientific research often reports as much behavioral and cultural difference within races as between them. Yet there continues to be popular acceptance of race as a social construct, and an important organizing principle of individual identity, collective consciousness, and institutional life (Bobo, in press).
The term racial disparity, rather than ethnic disparity, is used in this chapter since most of the evidence available does not permit an examination of disproportionality by various ethnic groups, nor does the literature appropriately distinguish ethnicity within the racially designated groups. Using the term racial disparity in this chapter is largely a reflection of the kind of data available. Most official arrest data, as well as victimization and self-report surveys, do not permit an examination of disproportionality by the numerous ethnic groups found in the United States today. Classification as Hispanic permits some comparisons between the various Hispanic ethnic groups and those who are not Hispanic. Thus, whether juvenile offending differs among the various ethnic and nationality subgroups found among European, Asian, and African Americans cannot be determined given the data available. Crime and delinquency data on the race of juvenile offenders focuses primarily on blacks and whites. Official arrest statistics for Hispanic, Asian, and American Indian youth are often unavailable or suffer from problems in assignment of youth to these ethnic and racial groups using vague or ambiguous criteria. For these reasons, this chapter focuses on the one racial minority group for whom we have reasonably reliable data—blacks. The chapter examines the extent to which black youth are disproportionately involved in the juvenile justice system compared with white youth. Whenever possible, attention is called to the situation for minority youth of other racial and ethnic backgrounds.
Because the research reviewed in this chapter is largely focused on potential sources of bias in the juvenile justice system (as opposed to other institutions in American society), we use the term discrimination to
refer to those situations in which evidence suggests that extralegal or illegitimate factors are the cause of disparate justice system outcomes.
Chapter Organization
Detailed information on patterns and trends in offending has been described earlier in this volume. This chapter is designed to bring together divergent streams of research and scholarly discourse in an attempt to highlight some key issues and to move the field ahead by suggesting useful and potentially useful ways of thinking about race, ethnicity, juvenile crime, and the juvenile justice system in the future. The chapter is divided into three major parts. The first part of this chapter briefly reviews the extent of the racial disparity in the juvenile justice system. The chapter then considers the evidence for racial disparity in the delinquent behavior of youth as well as evidence of bias in the juvenile justice system. The second part of the chapter introduces the concept of compound risk and illustrates how small differences in the treatment of juveniles at one point in the process may have enduring and powerful effects later on, as the youth progresses or does not progress through the juvenile justice system. The third part of the chapter describes promising directions for future research that may prove useful and productive to the field. In the last part of the chapter are the panel's specific recommendations for research and policy.
RACIAL DISPARITY IN THE JUVENILE JUSTICE SYSTEM
Although black youth represented approximately 15 percent of the U.S. population ages 10-17 in 1997, they represented 26 percent of all juvenile arrests, 30 percent of delinquency referrals to juvenile court, 45 percent of preadjudication decisions, 33 percent of petitioned delinquency cases, 46 percent of cases judicially waived to adult criminal court, and 40 percent of juveniles in public long-term institutions (see Figure 6-1). Thus, the proportion of blacks under the supervision of the juvenile or adult criminal justice systems is more than double their proportion in the general population.
In a report produced for the Office of Juvenile Justice and Delinquency Prevention, Hamparian, Leiber, and colleagues (1997) described the extent of disproportionate minority confinement of juveniles in state facilities. The report focused on six decision points (arrest, secure detention, confinement in secure juvenile correctional facilities, in adult jails, and in adult lockups, and transfer to criminal court), using state data from the late 1980s and early 1990s. Table 6-1 presents findings on the over-
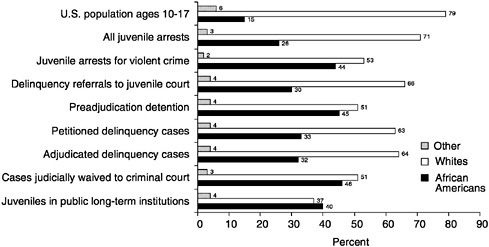
FIGURE 6-1 Involvement of juveniles at various stages of the juvenile justice system, by race, 1996/1997. Note: Delinquency = acts committed by a juvenile that if committed by an adult could result in criminal prosecution. Delinquency referrals = includes not only arrests, but also all other sources of referral to juvenile court, such as social service agencies, schools, and parents. Petitioned = cases sent for formal processing in juvenile court; formal processing includes adjudicatory hearings and waiver hearings. Source: Snyder and Sickmund (1999); Stahl et al. (1999).
representation of minority youth, based on data from the Hamparian et al. (1997) report.1
Hamparian et al. (1997) created an index score, which represents the ratio of the number of youth involved at that decision point divided by the state's total juvenile population ages 10-17.2 An index number of 1.00 means that minorities are represented in the juvenile or criminal justice system in the same proportion as they are represented in the population. An index number larger than 1.0 indicates that minority youth are overrepresented; for example, an index number of 2.0 means that minority youth are represented at two times their representation in the juvenile population. The greater the index number, the larger the extent of overrepresentation.
|
1 |
The panel expresses appreciation to Amie Schuck and Jorge Chavez of The University at Albany for their assistance with these analyses. |
|
2 |
It should be noted that for some states, information was not available for the entire state. In these cases, the at-risk population was calculated for the designated area. |
TABLE 6-1 Overrepresentation of Minorities
|
Percent Minority Population |
Arrest |
Secure Detention |
Secure Corrections |
Adult Jail |
Adult Lockup |
Transfer Criminal Court |
Probation |
|
|
All minority youtha |
||||||||
|
Mean index scoreb |
23.2 |
1.7 |
2.9 |
2.8 |
2.0 |
2.2 |
2.4 |
1.8 |
|
Median index score |
17.2 |
1.7 |
2.6 |
2.4 |
1.7 |
1.3 |
1.9 |
1.8 |
|
N |
46 |
37 |
44 |
40 |
22 |
10 |
22 |
5 |
|
Black youth |
||||||||
|
Mean index score |
15.4 |
2.2 |
3.2 |
3.3 |
1.8 |
2.6 |
3.1 |
2.8 |
|
Median index score |
9.2 |
2.2 |
3.2 |
3.2 |
1.9 |
1.8 |
1.9 |
2.4 |
|
N |
40 |
30 |
32 |
33 |
16 |
11 |
15 |
8 |
|
Note: Some of the numbers in this table differ slightly from those reported in Hamparian and Leiber (1997) for unknown reasons. a Minority youth include black, Hispanic, American Indian, and Asian or Pacific Islander. b Index score = ratio of number of youth involved at that decision point divided by the at-risk population. Source: Based on information from Hamparian et al. (1997) |
||||||||
Table 6-1 clearly reveals that minority youth are overrepresented at all stages of the juvenile justice system included in this analysis. This table also shows that the disparity for black youth is higher, in all cases except one, than for all minorities. This suggests that it is the disparity for blacks that is driving the disproportionate minority representation. This also suggest that some other minorities are underrepresented in the juvenile justice system. Using these data, the smallest index number is 1.6 for arrests of all minority juveniles across the 37 states reporting data on arrests. For black youth, the index for arrests across the 30 states that reported separately for blacks is 2.2. The small number of states that reported data separately for Hispanics, American Indian, and Asian/ Pacific Islanders made it impossible to compare their indices to those for blacks. However, the data suggest that Hispanic and American Indian juveniles experience overrepresentation in the juvenile and adult justice systems, whereas Asian and Pacific Islander juveniles tend to be underrepresented.
The above information is presented in an attempt to make concrete the extent of disproportionate representation of racial minorities; however, there are several limitations to these findings that need to be acknowledged. One of the difficulties involved in trying to ascertain the extent of disproportionality in the juvenile justice system is that laws and practices vary by state, and this makes state-by-state comparisons problematic. Thus, there are no standard reporting mechanisms that are comparable across states, and analyses that aggregate across jurisdictions may mask important information. The data used in the analysis by Hamparian and colleagues vary for the time period in which they were collected. Information from some of the states is incomplete. Problems with assigning race or ethnicity are reflected in these statistics as well.
This brief review, along with evidence cited in other chapters of this volume, strongly suggests that there is racial disparity at various points in the juvenile justice system and in various jurisdictions across the nation. The focus of the rest of this chapter is not to further document disparity, since the evidence appears fairly clear, despite the limitations of existing data. Some of the nation's minority juveniles, most notably blacks, experience higher rates of arrest and further justice system involvement than do whites. The remainder of this chapter examines the research findings that may prove helpful for efforts to better interpret and understand these disparities and identify areas in which research or action is most urgently needed. Earlier in the chapter, contrasting explanations of disproportionality were raised. The first—attributing the disparity to the behavior of the youth—suggests that the disparity is an accurate or reasonable reflection of the extent of involvement in delinquent and criminal behavior by these youth. The second perspective—attributing the disparity to
the justice system—emphasizes the persistent effect of bias among decision makers in the juvenile justice system. We first consider the evidence for race differences in delinquent behavior and then consider evidence of bias in the juvenile justice system.
Behavior-Based Explanations
To explore the possibility that the racial disparity observed in rates of justice system involvement arises as a result of racial differences in criminal conduct, the possibility of error in crime data must first be entertained. Errors could lead to the appearance of racial disparity that, on closer examination, can be shown not to exist. Then, to the extent that racial disparity can be shown to exist, its causes must be explored. In the field of juvenile and criminal justice research, there are several measures that have been used to determine the extent of criminal behavior. In Chapter 2, the issues of measuring delinquency and crime were discussed and it was pointed out that none of the measures is without problems. There is fairly good agreement that the best approach to measuring crime is to use multiple sources of information (Farrington, 1998; Loeber et al., 1998b; National Research Council, 1993). The use of multiple sources of information may be especially rewarding for efforts to understand the sources and causes of racial and ethnic disparity.
The three most common approaches to measuring delinquency and crime —self-report surveys, victimization surveys, and official arrest and conviction statistics—all indicate high rates of serious offending among young blacks. While studies using differing methods and sources of data are not in agreement on the magnitude of differences in rates of involvement in youth crime across racial, ethnic, and social class categories, most research does show important differences, particularly with regard to race.
Figure 6-1 reveals the substantial overrepresentation of minority youth in official arrest data, showing major discrepancies between black and white youth. These differences are on the order of magnitude of 1.8:1. The racial disparity in offending behavior is lower when the measure used as an index of offending is based on self-reports. For example, using data from the National Youth Survey, Elliott (1994b) found that, at age 17, 36 percent of black males, 25 percent of white males, 18 percent of black females, and 10 percent of white females reported committing a serious violent offense (robbery, rape, or aggravated assault involving injury or a weapon) in the previous year. Thus, self-report data from this large nationally representative sample reveals differences in criminal behavior between black and white juveniles. It should be noted, however, that the discrepancies were not nearly as large as the differential revealed by offi-
cial arrest data (1.5:1 for self-report compared to 4:1 for arrest —Elliott, 1999).
Greenfeld (1999) presented results to the panel from an analysis of data from the National Crime Victimization Survey (NCVS), the third source of criminal behavior information, for the years 1993 to 1997 (annual average) for robbery and aggravated assault for juvenile offenders. The NCVS, conducted annually by the Bureau of Justice Statistics since 1973, asks victims about their victimization experiences and about characteristics of the offender(s) who victimized them, including race. Information from the NCVS is helpful for crimes involving a personal confrontation like robbery, assault, or rape, but it is not very useful for property crimes for which there was no direct confrontation. Juvenile offenders are defined as those whom victims indicated they believed to have been less than 18 years old.
Table 6-2 shows the race distribution of juvenile offenses for robbery and aggravated assault as reported by victims (NCVS) and in arrests from the Uniform Crime Reports (UCR) of the Federal Bureau of Investigation. Several points are worth noting. First, in both sources of information, black juveniles are overrepresented for these two crime types, compared with their proportion in the general population. Second, in both data sources, a higher proportion of white youth are reported for aggravated
TABLE 6-2 Race Distribution of Juvenile Offenses for Robbery and Aggravated Assault as Reported by Victims (NCVS) and in Arrests (UCR), Annual Average 1993-1997
|
Total |
Robbery |
Aggravated Assault |
|
|
As reported by victims (NCVS) a |
|||
|
Annual average number |
949,992 |
362,498 |
587,494 |
|
% white |
42 |
27 |
51 |
|
% black |
41 |
58 |
31 |
|
% other |
14 |
12 |
15 |
|
Juvenile arrestees (UCR) |
|||
|
Annual average number |
129,997 |
49,858 |
80,139 |
|
% white |
50 |
38 |
57 |
|
% black |
48 |
60 |
41 |
|
% other |
2 |
2 |
2 |
|
Note: NCVS = National Crime Victimization Survey. UCR = Uniform Crime Reports a Juvenile offenders are those for whom victims indicated that they believed the offender to have been less than 18 years old. |
|||
assault (51 percent for NCVS and 57 percent for UCR), whereas a higher proportion of black youth are reported for robbery offenses (58 percent for NCVS and 60 percent for UCR). Third, one observes an important difference in the two sources of information in the proportion of youth in the “other” race category. In the NCVS, the proportion in the other race (e.g., American Indian, Asian) category ranges from 12 to 15 percent. In contrast, in the UCR, this percentage is only 2 percent. This may reflect the tendency of the police to categorize persons as black or white, because of their record-keeping system. Thus, it is possible that some of the respondents categorized as other in the NCVS data are classified as black in the UCR, inflating the rates for black juveniles.
Comparing the findings from these two important and different data sources does not answer the question about whether police arrest black youth inappropriately or excessively. This comparison does, however, reveal the complexity of trying to disentangle juvenile crime data by race and the urgent need for more focused examination of these issues.
In a further analysis, Greenfeld (1999) presented the results of calculations of juvenile court data based on rates in 17 states3 in 1994. From that analysis, Greenfeld concluded that black and white juveniles who commit robbery have nearly the same likelihood of being arrested, convicted, and punished with confinement. In contrast, Greenfeld found that for aggravated assault, black juveniles have a one-third higher likelihood of the offense being reported to the police (the rate was 52 per 100 offenders for black youth compared with 39 per 100 for white youth), a 50 percent higher rate of being referred to juvenile courts (rates for black youth were 22 per 100 compared with 15 per 100 for white youth), and a 60 percent higher rate of getting petitioned (rate of 16 per 100 for black youth compared with 10 per 100 for white youth), and a 50 percent greater likelihood of receiving institutional placement (3 per 100 for black youth compared with 2 per 100 for white youth).
This brief summary of crime rates indicates that black juveniles are overrepresented in some types of crimes. The question is why should black juveniles be more likely to engage in criminal behavior than whites? Such overrepresentation may be at least partially explained by considering how exposure to risk factors affects the probability of engaging in criminal behavior. The argument has been made that more minority children, and black children in particular, are subject to risk factors associated with crime and that these factors explain the disparity. For example,
|
3 |
Alabama, Arizona, California, Florida, Hawaii, Maryland, Mississippi, Montana, New Jersey, North Dakota, Ohio, Pennsylvania, South Dakota, Tennessee, Utah, Virginia, West Virginia. Aggravated data are for 15 states; North Dakota and Tennessee did not report aggravated assault data. |
there is ample evidence that poverty is a risk factor for delinquency. Given that many minority children are poor, then the disparity would be expected because of the poverty, not the minority status of the youth. To what extent does this explanation of the racial disparity in delinquent behavior receive support?
Growing Up in a Context of Risk
Throughout the history of the nation's juvenile justice system, substandard living conditions have been associated with an elevated risk of involvement by youth in antisocial conduct. Differential rates of poverty and the social conditions associated with it may be one of the major contributors to the levels of racial disparity seen in the juvenile justice system.
Minority children and adolescents are more likely than whites to be poor and to live in unfavorable environments. Figure 6-2 shows the extent to which black, Hispanic, and white children are likely to grow up in a context of risk. These data reflect the status of children in 1990 and reveal very clearly that black children are at substantially higher risk for factors associated with delinquency (see Chapter 3) and factors less likely to lead to healthy development. For example, in 1990, 40 percent of blacks under age 18 lived below poverty levels, compared with 12 percent of white children. As Figure 6-2 indicates, black children are also more likely to live in poor and very poor neighborhoods. Black children have higher rates of infant mortality, low birthweight, and exposure to lead than white or Hispanic children, and they are less likely to have had mothers who received early prenatal care. Compared with white children, black children are less likely to grow up in households in which one resident parent is fully employed.
In sum, from the early days of childhood, black juveniles have more experiences with poor health care and health conditions and with poor economic conditions, and they are more likely to live in segregated, isolated neighborhoods with concentrated poverty than are white juveniles. Concentrated disadvantages in poor neighborhoods, with low mobility and little racial heterogeneity, have been found to be strongly correlated with assault and burglary rates as measured through calls to police (Warner and Pierce, 1993). They have been found to related to high rates of juvenile delinquency and crime as measured by police reports from the 1950s to the 1970s in Racine, Wisconsin (Shannon, 1986). They have been found across the nation in studies of victimization as well (Sampson, 1986).
Data on Hispanic children indicate that they, too, grow up in environments different from and less advantaged than white children. While the
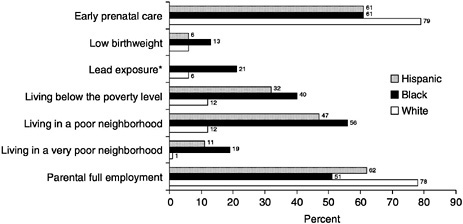
FIGURE 6-2 Child risk indicators by race. Notes: Early prenatal care = 1990 percentage of women in the United States receiving prenatal care in the first trimester; Low birthweight = 1990 percentage of all low-birthweight infants born in the United States by mother's race; Lead exposure = 1988-1991 percentage of children 1-5 years old in the United States with blood lead levels greater than or equal to 10 micrograms per deciliter (*data unavailable for Hispanic population); Living below the poverty level = 1989 percentage of children in the United States under age 18 living below the poverty level; Living in a poor neighborhood = 1990 percentage of children in the United States living in neighborhoods where 20 percent or more of the persons live in families below the poverty level; Living in very poor neighborhoods = 1990 percentage of children in the United States living in neighborhoods where 40 percent or more of the persons live in families below the poverty level; Parental full employment = 1989 percentage of children in the United States with at least one fully employed (full time, full year) resident parent. Source: U.S. Department of Health and Human Services (1998).
same proportion of black and Hispanic women receive prenatal health care (61 percent) (see Figure 6-2), the percentage of low-birthweight babies born to Hispanic women is half that of black women (6 and 13 percent respectively) and the same as white women. Economic risk indicators also reflect differences between whites, Hispanics and blacks. A total of 32 percent of Hispanic children live below the poverty level, compared with 40 percent of black children and 12 percent of white children. Hispanic children are also more likely to live in poor (47 percent) and very poor neighborhoods (11 percent) than whites (12 percent and 1 percent, respectively). Differences also exist in the proportion of families with at least one parent employed on a full-time basis; 78 percent of white children live in such households, as do 62 percent of Hispanic children and 51 percent of black children.
Black and Hispanic children remain at greater risk than white children in many ways. Data from 1960 to 1996 on the percentage of children living below the poverty level show very little change in the proportion of white, Hispanic, and black children living in poverty conditions. In 1960, 20 percent of white children lived below the poverty level, 4 percent more than in 1996, with only slight variations in the intervening years (low of 11 percent in 1970 and a high of 17 percent in 1992 and 1993). The proportion of black children living below the poverty level, although much higher than the proportion of white children, was similarly stable. In 1970, 42 percent of black children lived below the poverty level; in 1996 the percentage was 40 percent. Over the 26-year period for which data are available for blacks, the percentage of children living below the poverty level never dropped below 40 percent, varying 2 to 6 percentage points up or down during these years. Poverty figures showed greater variation among Hispanic children. Between 1980 and 1996, the percentage of Hispanic children living below the poverty level has ranged from 33 percent in 1980 to 41 percent in 1994. These figures reinforce the argument that minority and majority families live and grow up in different social contexts and experience different levels of risk.
There is increasing evidence that community-level factors are important in understanding the etiology of juvenile offending and violence. Community-based crime statistics reveal high correlations with joblessness, household disruption, housing density, infant deaths, and poverty (Sampson, 1987,1992). Where a family lives affects the nature of opportunities available for its children and adults. In some communities, public transportation permits easy travel for those who do not own automobiles, allowing residents to take advantage of opportunities for employment and entertainment outside the neighborhood. In communities that lack these opportunities and resources, street corner gatherings offer possibilities for illegal activities. Neighborhoods can also influence children's behavior by providing examples of socially acceptable behaviors and actions. For example, gang activities vary by community (Curry and Spergel, 1988; Horowitz, 1987).
There is no other racial or ethnic group in the United States of comparable size whose members are nearly as likely to grow up in neighborhoods of concentrated urban poverty as are blacks (Sampson, 1987; Wilson, 1987). While there are more poor white than black families in absolute number, poor white families are less likely to live in areas where most of their neighbors are also poor (Chin, 1996; Moore, 1978, 1991; Padilla, 1992; Pinderhughes, 1997; Sullivan, 1989; Vigil, 1988; Vigil and Yun, 1990).
In an examination of long-term trends in the segregation of blacks and recent trends in the segregation of blacks, Hispanics, and Asians,
Massey has suggested that blacks are unique among groups in showing very high levels of segregation and isolation (Massey, 2000:1):
As of 1990, the degree of segregation was so severe, and occurred on so many dimensions simultaneously, that it was called “hypersegregation. ” This pattern of extreme segregation is unique to African Americans and is unrelated to their economic status and unexplained by their housing preferences. . . . High levels of African American segregation have interacted with recent shifts in the income distribution and class segregation to produce unusually high concentrations of poverty among African Americans. The spatial isolation of poor African Americans has, in turn, elevated the risks of educational failure, joblessness, unwed parenthood, crime, and mortality.
Effects of deleterious neighborhoods have been studied in relation to both immigrants and blacks (e.g., Shaw and McKay, 1969). Recent research has focused on ethnographic studies of youthful gang members and drug dealers (Bourgois, 1995), although the link between drug use and minority status has a long history in the United States (e.g., Helmer, 1975).
Spatial isolation has been a consequence, in part, of social policies. Taxes promoted an exodus of jobs from the cities, where impoverished blacks lived in public housing that was restricted by ordinances to locations removed from job opportunities. Racial discrimination in housing, enforced by restrictive covenants and threats of violence, set a pattern that left blacks more clearly segregated than other minorities (Jackson, 1985; McCord, 1997c; Robinson, 1993; Sampson and Lauritsen, 1997; Wade, 1972). The resulting disparities may explain at least part of the differential exposure to risks by black youth. The next section examines attempts to consider the influence of exposure to risk factors on rates of violence.
Examining Risk Factors to Account For Racial Disparity
There is scant research that examines the extent to which risk factors explain racial disparity. In one very recent investigation, Farrington and colleagues (in press) used data from the Pittsburgh Youth Study, a prospective longitudinal survey of the development of offending and antisocial behavior in three samples, totaling about 1,500 Pittsburgh boys (for description of Pittsburgh Youth Study, see Loeber et al., 1998a). This analysis is based on the middle sample of boys, who were about age 10 when they were first assessed and screened for inclusion in the study. The first follow-up was six months later, and during this assessment information concerning a large number of explanatory variables was collected. They were then followed up in court records for 5.8 years up to a median of age 16.4. Farrington et al. (in press) used combined reports of violence from mothers, boys, and teachers (rather than self-reports alone),
defining violence as whether the boy had (a) attacked someone with the intention of seriously hurting or killing them (labeled aggravated assault), (b) used force to get money or possessions from someone (labeled robbery), or (c) hurt or forced someone to have sex (labeled forcible rape). They also collected information regarding petitions to the juvenile court for index violence up to 1994, when the boys were about 16 years of age.
Strong predictors of a record of violence included poverty and one-parent families, young maternal age, physical punishment, a bad neighborhood, and poor school achievement. The strongest predictor of having a court record was black race. The risk indicators did not completely account for the racial disparity. “After controlling for important risk factors, the relationship between race and reported violence was reduced but not eliminated, showing that [the relationship] could not be completely explained by factors measured in the Pittsburgh Youth Study” (Farrington et al., in press). The risks explained most of the self-, mother-, and teacher-reported racial disparity in violence, but not the 21:1 ratio of court petitions.
A compelling explanation for these differences remains elusive. Future research will need to consider several alternative explanations. For example, it is possible that the risk factors may be more serious or severe for black boys (bad neighborhoods may be worse, physical punishment may be more severe, or poverty may be more desperate) compared with white boys. The risk factors may have different meanings for different races. Risk factors may have longer duration for black boys, or these risk factors may have interactive (or multiplicative) effects. These results may be the effect of enduring chronic poverty and stigma experienced by these youth. Yet another possibility is that protective factors may be less common among black boys. Furthermore, there are many alternative ways in which the juvenile justice system probably influences the crime rate differences (e.g., where police concentrate their efforts). For example, in their models of black and white juvenile arrests for homicide, Messner and colleagues (2000) found that rising and falling rates of juvenile homicide arrests corresponded with rates of child poverty. Living in urban areas increases the likelihood of formal juvenile justice system processing (Feld, 1999). Proportionately more black juveniles reside in urban areas and therefore are exposed to a greater likelihood of formal processing.
Clearly, blacks have been exposed to a wider array of risk factors than have whites. We now consider possible bias in the juvenile justice system.
BIAS IN THE JUVENILE JUSTICE SYSTEM
This section highlights a few points in the juvenile justice system about which there is an empirical literature addressing the issue of racial
disparity or bias. We consider three major points in the juvenile justice system process—the police, the courts, and probation officers —and the evidence of bias at each.
Policing
Any examination of the processing of youth through the juvenile justice system needs to consider the role of the police—the primary gatekeepers of the system. Police have contact with a large volume of youth who are offenders and those who are at risk. Many of the contacts are not documented, and many of those documented never result in a court case. As noted earlier (see Chapter 5), cases that reach the juvenile courts represent only a fraction of the contacts that juveniles have with the police. Most of the interactions of police with juveniles are therefore below the surface and relatively out of sight.
Police encounters with juveniles typically involve uniformed patrol officers who are dispatched in response to calls for police service and who also initiate encounters with youth on their own as they conduct patrol. There are also specialized juvenile officers whose encounters with juveniles may be in the context of referrals from parents, school officials, or patrol officers.
As noted in Chapter 5, there is scant empirical evidence on police encounters with juveniles (Black and Reiss, 1970; Lundman et al., 1978; Wordes and Bynum, 1995). A study by Sealock and Simpson (1998), based on an analysis of Philadelphia birth cohort data in which police contacts with juveniles from 1968 through 1975 were recorded, is one of the few that deals with juveniles ' encounters with police.
Nonetheless, one of the most researched issues in race and crime research is the role of extralegal factors in police decision making. Empirical findings confirm that police behavior is influenced by legal considerations, but officers' choices are not determined by legal factors, which leaves ample room for bias. This is particularly a concern when police decisions must be made based on few informational cues. Under such circumstances, readily observable characteristics, like race, sex, and juveniles' demeanor, have a substantial influence on the ways in which police officers behave. In one of the few studies of black citizens' perceptions of police behavior, with data from interviews, focus groups, and observations, Conley (1994) found that citizens consider police behavior to be among the most important sources of racial disparity. Police often accuse black youth of theft when they have purchased clothing. They often seem to seek to frighten youth, thereby generating behavior among adolescents designed to show their peers that they are not cowards. The police are also believed to be unfair in their designations of the crimes for which
they arrest adolescents, counting similar behavior as more serious when carried out by blacks.
A variety of studies have sought to document police bias in their encounters with juveniles. Results have been mixed and conclusions inconsistent, perhaps because of variations over time and in location. Some of the earliest studies reported disparities in the treatment of white and black suspects, to the disadvantage of the latter. These disparities were attributed to factors other than race itself, such as to the more frequently disrespectful demeanor of black (or other minority) suspects (Black, 1971), or to the more frequently proarrest preferences of black complainants (Black and Reiss, 1970; Lundman et al., 1978). In a reanalysis of his earlier work, Black (1980:107-108) reconsidered his earlier conclusion about racial bias, finding that black offenders were more likely to be treated in a punitive fashion by the police even though they were not more likely to be arrested. In subsequent analyses, Smith and Visher (1981) and Mastrofski et al. (1995) showed that race had an effect on police behavior, independent of other factors. Research has not consistently shown that minorities are treated more harshly than whites in terms of arrest (Mastrofski et al., 1995) or the use of force (Friedrich, 1980).
Smith and colleagues (1984) found that the effect of citizens' race on police arrest decisions was contingent on other factors. In police encounters with suspects only (and no victims), white and black men were (with other factors held constant) at equal risk of arrest, while white women were at much lower risk than black women. Furthermore, in encounters involving both suspects and victims, police were more likely to arrest if the victim was white and the crime was a property offense. While the police were more likely to comply with the preference of a white victim for arrest, the race of the suspect had no effect. Again, to illustrate the complexity of studying this problem, Mastrofski et al. (1995) failed to replicate these findings in a subsequent study.
The two most widely cited analyses of police encounters with juveniles (Black and Reiss, 1970; Lundman et al., 1978) were based on data collected for large-scale observational studies in 1966 and 1970, respectively. Since that time, the implementation of the due-process revolution4
|
4 |
Due process refers to the basic rights of a defendant in criminal proceedings and the requisites for a fair trial. The basic due process rights are embodied in the 5th and 14th Amendments to the U.S. Constitution. The due process revolution refers to the expansion of these rights and requirements by the Supreme Court to include timely notice of a hearing or trial which informs the accused of the charges against him or her; the opportunity to confront accusers and to present evidence on one's own behalf before an impartial jury or judge; the right of an accused to be warned of constitutional rights at the earliest stage of the criminal process; and the guarantee that an individual will not be tried more than once for the same offense (Black et al., 1990). |
and changes in the composition of police forces (better educated and more diverse) have altered the context of policing and, perhaps, the attitudes and values that police officers bring to their work. With the advent of community policing, police act more frequently on their own initiative. This is especially so in their handling of less serious, so-called quality-of-lif e offenses. Under these circumstances, police might initiate more encounters with juveniles, and one might expect a relatively large proportion of cases of minor legal gravity. In addition, in an era of community policing, law enforcement officers may use a wide repertoire of responses with correspondingly greater chances of biased decision making.
The Project on Policing Neighborhoods, described in Chapter 5, involved systematic social observations of patrol officers in the field by trained observers who accompanied officers during their entire work shifts (Worden and Myers, 1999).
Worden and Myers reported that 62 percent of the juvenile suspects encountered by police were minority, and 95 percent of these were black. Most were males and most appeared to be of lower socioeconomic status. According to these reports, few of the youth showed any indication of alcohol or other drug use, and few were found to have a weapon in their possession. Minority suspects were 43 percent more likely to be arrested than white suspects (13 versus 9 percent) and twice as likely to be judged as having shown disrespect (14 versus 7 percent).
Table 6-3 shows analyses from Worden and Myers (1999) predicting the arrest of juvenile suspects. In the first analysis, all of the police encounters with juveniles were included (n = 612). For the total encounters, being a minority was not a significant predictor of arrest, although
TABLE 6-3 Prediction of Juvenile Arrest in Police Encounters
|
Odds of Arrest |
||||||
|
All Encounters with Juvenile Suspects (N = 612) |
Police Initiated Cases Only (N = 319) |
|||||
|
Male (vs. female) |
2.08* |
2.63 |
2.33 |
3.85* |
8.33* |
7.69* |
|
Minority (vs. white) |
1.43 |
1.27 |
1.19 |
3.27* |
2.22 |
2.09 |
|
Crime serious (vs. not) |
1.95* |
1.93* |
2.558* |
2.59* |
||
|
Evidence (vs. none) |
6.11* |
5.82* |
12.81* |
12.19* |
||
|
Disrespect (vs. none) |
2.17 |
1.46 |
||||
|
* p<.05 Source: Worden and Myers (1999). |
||||||
being a male suspect, the seriousness of the crime, the amount of evidence, and the level of disrespect shown to the police were significant predictors of the odds of being arrested. The second set of figures in Table 6-3 shows a similar analysis for only those encounters that were officer initiated (n = 319). In contrast to the previous analyses, in officer-initiated cases, in which there is considerable police discretion, the minority status of the juvenile was a significant predictor of arrest. When the seriousness of the crime and the presence of evidence were taken into account, the effect of minority status was no longer statistically significant, although the odds of being arrested remained twice as high for minority juveniles compared with white juveniles.
Observational studies of police behavior have typically examined police actions in specific cities. Bachman (1996), however, used the national data collected for NCVS from 1987 to 1992 in order to address issues regarding the role of race in initial police responses to robbery and aggravated assault. Analyses focused only on crimes for which there were single offenders, thus eliminating 36 percent of the robberies and 16 percent of the aggravated assaults. A total of 52 percent of the remaining robberies and 54 percent of the assaults by single offenders were reported to police. Police responded more quickly to crimes committed by blacks with white victims than to white on white or black on black or white on black crimes. In addition, police put more effort into obtaining evidence for black on white crimes. Thus, blacks would have been more likely to be arrested and subsequently convicted, given that whites and blacks committed the same crime.
Police also exercise discretion in deciding what charges to make for particular crime events. Using data from the National Youth Survey sample of 11- to 17-year-olds, Huizinga and Elliott (1987) compared self-reported criminal behavior with official charges. They found that a slightly larger proportion of blacks reported involvement in general delinquency and that blacks and Hispanics reported more felony assaults than did whites. There were no consistent differences in rates of felony thefts. Among both nonserious and serious offenders, blacks were much more likely than whites to be arrested on a charge for an index offense. The racial differences could not be attributed to either the seriousness of the offense or to the frequency of offending.
Despite the fact that police tend to concentrate patrols in poor neighborhoods, they also appear to respond more slowly to client calls from inner-city residents than in more affluent neighborhoods (Bachman, 1996). In addition, inner-city black residents distrust the largely white police (Anderson, 1997; Russell, 1998) and believe the police are unlikely to be available when they are most needed (Pinderhughes, 1999). Many residents therefore believe that they must defend themselves.
In sum, evidence from this review of the research and analysis of a recent study of police encounters with youth reveals some evidence of bias, although also some inconsistency in the evidence. Such inconsistencies may arise from variations in police practice by location (e.g., particular city or rural area), variation in police practice over time as policies and administrations change, or even as a consequence of alterations in police behavior when they are under research observation. Methodological problems in this research are a difficult issue, as the problem of potential influence of observation on police behavior is nearly insurmountable, and problems of racial bias in the observations of investigators are also hard to control or assess.
Referrals to Juvenile Justice Intake Units
After the police have encountered youth and have made decisions about whether to continue to process or to divert them, others become involved in the decision-making process. Table 6-4 presents a number of studies that have examined racial disparities at various points in the processing of youth through the juvenile justice system. Despite the fact that existing evidence is fairly limited in quantity and studies vary in methodological rigor, the studies listed in Table 6-4 present a fairly consistent picture. Disparities exist in arrest (6 of 7 studies), intake (4 of 4), detention (6 of 7), counsel (1 of 1), and placement (7 of 7). Adjudication reveals a different pattern, with only one of the studies showing disparity and three not showing disparity.
In one of the largest studies of this topic undertaken so far, Frazier and Bishop (1995) analyzed data from all cases referred to juvenile justice intake units (N = 137,028) in Florida between January 1, 1985, and December 31, 1987. Frazier and Bishop looked at processing at four points— intake (case closure versus formal processing), detention (detention versus release), court referral (prosecutor files petition versus no petition filed), and judicial disposition (community treatment versus residential facilities or transferred to criminal court). In simple bivariate analyses, Frazier and Bishop found that nonwhites were more likely than whites to be (1) referred by intake for formal processing, (2) held in secure detention facilities, and (3) petitioned to court by prosecutors. However, in trying to interpret findings regarding racial disproportionality, it is commonly recognized that analyses need to control for certain factors that influence the decision-making process. For example, the seriousness of a crime obviously affects the decision-making process. Similarly, a youth's prior record would be something that judges and others involved in the decision-making process might take into account. Other factors about the life circumstances of the juvenile, such as living with a single parent or school
TABLE 6-4 A Summary of Findings Regarding Racial Disparity in the Juvenile Justice System
|
Study |
Sample |
Self-report of delinquency |
|
Pope and Feyerherm (1992)a |
National Juvenile Court Data Archives California and Florida, 1985 |
|
|
Elliott (1994a) |
National Youth Survey National Sample, 1976-1989 |
No |
|
Elliott (1995) |
National Youth Survey National Sample, 1976-1989 |
No |
|
Austin (1995)a |
Aggregate level multiple sources California, 1991 |
|
|
Wordes and Bynum (1995) |
Nine jurisdictions in Michigan, 1990 |
|
|
Feld (1995) |
Hennepin County, Minnesota, 1986 |
|
|
Frazier and Bishop (1995) |
Florida, 1985-1987 |
|
|
Leonard and Sontheimer (1995) |
Counties in Pennsylvania, 1989 |
|
|
Poupart (1995)b |
Counties in Wisconsin, 1985-1991 |
|
|
Hamparian et al. (1997)a |
States, 1980s and 1990s |
|
|
Bridges and Steen (1998) |
Three counties in Washington state, 1990-1991 |
|
|
Cook and Laub (1998) |
Uniform Crime Reports, National Crime Victimization Survey, Supplemental Homicide Reports, 1976-1995 |
|
|
DeComo (1998) |
36 states, 1995 |
|
|
Greenfeld (1999) |
National Crime Victimization Survey Aggravated Assault Robbery |
|
Victim Reporting |
Arrest |
Intake |
Detention |
Counsel |
Adjudication |
Placement |
|
|
Yes |
Yes |
Yes |
Yes |
||||
|
Yes |
|||||||
|
Yes |
Yes |
Yes |
|||||
|
Yes |
Yesc |
||||||
|
Yes |
Yes |
Yes |
|||||
|
Yes |
No |
No |
|||||
|
Yes |
No |
||||||
|
Yes |
Yes |
No |
Yes |
||||
|
Yes |
Yes |
Yes |
|||||
|
Yes |
|||||||
|
Yes |
|||||||
|
Yes |
|||||||
|
Yes |
Yes |
Yes |
Yes |
Yes |
|||
|
No |
No |
No |
No |
No |
|||
|
a Does not control for important covariates. No determination can be made regarding whether the disparities are justified or unjustified. b The race comparison is white versus American Indian. c Only in misdemeanor model. |
|||||||
failure, may also influence the decision about how to handle a juvenile. Thus, analyses need to control for some of these factors to better reveal the importance of race or ethnicity in the disproportionality. As indicated in Table 6-4, only a few studies include controls for important covariates.
Using this more rigorous test of the disproportionality hypothesis involving multivariate analyses, Frazier and Bishop (1995) found that being nonwhite significantly increased the likelihood of an intake decision of formal processing, despite controls for gender, age, prior record, offense severity, and contempt status. Being nonwhite did not seem to affect decisions at other points in the process.
Waiver to Adult Courts
In an analysis of transfer decisions in Boston, Detroit, Newark, and Phoenix, Fagan et al. (1987a) found that blacks were 75 percent more likely to be waived to criminal court than whites (1.4 versus 0.8 percent of cases, respectively). Juveniles who were older at the time of the offense, juveniles with an earlier age of delinquency onset, and juveniles charged with murder were most often transferred. Although Fagan et al. (1987a) found that minority juveniles were transferred more often, race was not a statistically independent influence on the decision to transfer. However, these authors suggested that race may indirectly affect transfer decisions through factors such as dress, demeanor, quality of defense representation, verbal abilities of the minor, and status in the community.
Podkopacz and Feld (1995, 1996) closely scrutinized court processing variables and reported no race effects in waiver decisions after appropriate controls were added. In contrast, the General Accounting Office (1995) reported substantial racial effects when controlling only for present offense. Again, though there is little empirical information on which to draw conclusions, the evidence that exists suggests a complicated picture of decision making affected by multiple factors, including a number that are relatively subjective. The possibility that race may play a role in those waiver decisions in which substantial discretion is granted decision makers cannot be completely discarded.
Decision Making in the Courts and Institutions
By necessity, court officials classify youth and make judgments about character, and these decisions influence the outcome of legal proceedings. Since the 1960s, studies of racial bias in juvenile courts have examined whether court officials treat minority youth more severely than white youth (Aday, 1986; Arnold, 1971; Bishop and Frazier, 1988; Bortner and Reed, 1985; Carter and Wilkins, 1970; Fagan et al., 1987a, 1987b; Horowitz
and Pottieger, 1991; Piliavin and Briar, 1964). Bridges and Steen (1998) point out that, although these studies call attention to racial discrimination in the juvenile courts, few have examined the mechanisms by which this process might take place. That is, how might court officials' perceptions of juvenile offenders contribute to racial differences in legal dispositions? Bridges and Steen (1998) argue that differential perceptions of youth and their crimes may act to “legitimate” racial disparities associated with official assessments of a youth 's dangerousness and risk of future criminal behavior.
Bridges and Steen (1998) studied juvenile offenders and their probation officers' written accounts of the decisions made about their cases. Using these written accounts from reports and other information about the offenders, they examined the link between the offender's race and the probation officer's assessments of the youth, his or her crime, the perceived likelihood of future criminal behavior, and sentence recommendations. Bridges and Steen used information from 233 narrative reports written by probation officers in three counties in a western state, drawn from a larger sample of juvenile court cases processed through the courts between 1990 and 1991(Bridges and Steen, 1998). Probation officers write these reports for the court at the disposition of the case, typically following conviction.
Many other scholars believe that race is a marker of social status that influences how officials evaluate the offender's case and character. For example, Cicourel's (1968) analysis of juvenile courts suggests that minorities are more likely than whites to be seen as disrespectful of authority and, in particular, disrespectful of court officials. Other studies have reported similar findings: that minorities are perceived differently from whites, despite having similar offense histories and characteristics, and often are seen as threatening and dangerous (Bridges et al., 1995, 1987; Farrell and Swigert, 1978; Tonry, 1995). The first question Bridges and Steen asked is whether court officials perceived and judged minority offenders differently from whites with similar characteristics. They also asked whether officials perceive minorities as more likely than white youths to commit future crimes. If court officials perceive minorities as more threatening, then they will be more likely to recommend greater punishment and control (Farrington et al., in press).
Bridges and Steen (1998) found pronounced differences in officers ' attributions about the causes of crime committed by white and minority youth. For black children, crime was attributed to negative attitudinal traits and personality defects. Among white children, their offenses were thought to be primarily caused by external environmental factors (e.g., family dysfunction, drug abuse, negative peer influence). Furthermore, they found that these differences contributed significantly to differential
assessments of the risk of reoffending and to sentence recommendations, even after adjusting for legally relevant case and offender characteristics. These differences tended to shape the probation officers' evaluation of how likely the child would be to commit crime in the future and how amenable the child would be to treatment. Since juvenile court judges typically follow the sentencing recommendations of probation officers, these findings are important.
This study also provided insight into the factors that influence preadjudication detention. Bridges and Steen (1998) found that race indirectly influenced decisions to detain through factors like performance in school and family situation. This was the case regardless of the nature and severity of the offense. When school performance and family were viewed as positive and stable, juveniles were more likely to be viewed as amenable to the court's influence and control. The perceived ability of the family to supervise the juvenile may affect the court 's decision about whether or not to detain. Black juveniles are more likely than whites or Hispanics to live in single-parent families (62 percent, 27 percent, and 36 percent, respectively) (U.S. Census Bureau, 1999). To the extent that court decision makers believe that single-parent families provide less supervision of youngsters than two-parent families, black juveniles are at higher risk of being detained. Being detained before adjudication negatively affects sentencing outcomes (e.g., whether or not to incarcerate as well as the length of a sentence).
Petersen and Hagan (1984) have suggested that research must consider context-specific conceptions of race and realize that race and minority status can act in combination with other variables to produce differential outcomes. For example, using a sample of 2,329 felony offenders sentenced from July 1977 to June 1978 in Minnesota, Miethe and Moore (1986) tested and compared additive (main effects) and race-specific models of analysis. While the additive model was not sensitive to race differences, the interactive model was. Black offenders receiving the most severe sentences tended to be single, from urban areas, had a previous felony record, and committed multiple and more serious offenses. For white offenders, this combination of characteristics revealed little effect on sentencing outcome. Race remained a major source of differential treatment in criminal processing when it was considered in conjunction with other social, legal, and case factors (Miethe and Moore, 1986).
Research pertaining to the use of the death penalty indicates possible racial biases. For example, Baldus and colleagues (1983) reported that black offenders found guilty of murdering whites were at highest risk for the death penalty, whereas offenders of any race who were found guilty of murdering blacks were least likely to receive the death penalty. Some evidence, too, indicates that blacks are likely to serve a higher proportion
of their sentences (Carroll and Mondrick, 1976). Time served also would contribute to racial disproportionality.
Blacks are not the only minority at risk for unequal treatment by the justice system. Alvarez and Bachman (1996) examined racial disparity comparing American Indians to whites in Arizona. After accounting for previous felony convictions and several other factors, American Indians were found to receive longer sentences than whites for the relatively common crimes of robbery and burglary and relatively shorter sentences for the less common crime of homicide (Alvarez and Bachman, 1996). Commenting on the study, Stone (1999) suggested that both types of discrepancies may indicate bias. The longer sentences could be evidence of harsher treatment of American Indian offenders for crimes against strangers, but lesser punishments for homicides, which largely involve acquaintances. Stone further suggested that there may be both under- and overenforcement in some communities and that these two kinds of bias may cancel each other out in studies that do not take interactions into account.
Despite the lack of an extensive literature on this topic, the review by Bridges and colleagues (1987) suggests that the bias in the juvenile justice system may be subtle, indirect, and difficult to detect. This makes it difficult, in turn, for policy makers to justify changes in policies to remedy the disparate treatment of youth in the juvenile justice system. Liska and Tausig (1979) reexamined 17 juvenile justice studies that considered the relationship between social class, race, and legal decision making. They found race differences that produced a cumulative effect that changed a racially heterogeneous prearrest population into a nonwhite, homogeneous institutionalized population. Initial race differences were compounded at successive stages of the juvenile justice system. Accumulated racial differences were also found by Feyerherm (1981) in his examination of status offenders.
Risk is a limiting concept to the extent that it fails to make explicit the degree to which enduring features of racial stratification and discrimination interact with and compound problems related to individual decision making, family dysfunction, school failure, community context, crime, and contact with the juvenile justice system. Hawkins et al. (1998) highlighted the important connections between race and risk when they wrote: “the social and developmental life courses of African Americans and whites in the United States are products of not only their specific individual experiences but also their membership in historically distinct and unequal social and economic groupings” (p. 40).
To reduce racial disparities, many jurisdications have undertaken the imposition of sentencing guidelines. In a study to determine effects of using sentencing guidelines, Ulmer and Kramer (1996) studied three counties in Pennsylvania. They discovered that race, sex, and age continued to
have an impact on sentencing differences, even though legal factors, such as severity of crime or number of prior offenses, accounted for much of the impact.
COMPOUND RISK
So far this chapter has examined the racial disparity evident in the juvenile justice system as a function of differences in behavior on the part of the black and white youth and biases in the juvenile justice system. The evidence adduced has not, of course, provided a complete account of why or how the disparities occur. Yet our review has shown that both behavior and biases contribute to the racial disparities.
Compound effects, even of small disparities, can produce large differences. The degree to which such effects can magnify disparities has been calculated using information from the UCR (Federal Bureau of Investigation, 1997), Snyder and Finnegan's Easy Access to FBI Arrest Statistics 1994-1997 (1999), and Stahl et al.'s Juvenile Court Statistics, 1996 (1999). Figure 6-3 shows the numbers in each category and the probabilities that a juvenile will reach a point in the juvenile justice process separately for black and white juveniles.5 The probabilities that appear on the outside of Figure 6-3 are the proportion of the population under age 18 that reach each stage of the process, shown separately for blacks and whites. (These are referred to as compound probabilities because they are also the product of transitional probabilities.) For example, the probability of a white juvenile being handled formally by the courts is:
and the probability of a black juvenile being handled formally by the courts is:
The probabilities that appear on the inside of Figure 6-3 are the transitional probabilities, computed as the proportion of people at one stage
|
5 |
The panel expresses appreciation to Jane Costello and Alaattin Erkanli of Duke University Medical School and Nancy Crowell of the National Research Council staff for providing the results of this analysis. |

FIGURE 6-3 Compounding of risk through the juvenile justice system, by race. Source: Population data from Bureau of the Census, online at http://www.census.gov/population/estimates; arrest data from Snyder and Finnegan (1999) and Federal Bureau of Investigation (1997); court and placement data from Stahl et al. (1999).
who show up at the next one. Transitional probabilities for juveniles being handled formally, for example, are calculated as the proportion of delinquency cases who were handled formally in the courts, calculated separately for whites and blacks. For whites, the transitional probability of being handled formally is:
For blacks, it is:
Table 6-5 compares the transitional and compound probabilities of blacks to whites. The first column shows relative risk, which takes into account the proportions of blacks to whites. The relative risk for a black juvenile being handled formally, in relation to that for a white juvenile is the ratio of the transitional probabilities:
TABLE 6-5 Compounding of Racial Disparity in the Juvenile Justice System
|
Risk of: |
Relative Black to White Risk |
Relative Compound Black to White Risk |
|
Being arrested |
2.00:1.00 |
2.00:1:00 |
|
Referred to court for delinquency case |
1.19:1.00 |
2.38:1:00 |
|
Case being handled formally |
1.15:1.00 |
2.82:1:00 |
|
Being adjudicated delinquent or found guilty |
0.93:1.00 |
2.51:1:00 |
|
Being put in residential placement |
1.23:1.00 |
3.12:1:00 |
|
Source: Arrest data from Federal Bureau of Investigation (1997) andSnyder and Finnegan (1999); court and placement data from Stahl etal. (1999). |
||
The second column of Table 6-5 shows relative compound risk, which is the ratio of the compound probabilities. The relative compound risk for a black juvenile being handled formally in relation to a white is:
As this example shows, the relative risk for being handled formally in the courts by blacks is 1.15 to 1; it rises to 2.82 to 1 when compounding is taken into account.
Black juveniles are at greater risk than white juveniles of being arrested, charged for delinquency, and handled formally. They are not at greater risk, given formal handling, for being adjudicated delinquent or found guilty. Thus, at almost every stage in the juvenile justice process the racial disparity is clear, but not extreme. However, because the system operates cumulatively the risk is compounded and the end result is that black juveniles are three times as likely as white juveniles to end up in residential placement (see Table 6-5). Even among those juveniles who are arrested, blacks are more than one and a half times as likely as whites to end up in residential placement.
Some of this overrepresentation of blacks in correctional institutions and justice system residential placements may be accounted for by differences in treatment of blacks and whites at various stages of juvenile justice system processing. Other forms of differential treatment, too, may contribute to the overrepresentation of blacks in secure juvenile justice facilities. For example, some juveniles who steal or commit assault are sent to mental hospitals for treatment of their behavior; others who exhibit similar behaviors are confined in the juvenile justice system.
A comparison of two samples of adolescents, one sent to a correctional facility and the other admitted to a state psychiatric hospital, in one urban area during a one-year time period found that the most powerful distinguishing factor between the two groups was race: 71 percent of the hospitalized youth were white, whereas 67 percent of the incarcerated adolescents were black. The authors noted that “clinical and epidemiological findings indicate clearly that many seriously psychiatrically disturbed, aggressive African American adolescents are being channeled to correctional facilities while their equally aggressive white counterparts are directed toward psychiatric treatment facilities” (Lewis et al., 1980:1216).
Three additional considerations should be noted in accounting for the overrepresentation of blacks in the criminal justice system. Hawkins (1998) has suggested that one of the reasons for the disproportionate pres-
ence of blacks in the nation's justice system may be the geographic and social marginalization of the white underclass. The vast majority of poor blacks live in cities. Poor whites are more likely to be distributed in rural areas and small towns, which may shield them from some forms of crime detection and social control found in large cities.
The second consideration is that laws governing drug offenses result in a much greater likelihood of incarceration for blacks (Hawkins, 1998). Not only are there longer mandatory sentences for the less expensive form of cocaine that is more likely to be used by blacks, but also the distribution system for inner-city purchases is under far greater surveillance than is the suburban distribution system. Snyder et al. (1996:142) reported that during 1992, of all black juveniles in the United States who were processed through the justice system for varying offenses, 25 percent were detained. This compares with 18 percent of white cases and 22 percent of cases involving juveniles of other races. In contrast, the rates of confinement for juveniles charged with drug offenses were 47 percent for blacks, 26 percent for whites, and 19 percent for others. At the same time, surveys of the public have shown white adults to be major users of drugs, including cocaine, and have found unexpectedly low rates of drug use among black adolescents (Bachman et al., 1991; Lockwood et al., 1995; National Institute of Drug Abuse, 1991; Rebach, 1992).
Other potential consequences associated with discriminatory treatment may affect the development of youth from different racial and ethnic minority backgrounds. The effect of these experiences on the individual may be to create barriers to obtaining such resources as jobs, housing, and health care. Furthermore, when a person is exposed to persistent discriminatory experiences, the consequences may involve perceptions of the unfairness of the system (Bobo, 2001, Crocker and Major, 1989), reactive coping strategies (Spencer, 1999), hostile attributions (Graham, 1997), and psychological disengagement (Crocker et al., 1998).
CONCLUSIONS AND RECOMMENDATIONS
Overrepresentation of blacks, Hispanics, and American Indians in the juvenile justice system requires immediate attention. The existence of disproportional racial representation in the juvenile justice system raises concerns about differential exposure to risks and the fairness and equal treatment of youth by the police, courts, and other players in the juvenile justice system. Given the importance of the problem of race, crime, and juvenile justice in the United States, the scant research attention that has been paid to understanding the factors contributing to racial disparities in the juvenile justice system is shocking.
Recommendation: The panel recommends that a comprehensive, systematic, and long-term agenda for acquiring empirical knowledge to understand and meaningfully reduce problems of unwarranted racial disparity in the juvenile justice system is a critical priority and that new funding should be set aside for this effort.
-
Research should focus on the entirety of the juvenile justice system by examining multiple decision-making points and processing stages. This report demonstrates how small biases in one part of the system may have an unforeseen and dramatic outcome at later points in the juvenile justice system process. The links across each of the decision-making points, as well as the decisions themselves, should be scrutinized.
-
Research is needed to examine the role of organizational policy and practice in the production of juvenile arrest, adjudication, and confinement rates and the organizational policy/practice and the decisions of individual officials. Research should especially target police-juvenile encounters, prosecutorial practices, and correctional processes. Challenges to the research community should be issued to develop creative ways to overcome methodological limitations of much existing research.
-
Research on bias should take into account the fact that problems may appear on a local level that do not show up when state-aggregated data provide the only source for information. We need information about private as well as public facilities. Research should also take into account sample selection biases as the screening process operates to filter youth in different directions within the system.
-
Research is needed to examine how juvenile justice system decisions are influenced by the characteristics of the communities in which different youth live.
-
Research should move beyond traditional emphasis on black-white differences to include other minorities and should recognize the diversity within racial and ethnic groups.
-
Research should move beyond the traditional focus on urban jurisdictions to include rural and suburban jurisdictions as well.
The Office of Juvenile Justice and Delinquency Prevention has been instrumental in the process of collecting data to establish the existence of racial disproportionality among juveniles involved in the juvenile justice system. There remains a need for ongoing data collection and an expansion of the effort in order to track whether progress is being made in
reducing unwarranted racial and ethnic disproportionality at all stages of juvenile justice system processing.
Recommendation: Changes are needed in data collection, monitoring, and juvenile justice administration to address racial disproportionality in the juvenile justice system. Suggested changes include:
-
Developing a systematic monitoring procedure to determine the percentage of minority youth being processed through each stage of the juvenile justice system, from initial police contact through confinement release.
-
Developing and implementing training workshops focusing on race and juvenile justice system processing. At a minimum, diversity training for justice system employees and officials must focus on beliefs and attitudes that shape assessments.


