
Appendix A1
Costs of Regulating Transgenic Pest-Protected Plants
Erik Lichtenberg, University of Maryland
A.1 INTRODUCTION
The bulk of this report is devoted to the potential risks posed by transgenic pest protected plants and the ways that regulation can mitigate those risks. In other words, this report focuses primarily on the benefits of regulating transgenic pest protected plants, even though those benefits are presented in neither quantitative terms (magnitudes of risk and risk reduction) nor economic ones (the public 's willingness to pay for reduction of these risks, increases in sales due to allayed fears about safety, etc.). Yet regulation is desirable only if its benefits outweigh its costs; the mere existence of risk does not imply that regulation is necessary or desirable. This appendix considers potential costs of regulating transgenic pest protected plants and provides evidence regarding the potential magnitudes of some of those costs. Two forms of regulation are considered. One involves regulating transgenic pest protected plants as pesticides under the Federal Insecticide, Rodenticide, and Fungicide Act (FIFRA). The other involves regulating environmental effects under the Federal Plant Pest Act (FPPA) and related legislation and regulating food safety under the Federal Food, Drug, and Cosmetic Act (FFDCA) administered
|
1 |
This appendix was authored by an individual committee member and is not part of the committee's consensus report. The committee as a whole may not necessarily agree with all of the contents of appendix A. |
by the Food and Drug Administration (FDA)—as would occur under the Coordinated Framework if transgenic pest protected plants were not legally categorized as pesticides.
Regulation of transgenic pest-protected plant products will affect the crop-protection and seed industries. It may also affect crop breeding more broadly with implications for future agricultural productivity growth and for the structure of US agriculture. The possibility that regulation would function as a barrier to the entry of new participants is of special concern in this regard. The notion that regulation can function in such a manner is well established in economics. Regulatory requirements can create or enhance economies of scale by increasing the fixed costs of doing business in an industry, thereby limiting entry. Some have gone so far as to argue that established firms may even seek regulation precisely to inhibit entry and thus maintain market power (for a brief discussion see Viscusi et al. 1995).
The costs of generating test data on transgenic pest-protected plants might make regulatory review serve as a barrier to entry. Strict pre-market review of potential products with extensive testing requirements can be expensive. Imposing such fixed costs on newly developed products can have two kinds of negative effects. First, it can increase the potential size of the market (expected sales) needed to break even and thus justify investment in a new plant variety. Regulation could thus be one factor limiting investment in transgenic pest-protected plants with small potential markets; in other words, high testing costs could engender an “orphan crop” problem by discouraging research and development (R&D) aimed at crops for which annual seed or propagule purchases would be small. Second, it can limit entry into the market by entities that have relatively little capital, including small biotechnology startup companies, small to medium seed companies, and public-sector breeders. Limiting entry can reduce competition in varietal development, which in turn can lead to lower overall levels of investment in breeding R&D and affect the future growth and sustainability of agricultural productivity.
Regulation of transgenic pest-protected plant products as pesticides raises special concerns. The Environmental Protection Agency's (EPA) approach to regulation of these products typically involves requiring an applicant to submit more and more-expensive test data than submitted to the US Department of Agriculture (USDA) and the Food and Drug Administration (FDA) during their reviews of comparable products. As a result, regulation of transgenic pest-protected plant products by EPA under FIFRA and FFDCA has the potential to impose more substantial barriers to entry than regulation by USDA and FDA.
This appendix examines the extent to which regulation of transgenic
pest-protected plant products has the potential to discourage R&D related to crops that have small seed markets and to create barriers to the entry of less well-capitalized entities. I begin with the background needed to assess that potential. First, I review the roles of plant breeding and pest management in the growth of US agricultural productivity since World War II. I then review the current state of plant-breeding and crop-protection R&D in the United States, both generally and with respect to transgenic pest-protected crops, with an emphasis on the division of labor between the public and private sectors. Third, I review the structure of the seed and agrichemical industries involved in plant-breeding and crop-protection R&D. The seed and agrichemical industries have experienced a wave of merger and acquisition activity in recent years, raising concern about potential adverse effects of concentration on R&D; I examine the structure of the industries in light of the recent changes and discuss what is known about the impacts of transgenic pest-protected plants on competition.
I then consider the potential costs of pre-market regulatory review, with special attention to likely testing requirements for pesticides under FIFRA and FFDCA relative to data and information typically submitted to USDA under the Federal Plant Pest Act and to FDA under FFDCA. I compare those costs to the fixed costs of breeding and estimate the effect of testing requirements on the market size needed to justify investment.
A.2 AGRICULTURAL PRODUCTIVITY IN THE UNITED STATES
Pest management and crop breeding have played important roles in helping US agriculture to maintain impressive growth in productivity over the last 50 years. Between 1948 and 1994, agricultural productivity increased at an average annual rate of more than 1.9%, almost twice the rate of growth of productivity in the US nonfarm economy (Ball et al. 1994). Agricultural productivity growth has continued unabated in the 1990s. Between 1989 and 1994, agricultural productivity grew at an average rate of 2.9%.
Three broad groups have generally shared in the gains from that productivity growth: consumers; input suppliers, processors, and marketers of agricultural products; and farmers.
Consumers in the United States and abroad have been major beneficiaries of productivity growth. From 1948 to 1994, agricultural productivity grew faster than the US population (which increased at an average annual rate of 1.2%), allowing for growth in domestic per capita food consumption and exports simultaneously. US consumer benefits have come partly in the form of increased food consumption and partly in the form of lower food prices (which permit increased consumption of other
goods and services). Overall, real per capita expenditures on food increased by 18% from 1948 to 1997, while food prices were declining by roughly 10% relative to the overall price level, as indicated by the fall in the consumer price index (CPI) for food from 108% of the overall CPI in 1948 to 98% in 1997. Real per capita food consumption, as measured by expenditures deflated by the CPI for food, increased by about 31% over that period. Moreover, spending on food has made up a continuously falling share of consumption and income. In 1948, food accounted for 31% of personal consumption expenditures in the United States; by 1997, its share had fallen to 14% (Council of Economic Advisers 1999).
The extent to which input suppliers, processors, and marketers of agricultural products have appropriated gains from increased farm productivity has not been studied. Purchased inputs have played an increasingly important role in agriculture over the last 50 years, as indicated by the increase in the share of the gross value of farm output accounted for by purchased input expenditures, from 18.3% in 1950 to 25.7% in 1997 (Economic Research Service 1999b). The role of processors and marketers in the food industry has increased similarly. In 1948, the farm sector accounted for 41% of the value of food products in the United States; by 1997, that share had fallen to 21%.
The gains from increased agricultural productivity accruing to farmers are reflected in changes in the net value added by the farm sector, which rose in nominal terms from $18.3 billion in 1950 to $92.8 billion in 1997. The average value added per farm in real (1997 dollar) terms more than doubled during that period, increasing from $22,606 in 1950 to $45,565 in 1997 (Economic Research Service 1999b). The average household income of farm operators rose during the period from 60% of the national average to 105% of the national average.
Broadly speaking, the new agricultural technologies underlying productivity growth have featured the substitution of agricultural chemicals (such as fertilizers and pesticides), energy, seed, and other purchased inputs for labor (farmers' own and hired) and land. Use of agricultural chemicals tripled from 1948 to 1996 (Council of Economic Advisers 1999). During that period the use of feed and seed increased by 64%, the use of energy by 46%, and the use of durable equipment by 44%; the use of labor fell by more than two-thirds; and land use remained roughly constant.
Long-term trends in crop yields provide a crude measure of the contribution of chemicals and breeding to productivity growth. The growth in yields over the last 50 years has been striking: among major US agricultural commodities, for example, yields of corn, wheat, and sorghum have roughly tripled, and yields of soybeans, cotton, and rice have roughly doubled (USDA 1953 and 1999a). Not all long-term growth in yield is attributable to chemicals and breeding; regional shifts in cropping pat-
terns, the introduction of irrigation, improvements in agronomic practices, and other factors have also helped to increase yields. Nevertheless, chemicals and breeding are important contributors.
The impact of genetic improvements on crop yield has been investigated for several major crops. It has been estimated that the introduction of and subsequent genetic improvements in hybrid varieties account for about 80% of the increase in corn yields from 1930 to 1980 and more than half the increase in soybean yields since 1920 (Duvick 1984; Specht and Williams 1984; Huffman and Evenson 1993). Genetic improvements have been estimated to account for half the increase in wheat yields from 1954 to 1979, almost two-fifths of the increase in sorghum yields from 1950 to 1980 (Miller and Kebede 1984; Schmidt 1984; Feyerherm et al. 1988), and 20-35% of the increases in flue-cured tobacco yields from 1954 to 1987 (Babcock and Foster 1991). It has been estimated that, by the middle 1950s, investment in improved corn and soybean hybrids had generated respective rates of return of around 35-40% and 20% respectively (Griliches 1958). The rate of return to public potato breeding during the period 1967-1990 has been estimated to be as high as 80% (Araji et al.1995).
The contribution of pesticides (including herbicides) to agricultural productivity is less well documented. The methods used in the most widely known studies (Pimentel et al.1991; Knutson et al.1990) may overestimate pest damage. They assume that farmers have little ability to substitute land, labor, machinery, and other inputs for pesticides and little flexibility in cropping decisions. Moreover, they tend to rely on data from experimental plots or expert opinion to estimate crop losses; both tend to exaggerate differences in yields between use and nonuse of pesticides. The damage-control model of Lichtenberg and Zilberman (1986) provides a method for inferring crop damage from observed input and output use. Econometric studies that used that approach to investigate the aggregate US agricultural economy on the basis of time-series data found that the use of pesticides roughly halved proportional crop losses, from about 20% in 1950 to 10% in 1989 (Chambers and Lichtenberg 1994 and 1995). An econometric study of the aggregate US agricultural economy applied the approach to state-level cross-section data for a single year and obtained very similar results (Carrasco-Tauber and Moffitt 1992).
A.3 PLANT BREEDING RESEARCH AND DEVELOPMENT IN THE UNITED STATES
R&D in both the public and private sectors have contributed to the new agricultural technologies that have made productivity growth possible. In 1992, US agricultural R&D expenditures were approximately $6 billion, of which $3.3 billion (56%) came from the private sector, $2.0
billion (33%) came from state agricultural experiment stations (Economic Research Service 1995), and $0.7 billion (11%) came from the USDA.
Broadly speaking, the private sector has concentrated on technologies for which markets provide means of recouping R&D costs, as when patent protection allows private firms to appropriate a share of the benefits generated by new technologies (Huffman and Evenson 1993). In 1992, agricultural chemicals accounted for about one-third of private agricultural R&D, and plant breeding accounted for about 10% (Fuglie et al. 1996). The public sector, in contrast, engages in R&D on technologies for which markets do not provide a viable means of recovering R&D costs. Examples of the former include technologies for which patents would not be enforceable if issued, basic research, and technologies for markets that are simply to small to generate enough revenue to make the technologies sufficiently profitable for the private sector (Huffman and Evenson 1993). Plant-production systems accounted for 35% of state agricultural experiment station spending in 1992 (Fuglie et al. 1996). In 1994, public-sector expenditures on plant breeding amounted to $213 million, about half the $400 million spent by the private sector (Frey 1996; Fuglie et al. 1996).
In pest management, the private sector has undertaken the bulk of R&D for pesticidal substances that can be sold under patent protection. Development of integrated pest management (IPM), which essentially consists of sets of farming practices (such as crop rotation, scouting, field sanitation, tillage methods) that enhance pest control or limit pest damage has been left principally to the public sector. IPM practices are easily imitated, so patents would be unenforceable. Moreover, many IPM programs use combinations of relatively familiar practices and thus might not be considered sufficiently novel to be awarded patent protection.
The relative shares of public and private plant breeding depend largely on the actual or potential size of the market for seeds, which in turn depends on biological and economic factors that influence the feasibility and cost of replicating the performance of superior varieties with saved seed. Important determinants of seed market size include the following:
-
The feasibility of producing hybrids with yields sufficiently greater than those of pure varieties, as has been the case with corn and sorghum (but not wheat or soybeans).
-
The cash costs of saving seed, including cleaning to eliminate weed seed, storage, and treating to prevent disease and insect damage.
-
The implicit costs of saving seed, including the value of forgone harvests of crops not normally harvested for seed (such as forages) and of losses due to delays in replanting.
-
The rate at which varieties become obsolete because of the intro-
-
duction of new varieties that have higher yields, better product quality, and better agronomic traits.
Among major crops in the United States, purchased seed is used for virtually all the corn and sorghum grown and most of the potatoes, cotton, and soybeans (table A.1). Small-grain growers use substantial amounts of saved seed. Saved seed is especially prevalent in wheat. High dockage rates for weed seed (which make careful cleaning profitable) and standard storage practices makes the additional costs of saving seed quite low. In cases where plants are final comsumption goods—such
TABLE A.1 Public and Private Sector Breeding Effort, 1994 (PhD-Equivalent Scientist-Years)
|
Crop |
SAESa |
ARSb |
Private |
Total |
Area Planted to Purchased Seed (%) |
|
Corn |
27.1 |
8.2 |
509.75 |
545.05 |
100 |
|
Wheat |
64.5 |
11.95 |
53.95 |
130.4 |
20-32 |
|
Rice |
13.8 |
6.3 |
21.9 |
42 |
85 |
|
Barley |
16.4 |
2.1 |
13.9 |
32.4 |
50 |
|
Oats |
10.1 |
2.7 |
4.9 |
17.7 |
40 |
|
Sorghum |
11.8 |
2.5 |
40.8 |
55.1 |
95 |
|
Other Grains |
11.65 |
0.5 |
57.75 |
69.9 |
|
|
Cotton |
19.15 |
11.65 |
103.45 |
134.25 |
66 |
|
Alfalfa |
15.2 |
11.85 |
41 |
68.05 |
97 |
|
Other legume forage |
9.1 |
7 |
2.15 |
18.25 |
95 |
|
Forage grasses |
13.5 |
14 |
35.95 |
63.45 |
95 |
|
Soybean |
45 |
9.6 |
101.35 |
155.95 |
76 |
|
Peanut |
14 |
2.5 |
3.15 |
19.65 |
70 |
|
Sunflower |
0.6 |
2.56 |
31.45 |
34.61 |
95 |
|
Flax |
1.3 |
0 |
0 |
1.3 |
90 |
|
Canola |
5.7 |
1 |
28 |
34.7 |
|
|
Other Oilseeds |
2.6 |
0 |
10.95 |
13.55 |
|
|
Potatoes |
31 |
10 |
9 |
50 |
73 |
|
Other vegetables |
91 |
16.4 |
283.65 |
391.05 |
85 |
|
Sugar |
4 |
15 |
25 |
44 |
|
|
Ornamentals |
18 |
5 |
64 |
87 |
100 |
|
Lawn and Turf |
15 |
0 |
41 |
56 |
95 |
|
Totals |
529 |
177 |
1,499 |
2,205 |
|
|
a State Agricultural Experiment Station b USDA Agricultural Research Service Source: Breeding effort from Frey (1996). Market shares of corn, soybean,cotton, potatoes, and wheat from Economic Research Service (1997).Market shares of remaining crops from McMullen (1987). |
|||||
as home and garden uses, golf courses, and other landscaping—virtually all seed is purchased.
Private-sector plant-breeding R&D has been growing rapidly. In nominal terms, private-sector spending on plant breeding rose from $6 million in 1960 to $400 million in 1992 (Economic Research Service 1995). In real terms, private-sector spending increased by a factor of about 13 over this period (an average annual growth rate of 8.3%).
The public and private sectors also differ substantially in the types of breeding R&D undertaken. The public sector concentrates primarily on basic breeding R&D, notably basic research on breeding methods and germplasm enhancement. Each of those general categories accounts for about 30% of public-sector breeding effort, but only 10% of private-sector breeding effort (Frey 1996). The private sector concentrates primarily on cultivar development, that is, preparation of varieties for commercial release.
R&D on transgenic plants exhibits similar differences between the public and private sectors. Most studies have used the number of field trials of transgenic plants as an indicator of R&D effort (Huttner et al. 1995; Ollinger and Pope 1995).
From 1987 to the end of May 1999, the USDA Animal and Plant Health Inspection Service (APHIS) approved 6,531 applications for field trials of transgenic agronomic crops. Data provided by APHIS list the crops involved in 6,522 of them and the types of traits in 6,516. Field trials conducted by private industry focused on herbicide and insect resistance, both of which complement existing product lines of the agrichemical companies responsible for the overwhelming majority (81%) of the trials (table A.3). Universities and nonprofit research institutes focused relatively more effort to basic research (for example, on marker genes) and traits like viral resistance and bacterial resistance, for which pesticidal chemicals are not marketed. Private-sector field trials focused overwhelmingly on corn, which accounted for almost half the industry total (table A.3). Four other major crops—soybeans, cotton, potatoes, and tomatoes—accounted for virtually all of the remainder. The public-sector effort was distributed somewhat more evenly across crops.
A.4 AGRICHEMICAL AND SEED MARKETS IN THE UNITED STATES
USDA estimates that in 1997 US farmers spent $6.7 billion on seed and $8.8 billion on pesticides for agronomic crops alone (Economic Research Service 1997). Seed and pesticide sales have been increasing during the 1990s (figure A.1). Corn, soybeans, wheat, cotton, and potatoes comprise the largest farm-sector markets for seed (table A.2). Corn, soy-
TABLE A.2 US Farm-Sector Sales of Pesticides and Seed for Major Crops, 1997
|
Chemical Expenditures per Acre, $ |
Seed Expenditures per Acre, $ |
Crop Area, millions of acres |
Total Chemical Expenditures, millions of $ |
Share of Total Chemical Sales, % |
Total Seed Expenditures, millions of $ |
Share of Total Seed Sales, % |
|
|
Corn |
26.87 |
28.71 |
80.2 |
2,155.70 |
24.4 |
2,303.32 |
34.3 |
|
Soybeans |
28.21 |
19.66 |
70.6 |
1,991.63 |
22.6 |
1,388.00 |
20.7 |
|
Wheat |
6.32 |
9.02 |
71.0 |
448.65 |
5.1 |
640.32 |
9.5 |
|
Cotton |
59.47 |
16.80 |
13.6 |
808.79 |
9.2 |
228.48 |
3.4 |
|
Rice |
68.32 |
24.15 |
3.1 |
208.79 |
2.4 |
73.80 |
1.1 |
|
Sorghum |
11.71 |
6.57 |
10.1 |
118.27 |
1.3 |
66.36 |
1.0 |
|
Barley |
9.81 |
8.96 |
6.9 |
67.69 |
0.8 |
61.82 |
0.9 |
|
Oats |
1.83 |
9.11 |
5.2 |
9.52 |
0.1 |
47.37 |
0.7 |
|
Sugar beets |
74.15 |
43.63 |
1.5 |
111.23 |
1.3 |
65.45 |
1.0 |
|
Peanuts |
98.75 |
74.18 |
1.4 |
138.25 |
1.6 |
103.85 |
1.5 |
|
Fall potatoes |
217.69 |
156.43 |
1.4 |
304.77 |
1.8 |
219.00 |
3.3 |
|
Total |
8,827 |
6,711 |
|||||
|
Source: Per acre expenditures by crop from Economic Research Service (1999b).Crop Area from USDA (1999a). Total chemical aand seed expendituresfrom Economic Research Service (1999b). |
|||||||
TABLE A.3 Gene Function and Crops Involved in Transgenic Field Trials, 1987-May, 1999
|
Public |
Private |
|||
|
Gene Function (Agronomic Crops Only) |
Number |
Percent |
Number |
Percent |
|
Agronomic properties |
39 |
5 |
374 |
6 |
|
Herbicide tolerance |
55 |
8 |
2203 |
38 |
|
Insect resistance |
84 |
12 |
1838 |
32 |
|
Virus resistance |
184 |
25 |
447 |
8 |
|
Fungal resistance |
61 |
8 |
272 |
5 |
|
Product quality |
145 |
20 |
1434 |
22 |
|
Marker gene |
75 |
10 |
135 |
2 |
|
Nematode resistance |
9 |
1 |
4 |
< 1 |
|
Bacteria resistance |
53 |
7 |
13 |
< 1 |
|
Other |
55 |
8 |
142 |
2 |
|
Total reporting trait |
725 |
5791 |
||
|
Crop (All Plants) |
||||
|
Corn |
81 |
11 |
2708 |
47 |
|
Cotton |
11 |
2 |
488 |
8 |
|
Potato |
178 |
25 |
539 |
9 |
|
Rapeseed |
18 |
2 |
216 |
4 |
|
Rice |
22 |
3 |
73 |
1 |
|
Soybeans |
15 |
2 |
683 |
12 |
|
Tobacco |
162 |
22 |
92 |
2 |
|
Tomato |
85 |
12 |
541 |
9 |
|
Wheat |
19 |
3 |
61 |
1 |
|
Other |
135 |
19 |
395 |
7 |
|
Total reporting crop |
726 |
5796 |
||
|
Source: USDA (1999c). APHIS data from 1987 to May, 1999. |
||||
beans, cotton, and wheat comprise the largest farm sector markets for pesticides, accounting for approximately 60% of total pesticide expenditures (table A.2).
A recent wave of mergers and acquisitions in the seed and agrichemical industries has engendered concern about increasing concentration and its potential impacts on the seed industry and on agricultural R&D more broadly. A number of large agrichemical firms have merged or are merging (table A.4). In addition, the major agrichemical firms have been purchasing agricultural biotechnology and seed firms. Agricultural biotechnology appears to be the principal motivation for mergers and acquisitions in the latter category. Agrichemical firms have several distinct incentives for integrating vertically into the seed industry.
First, genetic engineering creates economies of scale and scope in breeding new varieties. Once identified, single genes can be introduced
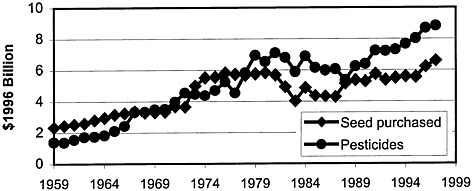
FIGURE A.1 Trends in real (constant dollar) seed and pesticide sales, 1959-1997 Source: Economic Research Service (1999b).
into a number of crops and crop varieties to obtain desired common characteristics (such as the resistance to lepidopteran insects provided by genes that express Bacillus thuringiensis (Bt) toxins). Discovering novel genes can cost millions, while inserting the genes into germplasm can cost $10,000-200,000 per gene, depending on the crop.2 Once a gene has been introduced into a crop line, however, it can be bred into many varieties at no additional cost beyond the normal cost of breeding a new variety. Companies offering a larger number of varieties of a single crop can thus reap economies of scale from a line that contains a gene of interest. Possession of a novel gene, and the specialized knowledge obtained from developing it and breeding it into crops, can lower the cost of inserting the gene into new crops and breeding varieties from the original germplasm. Thus, companies that sell seeds for a large number of crops can reap economies of scope. Furthermore, plant breeding offers new product areas in which to apply proprietary genetic-engineering methods and general expertise derived from pharmaceutical development (that is, economies of scope in the use of human capital and equipment).
Second, genetic engineering may also allow agrichemical firms to
|
2 |
Information for estimating the costs of breeding new varieties was obtained from conversations with the following people and their cooperation is greatly appreciated. However, the author is solely responsible for the final estimates. Carlos Quiros, University of California at Davis (celery) Walt Fehr, Iowa State University, James Orf, University of Minnesota and Bill Kenworthy, University of Maryland (soybeans) Deon Stuthman and Don Rasmussen, University of Minnesota (small grains) Stephen Baenziger, University of Nebraska (wheat) Harry Swarz, University of Maryland (small fruits). |
TABLE A.4 Mergers and Acquisitions in Agricultural Chemicals, Biotechnology, Seed, and Food or Feed
|
Agricultural Chemicals |
Biotechnology |
Seed |
Food or Feed |
|
|
Monsanto |
|
|
|
|
|
AgrEvo (Aventis) |
|
|
|
|
|
Rhone-Poulenc (Aventis) |
|
|
||
|
Novartis |
|
|
|
|
|
Dow Chemicals |
|
|
|
|
|
Novartis |
|
|
|
|
|
Dow Chemicals |
|
|
|
|
|
Zeneca/Astra |
|
|
||
|
DuPont |
|
|
|
|
|
Empresas La Moderna/Seminis Monsanto in 1997) |
|
|
|
|
|
Source: Brennan et al. (1999). |
||||
augment their product lines in novel ways. For example, Monsanto and AgrEvo have pursued development of herbicide-tolerant crop varieties as a means of enhancing sales of their chemical herbicides.
Third, agrichemical companies' interest in transgenic crops might have been spurred by deceleration in the introduction of new chemical pesticides. The number of new chemical pesticide products registered provides a rough measure of R&D productivity in the years preceding registration. If the average number of products registered per active ingredient remains constant over time, then the number of new products registered will be proportional to the number of new active ingredients introduced into the market. The numbers of new chemical herbicide, insecticide, and fungicide formulated products registered have been lower on average in recent years than in the past (figure A.2). The average annual number of new formulated products of each type introduced in 1990-1998 was about half the average during each of the 2 preceding decades.
Fourth, regulation of chemical pesticides under FIFRA and public controversies over the use of pesticides may have made investment in transgenic crops more attractive. In 1993, EPA estimated that meeting data requirements for registering a chemical pesticide cost $10.6 million; that corresponds to a cost of $11.7 million in 1998 dollars. Meeting data requirements for transgenic pest-protected plants, by contrast, has been estimated to cost between $0.07-1.17 million in 1998 dollars, depending on the source of the pesticidal substance, the presence of wild relatives in the United States, and the extent of information available on the characteristics and function of the gene(s) introduced (EPA 1994d). Currently commercialized transgenic pest-protected plants feature more efficient targeting of pests than chemical pesticides and thus have the potential for less-extensive offsite and nontarget impacts.
The wave of consolidation has raised two kinds of economic concerns about potential loss of competition. First, increased concentration might allow firms in the agricultural-supply industry to exert market power, reducing farm income and increasing food prices. Second, increased concentration might lead firms to reduce R&D and thus dampen growth in agricultural productivity. The principal incentive for reducing R&D is to protect sales of existing products. Just and Hueth (1997), however, have noted that the opposite incentive holds when new products are complements of existing ones. In that case, new products increase demand for existing ones, so that introducing them leads to increased profit. As a result, firms with market power might engage more heavily in R&D than firms in a more competitive market would. Herbicide-tolerant crops are a good example of such a new product. Such crop varieties as Roundup Ready or Liberty Link corn or soybeans allow farmers to substitute
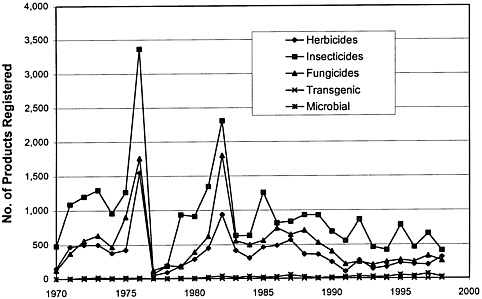
FIGURE A.2 New Formulated Pesticide Products Registered, 1970-1998. Source: EPA 1999d.
Monsanto's or AgrEvo's herbicides for those sold by their competitors, increasing Monsanto 's and AgrEvo's overall profit.
While concentration appears to be increasing in a number of major seed markets (see below), it is not clear whether this increase in concentration is attributable to the wave of recent mergers. The seed industry underwent a similar wave in the late 1970s, as petrochemical companies (Shell and Arco), pharmaceutical manufacturers (Ciba-Geigy, FMC, Pfizer, Sandoz, and Upjohn), and other chemical firms (W.R. Grace) acquired both biotechnology firms and seed companies (McMullen 1987; Kloppenburg 1988; Hayenga and Kimle 1992). Agricultural biotechnology and the prospect of expanding markets for US farm exports were principal motivations. The fall in farm exports and the ensuing farm financial crisis of the 1980s led petrochemical and specialty-chemical firms to leave this industry and to sell their biotechnology and seed subsidiaries to agrichemical companies. Some pharmaceutical firms also left the agrichemical business to concentrate on human-health and veterinary products. As a result, some of the current wave of mergers consist of changes in parent companies rather than new consolidation.
Two measures are widely used to determine the degree of concentration in an industry. The four-firm concentration ratio (C4) is the sum of the shares of total sales in an industry accounted for by the four largest firms in the industry. The Herfindahl-Hirschman Index (HHI) is the sum of the squared percentages of the industry's total sales accounted for by
the individual firms in the industry. If the industry is completely monopolized, the HHI is at its maximum, 10,000. If there are N firms in the industry, each with an equal share of sales, the HHI equals 10,000/N. As the number of firms in the industry increases, the HHI falls toward zero. The HHI is the preferred measure of concentration because under some conditions it is proportional to the markup of price over marginal cost and so indicates the excess profit due to the exercise of market power (Cowling and Waterson 1976). The US Department of Justice considers an HHI over 1,800 to indicate market concentration worthy of consideration for potential antitrust action.
Published US data are available on four major seed markets—corn, soybeans, cotton, and vegetables. Published estimates of corn seed market shares of the 6-10 leading firms are available for about half the years since 1973—before the first merger wave that affected the US seed industry (table A.5). The market has become more concentrated, but the increase in concentration, is due almost entirely to increases in the market share of a single firm, Pioneer Hi-Bred (acquired in 1999 by DuPont), rather than to mergers and acquisitions. Published estimates of soybean-seed market shares are available for 1988 and 1997 (table A.6). Taking into account the market share of farmer-saved seed, it appears that the most recent mergers and acquisitions have increased concentration in this market, although the degree of concentration is still not high. The US cotton-seed market is highly concentrated because a single firm, Delta and Pine Land, controls 70-75% of total sales (Hayenga 1998). Data on market shares of the top two firms alone reported by Hayenga (1998) imply an HHI of at least 5,300, which indicates a high degree of concentration. As with corn, however, the concentration predated Monsanto's entry into the industry and remains unaffected by the termination of the proposed Monsanto-Delta and Pine Land merger. The vegetable seed-market also appears highly concentrated. The Mexican conglomerate Empresas La Moderna (ELM) accounts for about 40% of US vegetable-seed sales, and mergers and acquisitions have given the agrichemical firm Novartis a market share about half that of ELM (Friedland and Kilman 1999). Both companies have built their market share primarily through mergers and acquisitions. In this case, mergers and acquisitions do appear to have resulted in increased concentration.
Estimates of pesticide market shares were not publicly available. However, markets for some specific pesticides tend to exhibit substantial concentration. For example, Hayenga (1998) estimates that in 1998 the top four firms accounted for about 80% each of sales for soybean, corn, and cotton herbicides.
Publicly available data are insufficient to determine whether all possible seed markets exhibit concentration. The fragmentary data that are available do not clearly indicate that the current merger wave has re-
TABLE A.5 Concentration in the US Corn-Seed Market, 1973-1997
|
Market Sharesa |
||||||||||||
|
Company |
1973 |
1975 |
1977 |
1978 |
1979 |
1980 |
1981 |
1982 |
1983 |
1988 |
1996 |
1997 |
|
Pioneer |
23.8% |
24.6% |
30.9% |
26.2% |
32.9% |
36.9% |
35.0% |
38.8% |
38.1% |
35.0% |
41.0% |
42.0% |
|
Monsanto |
14.0% |
|||||||||||
|
DeKalb |
21.0% |
18.8% |
15.8% |
17.9% |
13.3% |
13.0% |
13.9% |
12.2% |
10.3% |
9.0% |
10.1% |
|
|
Asgrow |
3.1% |
2.0% |
||||||||||
|
Trojan |
5.9% |
6.8% |
4.2% |
5.4% |
3.8% |
2.0% |
||||||
|
Novartis |
9.0% |
|||||||||||
|
Northrup-King |
6.1% |
4.7% |
3.8% |
3.3% |
3.8% |
4.9% |
2.8% |
2.6% |
2.5% |
4.5% |
5.0% |
|
|
Funk |
8.8% |
8.9% |
6.4% |
8.1% |
6.7% |
5.7% |
5.8% |
5.2% |
3.9% |
3.4% |
||
|
Ciba |
3.1% |
|||||||||||
|
Zeneca/ICI |
3.4% |
2.9% |
||||||||||
|
Aventis |
7.0% |
|||||||||||
|
Cargill |
4.8% |
3.9% |
4.1% |
4.6% |
3.3% |
4.7% |
5.8% |
5.4% |
4.2% |
3.9% |
3.3% |
|
|
Dow/Mycogen |
1.4% |
4.3% |
4.0% |
|||||||||
|
Jacques/Agrigenetics |
1.7% |
1.9% |
2.1% |
2.7% |
2.2% |
1.8% |
||||||
|
Golden Harvest |
1.8% |
2.5% |
3.1% |
2.9% |
1.3% |
2.8% |
2.3% |
2.6% |
2.5% |
2.3% |
4.0% |
|
|
Other |
29.6% |
29.8% |
30.4% |
29.3% |
30.6% |
29.3% |
33.9% |
33.6% |
38.4% |
32.0% |
25.6% |
20.0% |
|
C4 |
59.7% |
59.1% |
57.3% |
57.6% |
56.7% |
60.5% |
60.5% |
61.6% |
56.5% |
52.4% |
60.4% |
72.0% |
|
HHI |
1,180 |
1,127 |
1,304 |
1,148 |
1,360 |
1,620 |
1,501 |
1,723 |
1,604 |
1,386 |
1,865 |
2,122 |
|
a Except C4 and HHI. Source: Data for 1973-1983 cited in McMullen (1987), Data for 1988 fromHayenga and Kimle (1992). Data for 1996 from Kalaitzandonakes (1997).Data for 1997 from Hayenga (1998). |
||||||||||||
TABLE A.6 Concentration in the US Soybean-Seed Market
sulted in a significant increase in concentration in major seed markets — such as those for corn, soybean, and cotton in the United States —or the overall world seed market. It remains possible that concentration has increased significantly in specific submarkets, such as corn seed in a specific growing region, or in markets for crops with smaller planted area. Moreover, firms might be able to exercise market power because of their ownership of key inputs into seed production, such as gene-insertion techniques, genes for herbicide tolerance or proteins that confer pest resistance, or germplasm from widely used inbred lines.
Similarly, it is not clear whether vertical integration of seed companies into agrichemical companies has increased concentration in the crop-protection market. For example, the introduction of herbicide-tolerant crops has increased Monsanto's share of the markets for herbicides on corn, soybeans, and cotton while reducing the share of the market leaders, thereby reducing the degree of concentration in these markets. In 1996, American Cyanamid and DuPoint accounted for an estimated 60% and 20%, respectively, of soybean-herbicide sales. The availability of Roundup Ready soybeans has cut those market shares in half and led
both companies to cut herbicide prices (Kilman 1999). Similarly, the introduction of Bt corn and cotton has increased competition in the markets for corn and cotton insecticides and led to insecticide-price cuts.
By the same token, competition from chemical pesticides limits the extent to which firms can exercise market power in the sales of transgenic pest-protected plants. Adoption of Bt cotton, for example, has been limited in areas where insecticide costs have traditionally been low, notably where insect pressure has traditionally been low. As a result, Monsanto's sales of and profit from Bt cotton have been high mainly in Alabama, Mississippi, Georgia, and Florida (Falck-Zepeda et al. 1999).
There appear to be relatively few firms (less than 50) presently engaged in R&D on transgenic crop protection (including microbials and biological controls in addition to transgenic pest-protected crops). Genetic Engineering News (1998) estimated that in 1997 there were 492 companies worldwide engaged in agricultural biotechnology and 186 in pesticide biotechnology. Roughly 45-50 were engaged in breeding plants with pesticidal, growth-regulator, or other traits regulated under FIFRA; nine of these were large multinationals (inclusive of subsidiaries). The National Biological Impact Assessment Program housed at the Virginia Polytechnic Institute lists about 45 US companies in engaged in pesticide biotechnology R&D, of which 11 are major multinationals (inclusive of subsidiaries), and about half the remainder appear to be small startup companies that have fewer than 20 employees.
There is some evidence that the recent wave of mergers and acquisitions has increased concentration in transgenic-plant R&D, at least at the late pre-commercialization stages measured by field trial activity. In 1988-1998, the four leading firms accounted for 63-87% of field trials approved each year. In 1998, the four leading firms—Monsanto, AgrEvo, Pioneer Hi-Bred, and DuPont—accounted for 79% of approved field trials. Mergers and acquisitions in the industry raised the HHI for field trials in 1998 from 1,608 to 2,182 (Brennan et al. 1999).
A.5 COSTS OF REGULATING TRANSGENIC PEST-PROTECTED PLANTS
All transgenic pest-protected plant products will be subject to some level of regulatory oversight prior to commercialization, regardless of whether EPA's proposed rule regulating them as “plant pesticides” is implemented. In most instances, commercialization requires clearance from USDA in the form of a determination of nonregulated status under the Federal Plant Pest Act. Foods derived from transgenic plants, including those with novel elements such as compounds with pesticidal or growth-regulator activity, are subject to review by FDA through its vol-
untary consultation process. It should be noted, however, that FDA has the authority to require formal pre-market review in any case where it is deemed necessary by the agency. This review could take the form of a food additive petition or a GRAS clearance process, both of which are designed to demonstrate the safety of any added substances (see chapter 1 and chapter 4).
A.5.1 Regulatory Costs
Regulation of pesticidal substances in transgenic pest-protected plants as plant-pesticides by EPA will probably involve more extensive provision of data prior to commercialization and will therefore be more expensive than regulation by APHIS or oversight under FDA's consultation process. There are two reasons for the likely extra cost:
-
EPA will review pesticidal substances in transgenic plants for potential health and environmental effects not considered by USDA-APHIS or FDA, including acute and chronic toxicity to nontarget organisms (both vertebrate and invertebrate), potential for water pollution, and similar types of environmental effects.
-
EPA tends to rely more heavily on test data than USDA-APHIS and tends to require more extensive premarket submission of data than that submitted to FDA under the consultation process.
In 1993, EPA estimated that the costs of testing plant-pesticides would be around $64,000-1,070,000, depending on the origin of the pesticidal substance, the presence of wild relatives, and the extent of available information on the characteristics and function of the gene(s) involved (EPA 1994d). Those estimates are based on experience with such products as Bt and viral coat proteins and are therefore likely to understate the costs of testing new generations of products. Current transgenic pest-protected plants do not create exposures of a qualitatively new type: viral coat protein is present naturally in most plants, and Bt has been used in microbial form for a long time and is a familiar product. New generations of products, in contrast, will probably use less familiar proteins, so one would expect EPA to require more extensive testing of future transgenic pest-protected plant products.
EPA's estimates of testing costs also underestimate the costs of regulatory compliance because they ignore the cash costs and implicit costs of management time needed for overseeing the regulatory process and interacting with EPA staff. Those costs are likely to be higher for smaller entities, such as biotechnology startup companies, small to medium seed companies, and public-sector breeders. Major agrichemical firms have staff
dedicated to regulatory affairs who have extensive familiarity with the regulatory process and EPA staff; smaller entities do not. The incremental cost of complying with regulation of a single new product is thus considerably less for major agrichemical companies than for small entities.
EPA's published estimates of testing costs (EPA 1994d) were used to estimate the costs of meeting potential testing requirements imposed by USDA-APHIS regulation, safety reviews and data submissions under the FDA consultation process, as well as testing under pesticide regulation (table A.7). EPA's figures were converted to 1998 dollars by using the implicit GDP price deflator reported by the Council of Economic Advisers (1999). EPA estimates of Tier II and III testing costs for microbial pesticides were used to estimate potential costs of further testing new, unfamiliar products for human health effects and mammalian toxicity. EPA's estimated costs of providing material for testing for biological fate were then added.
Baseline data likely to be submitted to USDA-APHIS and FDA as well as EPA consists of product analysis (including crop residue), Tier I biological fate, acute oral toxicity, and digestibility for a total of about $20,000. Additional costs of regulating pesticidal substances in transgenic pest-protected plants as pesticides beyond that required for Bt and viral coat proteins would include the following:
-
Testing for effects on nontarget organisms. The cost of full batteries of tests ranged from about $76,000 for Tier I tests to over $410,000 for Tier I-III tests.
-
More extensive testing on biological fate. The cost of full batteries of tests ranged from about $46,000 for Tier II tests to over $735,000 for Tier II and III tests.
-
More extensive testing on human health and mammalian toxicity. The costs of testing ranged from about $10,000 for hypersensitivity and specific allergen screening to $1,667,000 for a full battery of testing, including Tier II and III toxicity testing.
Overall, then, according to EPA cost estimates the additional testing costs involved in regulating pesticidal substances in transgenic pest-protected plants as plant-pesticides (that is, the testing required by EPA beyond the data submitted to USDA-APHIS and FDA) could total as much as $2.8 million. As noted above, that total is modest compared with that for testing chemical pesticides. It might nevertheless be substantial relative to the cost of breeding new varieties and thus influence both the types of transgenic crops developed and entry by less well-capitalized entities. Moreover, EPA's estimates may understate the actual costs of conducting the required testing: Unpublished Monsanto estimates, for example, indi-
TABLE A.7 Estimated Costs of Regulatory Testing for Transgenic PestProtected Plants in 1998 Dollars
|
EPA Estimated Testing Costs |
Increment in Breakeven Expected Annual Sales |
|
|
Baseline data requirements: |
||
|
Product analysis, including crop residues |
$10,952 |
$2,417 |
|
Biological fate (basic) |
$1,923 |
$424 |
|
Acute oral toxicity and digestibility |
$7,240 |
$1,598 |
|
Total |
$20,115 |
$4,439 |
|
Biological fate: |
||
|
Tier IIa |
$45,647 |
$10,073 |
|
Tier IIIb |
$689,650 |
$152,182 |
|
Total |
$735,297 |
$162,255 |
|
Human health and mammalian toxicology: |
||
|
Hypersensitivity and specific-allergen testing |
$10,138 |
$2,237 |
|
Tier II (microbial)cs |
$276,948 |
$61,113 |
|
Tier III (microbial)d |
$1,379,795 |
$304,474 |
|
Total |
$1,666,881 |
$367,824 |
|
Nontarget organisms: |
||
|
Tier Ie |
$76,123 |
$16,798 |
|
Tier IIf |
$86,985 |
$19,195 |
|
Tier IIIg |
$248,187 |
$54,767 |
|
Total |
$411,295 |
$90,759 |
|
a tests for hybrid and pollen viability b tests for selective advantage (host range and growth and development) and dispersion (including field testing) c tests for acute and subchronic toxicity/pathogenicity d tests for reproductive effects, oncogenicity, immunodeficiency, and primate infectivity/ pathogenicity e tests for honey bee toxicity, avian oral LD50, avian dietary LC50, and nontarget insect effects. f tests for freshwater fish LC50, acute freshwater organisms EC50, and acute estuarine and marine organism LC50. g tests for avian reproduction |
||
cate that the costs of providing data to meet regulatory requirements for Bt corn amounted to nearly $3.8 million in addition to 21.5 person-years of staff time.
If pesticidal substances in transgenic plants were not considered pesticides for purposes of FIFRA and the FFDCA, it is possible that the costs associated with the FDA process would increase. In particular, for at least
some of these substances, FDA might well require submission of a formal food additive petition or data equivalent to that required for such a petition in order to demonstrate that any added substances were GRAS. The costs associated with such a submission would depend on the amount and type of data required to demonstrate safety at the anticipated level of exposure. In 1997, FDA estimated the costs of data requirements for food additive petitions using surveys from four food companies (FDA 1997b). Adjusted to 1998 dollars using implicit GDP price deflator reported by the Council of Economic Advisors (1999), these costs ranged from $174,787 to $1,359,456. Comparing these costs to the costs estimated in table A.7 for EPA data requirements under FIFRA and FFDCA, the additional cost associated with the EPA process would be in the range of $1.5 to $2.6 million. In the event FDA were to require an environmental assessment (EA) under NEPA in conjunction with the food additive petition, the costs of developing data to support the EA might fall in the range of $2500 to $50,000 (FDA 1997a), which would reduce the additional cost of the EPA process by the same amount
A.5.2 Comparison of Regulatory Costs to Costs of Breeding a New Variety
To assess the extent to which regulation might discourage R&D related to crops that would have small potential markets and R&D by smaller entities, I compare the potential costs of meeting regulatory requirements with the fixed costs of breeding a new variety. I ignore the variable costs of producing seed for commercial sale, which depend on the size of the market. I consider only the costs of developing a crop to the point where it would be ready to scale up production for commercial sale. The costs of regulatory compliance are a form of fixed cost in that regulatory approval is needed before commercialization. It is thus appropriate to compare regulatory compliance costs with the fixed costs of breeding a new variety.
The costs of crop breeding depend on the costs of running a breeding operation, the time required to develop a new variety sufficiently for market introduction, and the success rate of new varieties. A simple model can be used to indicate how those factors influence the cost of developing a new variety. Let C denote the cost of running a breeding facility for a year, including direct costs and overhead; for simplicity, C is assumed to be constant (in real terms). Let T be the expected time required to develop a variety to the point where it is marketable. Let N denote the average number of years between successful introductions of new varieties, so that an average of 1/N new varieties are introduced every year. Let r be the (real) interest rate. The average cost of a new
variety can be expressed as ![]() . For example, a breeding operation with a direct annual cost of $100,000 plus an overhead rate of 50%, facing a real interest rate of 4%, needing 10 years to develop a new variety, and introducing a new variety every 3 years would develop new varieties at an average cost of about $553,000 each.
. For example, a breeding operation with a direct annual cost of $100,000 plus an overhead rate of 50%, facing a real interest rate of 4%, needing 10 years to develop a new variety, and introducing a new variety every 3 years would develop new varieties at an average cost of about $553,000 each.
The literature contains few estimates of breeding costs. McMullen (1987) estimated that the average time to breed new varieties with traditional methods ranged from 7.5 years for corn and safflower to a high of 14-15 years for squash and watermelon and almost 19 years for cauliflower (table A.8). He cited published estimates indicating costs of around $1.5-3.0 million for developing a new crop variety, corresponding to $2.0-4.0 million in 1998 dollars. He estimated the direct cost of public breeding programs at around $250,000 ($340,000 in 1998 dollars) per year. The cost of introducing a new tomato variety has been estimated at $315,000-630,000 in 1998 dollars (NRC 1989).
Conversations with public-sector crop breeders indicate that the costs of new varieties can vary substantially. The cost of breeding a new small fruit (such as strawberry or raspberry) variety in a public program, calculating with the model presented above, appears to be about $200,000. Breeding soybeans appears to exhibit economies of scale, that is, the cost per variety is lower in larger programs. Large programs appear to breed new varieties at a cost of $215,000-285,000, small programs at about $550,000. The cost of breeding celery in a public program is about $425,000 per variety. The cost of breeding small grains is considerably higher: on the order of $2.1 million for oats and $2.8-3.0 million for wheat.
The preceding analysis ignores the cost of developing germplasm and considers only the cost of developing a new variety from existing germplasm. It was not possible to estimate the cost of developing new germplasm for use in breeding programs via traditional breeding methods or genetic engineering. That would require estimating the costs of screening germplasm and identifying useful traits and the costs and success rates of introducing identified traits into existing germplasm. None of those dimensions could be estimated for this study, although unpublished Monsanto estimates indicate that the total costs of developing Bt corn were in the range of $10 to $25 million, inclusive of germplasm development (molecular biology, gene expression, transformation) and development of commercial varieties (insect evaluation, event screening, field evaluation, and product development). In general, however, one would expect germplasm with useful traits to be used in developing a large number of varieties. As a result, the average per-variety cost of germplasm is likely to be small. For example, if Monsanto's Bt corn germplasm were used in 1,000 varieties, the average per variety cost of
TABLE A.8 Time Required for Traditional Breeding of New Crop Varieties
|
Crop |
Cross to Date of Determination, years |
Date of Determination to Application, years |
Total, years |
|
Barley |
7.0 |
3.4 |
10.4 |
|
Bean |
8.0 |
3.3 |
11.3 |
|
Cauliflower |
11.0 |
7.5 |
18.5 |
|
Corn |
5.5 |
2.0 |
7.5 |
|
Cotton |
8.0 |
4.2 |
12.2 |
|
Lettuce |
7.0 |
2.6 |
9.6 |
|
Oats |
8.8 |
2.1 |
10.9 |
|
Onion |
9.0 |
2.9 |
11.9 |
|
Peas |
7.0 |
4.0 |
11.0 |
|
Rice |
6.0 |
2.8 |
8.8 |
|
Safflower |
6.0 |
1.7 |
7.7 |
|
Soybean |
6.2 |
3.0 |
9.2 |
|
Squash |
11.0 |
3.7 |
14.7 |
|
Tobacco |
8.5 |
2.6 |
11.1 |
|
Tomato |
8.3 |
1.4 |
9.7 |
|
Watermelon |
8.5 |
5.0 |
13.5 |
|
Wheat |
8.0 |
2.8 |
10.8 |
|
Source: McMullen (1987). |
|||
that germplasm would be under $10-25,000 (once varietal development costs were subtracted from Monsanto's estimate).
Conversations with specialists in the field indicate that, once a novel gene is identified, inserting it into crop germplasm via genetic engineering could cost $10,000-200,000. If it is used for a single variety only, the model presented above indicates that the additional gene could increase the fixed cost of breeding a new variety by $37,000-690,000. Once present in germplasm, however, the gene is available for use in multiple crosses, as is any other germplasm used in breeding. For example, genes for single Bt toxins have already been used in dozens of crop varieties. The gene is likely to be used in multiple varieties, so the increase in the fixed cost of breeding will generally be considerably lower because the cost per variety decreases geometrically with the number of varieties in which the gene is used.
Developing a new variety will be economically viable if the present value of its sales at least covers the cost of development. Thus, expected annual sales of the variety and its expected lifetime in the market will influence R&D decisions. Let S denote expected annual sales of the variety, assumed constant (in real terms) for simplicity, and D denote the
expected lifetime in the market. Then the breakeven level of expected annual sales needed to justify development of a variety is ![]() . As an example, suppose that the varieties of each of the crops mentioned above lasted 5 years in the market (varieties of soybean, oats, and wheat have had average market lifetimes of 3-5 years recently.) At a real interest rate of 4%, breakeven annual sales would be about $45,000 for small fruits, $47,000-120,000 for soybean, $70,000-140,000 for tomatoes, $94,000 for celery, $465,000 for oats, and $620,000-660,000 for wheat.
. As an example, suppose that the varieties of each of the crops mentioned above lasted 5 years in the market (varieties of soybean, oats, and wheat have had average market lifetimes of 3-5 years recently.) At a real interest rate of 4%, breakeven annual sales would be about $45,000 for small fruits, $47,000-120,000 for soybean, $70,000-140,000 for tomatoes, $94,000 for celery, $465,000 for oats, and $620,000-660,000 for wheat.
The model indicates that developing new varieties will be more attractive economically when the development time T is shorter, the success rate is greater (N is smaller), and the variety is expected to last longer on the market (D is greater).
Use of genetic engineering will increase the size of the market needed to break even. The following procedure was used to estimate the increment in breakeven annual sales. If K denotes the per-variety cost of transgene insertion, transgene insertion increases breakeven annual sales needed to justify development of a new variety by ![]() . The model indicates that this increment in breakeven sales is greater when the transgene-insertion cost, K, is higher and the expected lifetime of the variety on the market D is shorter. If a transgene is used for only a single variety, it will increase breakeven annual sales by $8,000-152,000. A gene will probably be used for more than one new variety, so the actual increment in breakeven annual sales will generally be considerably smaller, as noted above.
. The model indicates that this increment in breakeven sales is greater when the transgene-insertion cost, K, is higher and the expected lifetime of the variety on the market D is shorter. If a transgene is used for only a single variety, it will increase breakeven annual sales by $8,000-152,000. A gene will probably be used for more than one new variety, so the actual increment in breakeven annual sales will generally be considerably smaller, as noted above.
The same procedure can be used to estimate the impact of regulatory compliance costs on breakeven sales. In this case, K represents regulatory testing costs, which are assumed to be incurred in a lump sum at the time of product introduction. As before, I assume a product lifetime of 5 years and a real interest rate of 4%. Baseline data likely to be required under any form of regulation would probably increase the breakeven expected annual sales needed to justify R&D investment by only $4,400 (table A.7). EPA's estimates based on viral coat proteins and Bt crops indicate increments in breakeven sales of around $14,000-236,000. Regulation of transgenic pest-protected plant products with novel, unfamiliar genes as pesticides could increase breakeven sales by $620,000 or more (table A.7).
A.6 SUMMARY
Regulating pesticidal substances in transgenic pest-protected plants as pesticides could create substantial barriers to R&D related to minor-use crops and to entry by small entities. Baseline regulatory testing requirements appear to impose relatively low additional fixed costs on the commercialization of new crop varieties. The fixed costs of complying
with pesticide regulatory-testing requirements, in contrast, are quite large relative to the fixed costs of developing new crop varieties. For example, the estimates presented here suggest that the sales volume needed to offset the cost of regulatory testing under FIFRA is almost triple the sales volume needed to meet the cost of developing a new variety of wheat from existing germplasm and 14 times the sales volume needed to meet the cost of developing a new small fruit variety from existing germplasm. As a result, regulating transgenic pest-protected plant products as “plant-pesticides” is likely to increase the expected annual sales needed to justify R&D investment substantially, making R&D related to crops with small seed markets less attractive and making it more difficult for smaller, less well-capitalized entities to enter the market.


