
3
PROJECT EVALUATIONS
As noted in the introduction, respondents were asked in Part 2 of the questionnaire to evaluate the design-build projects reported on by comparing them to similar projects carried out under the traditional design-bid-build process, in terms of the following factors:
Functionality
User satisfaction
Quality of design
Quality of materials
Quality of workmanship
Overall quality
Cost of planning and programming
Cost of agency contract administration
Cost of design
Cost of construction
Overall costs
Number of change orders
Extent of other contract problems
Time required for planning and programming
Time required for design
Time required for construction
Time required overall
Specifically, respondents were asked to indicate for each factor whether the design-build project was “much worse,” “somewhat worse,” “about the
same,” “somewhat better,” or “much better” than a similar project procured through the traditional approach.
In this chapter, the committee summarizes the evaluations of the respondents and discusses inferences that can be drawn from the evaluations. Specifically, in the first section below the committee discusses the general or overall views of the respondents about the design-build approach. In subsequent sections the committee analyses whether--based on the results of the survey--the design-build approach appears to be more appropriate in some situations than others or more successful when carried out in some ways than others.
Summaries of the 27 questionnaires on which the evaluations are based are presented in Appendix A. Tables presenting the results of various analyses the committee made are presented in Appendix B.
In order to analyze the respondent's subjective evaluations based on the phrases “much worse,” “somewhat worse,” etc., the committee needed to translate the respondent's verbal ratings into numerical equivalents. It did this by assigning the following weighting factors to the verbal ratings: 0 for much worse 2.5 for somewhat worse 5 for about the same 7.5 for somewhat better and 10 for much better. The committee used these numerical equivalents in making the various analyses discussed below and in the Appendixes.
GENERAL/OVERALL VIEWS
To get a broad view of how the respondents generally felt about their design-build projects, the committee prepared the overall summary, covering all 27 projects, presented in Table 1. The key results--shown in the last column on the right--are the average ratings, on a scale of 0 to 10, for the factors in the first column. Like the verbal ratings on which they are based, the numerical ratings are in comparison to traditional construction projects. The numerical ratings cannot be translated precisely back into verbal ratings; however, the approximate translations are as follows:
0 to 2 means much worse;
2 to 4 means somewhat worse;
4 to 6 means about the same;
6 to 8 means somewhat better; and
8 to 10 means much better.
The ratings indicate that the design-build approach was judged to be at least as good as the traditional approach in all respects except one: the time required for planning and programming, for which it was judged to be somewhat worse. Overall, the respondents gave the design-build approach a
6.41 rating, meaning somewhat better than the traditional approach.
TABLE 1. Subjective Assessments of All 27 Design-Build Projects Reported on--in Comparison to Similar Traditional Projects
|
Number of responses (N) & weighted values (WV)2 |
Average rating (scale of 0 to 10) |
|||||||||||
|
Much worse |
Somewhat worse |
About the same |
Somewhat better |
Much better |
||||||||
|
N |
WV |
N |
WV |
N |
WV |
N |
WV |
N |
WV |
|||
|
Functionality |
0 |
0 |
2 |
5.00 |
18 |
90.00 |
7 |
52.50 |
0 |
0.00 |
5.46 |
|
|
Users Satisfaction |
0 |
0 |
3 |
7.50 |
9 |
45.00 |
7 |
52.50 |
6 |
60.00 |
6.60 |
|
|
Quality |
Design |
1 |
0 |
2 |
5.00 |
11 |
55.00 |
8 |
60.00 |
1 |
10.00 |
5.65 |
|
Materials |
0 |
0 |
5 |
12.50 |
11 |
55.00 |
4 |
30.00 |
3 |
30.00 |
5.54 |
|
|
Workmanship |
1 |
0 |
2 |
5.00 |
13 |
65.00 |
4 |
30.00 |
3 |
30.00 |
5.65 |
|
|
Overall |
0 |
0 |
4 |
10.00 |
15 |
75.00 |
6 |
45.00 |
1 |
10.00 |
5.38 |
|
|
Costs |
Planning & Prog. |
1 |
0 |
5 |
12.50 |
3 |
15.00 |
1 |
7.50 |
10 |
100.00 |
6.75 |
|
Contract Admin. |
1 |
0 |
12 |
30.00 |
4 |
20.00 |
1 |
7.50 |
6 |
60.00 |
4.90 |
|
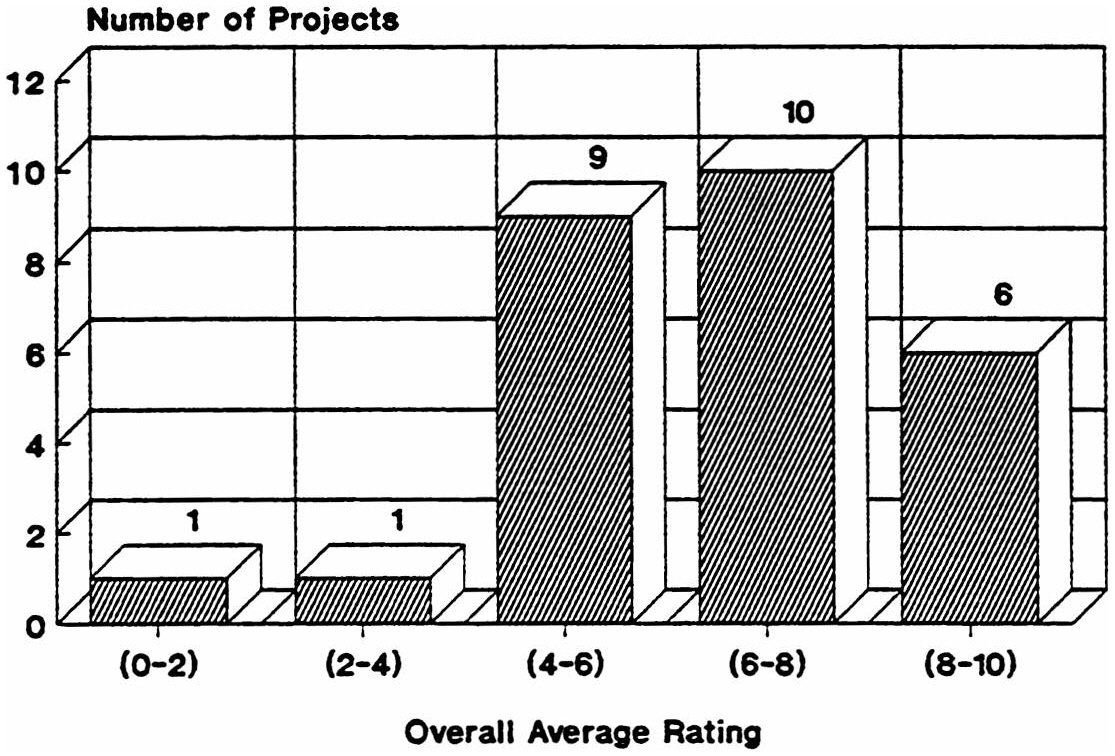
Figure 1. Distribution of overall Average Ratings (See Appendix A)
The generally favorably experiences of the respondents with the design-build approach is also illustrated by the histogram in Figure 1, which shows the number of design-build projects receiving various overall ratings in comparison to traditional projects. As indicated, of the 27 projects reported on (see Appendix A), only one received a “much worse” overall rating and only one received a “somewhat worse” rating. Nine were judged to be “about the same” as traditional projects, 10 were rated “somewhat better” than traditional projects, and the other six were rated “much better” than traditional projects.
VIEWS ON SPECIFIC FACTORS
The views of the respondents with regard to specific factors relating to their experiences with the design-build approach also are summarized in Table 1. Figure 2 is a bar chart showing the respondents' average ratings of the design-build approach (in comparison to traditional projects) for functionality, user satisfaction, overall quality, overall costs, change orders, contract problems, and overall time. The results show that the design-build approach compares favorably with the traditional approach in all respects.
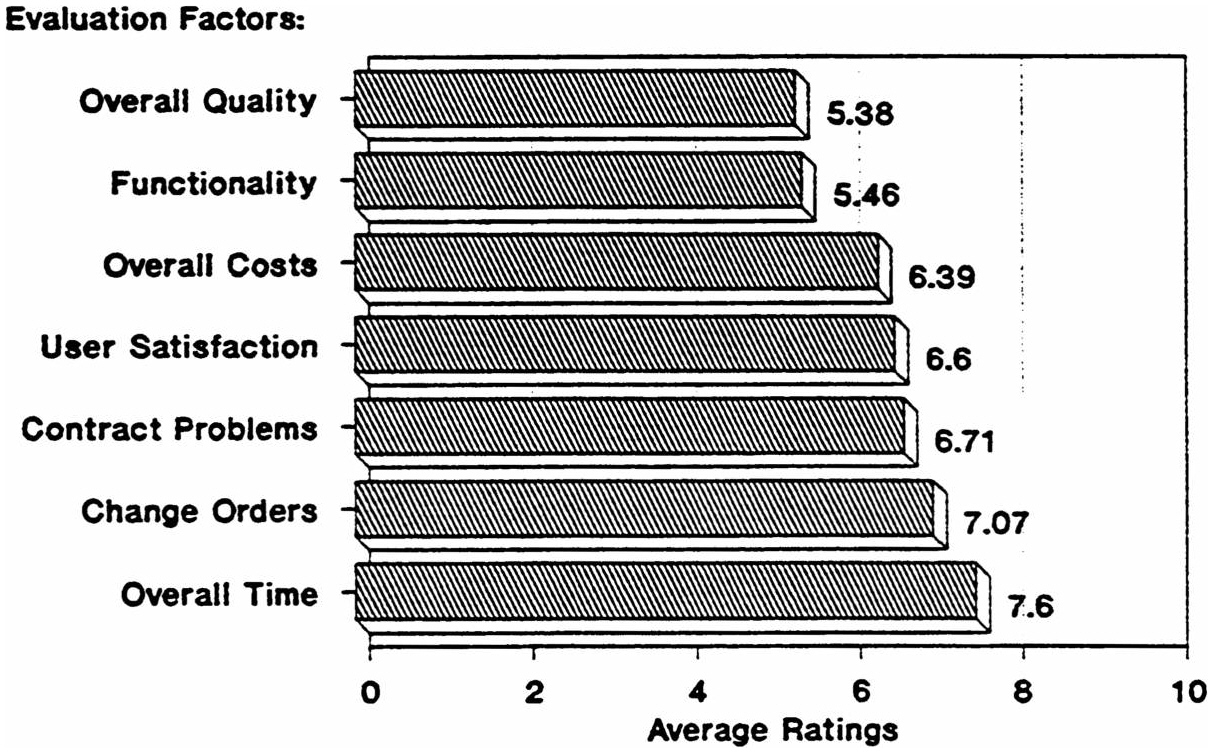
Figure 2 Average Ratings for Various Factors (See Table 1)
It will be noted that the design-build approach got particularly good marks with regard to the number of change orders experienced and the time required to design and construct a project. In fact, the design-build approach was judged less satisfactory than the traditional approach for only two subfactors: the cost of contract administration and the time required for planning and programming.
DOES THE TYPE OF FACILITY BEING CONSTRUCTED MAKE A DIFFERENCE?
To determine whether the type of facility being constructed affects how well the design-build approach works, the committee calculated the average overall ratings for two sub-categories of facilities in its sample (office buildings and industrial/laboratory buildings) and compared the results with the average rating for the entire sample. Office buildings and industrial/laboratory buildings were used as the sub-categories because they represented a large enough sub-sample to give meaningful averages. The analyses are shown in Appendix B; specifically, Table B-1 shows the average for seven office buildings, and Table B-2 shows the averages for six industrial/laboratory buildings. The results are as follows:
Average overall rating for seven office buildings: 7.05
Average overall rating for six industrial/laboratory buildings: 7.44
Average overall rating for all 27 projects reported on: 6.41
Since it is often asserted that the design-build approach is more appropriate for uncomplicated facilities like office buildings, the committee was not surprised that the average rating for office buildings was higher than the average rating for all projects, However, the committee was surprised that the average rating for industrial/laboratory buildings was higher since such facilities are usually assumed to be relatively complex.
To further test the hypothesis that the design-build approach is less appropriate for complicated projects, the committee determined the average rating for 12 projects that the respondents had characterized as highly complex. As indicated in Table B-3, the average overall rating for such projects was found to be 5.95, which is, of course, significantly less than the average for industrial/laboratory buildings and slightly less than the average for all projects reported on. This suggests that (a) industrial and laboratory buildings are not necessarily more complex than other buildings, and (b) there might be some validity to the hypothesis. However, the difference in the overall rating of complex projects and all other projects is so slight that it can almost be ignored. Furthermore, the complex projects carried out under the design-build approach were still rated as better than comparable projects carried out under the traditional approach. The evidence indicates, therefore, that there is no reason to avoid using the design-build approach for any particular type of facility.
DOES THE LOCATION OF THE PROJECT MAKE A DIFFERENCE?
To determine whether the location of a project affects how well the design-build approach works, the committee calculated the average overall ratings for four location-related groups of facilities in its sample--a group of six projects located in Florida, a group of three projects located in Washington (state), a group of four projects located in California, and a group of four projects located in New York--and compared the results with the average rating for the entire sample. The four groups were selected for analysis because they were the only groups of multiple projects in a common location. The analyses are shown in Appendix B; specifically, Table B-4 shows the average for six NASA projects in Florida, Table B-5 shows the average for three USPS buildings located in Washington, Table B-6 shows the average for three DVA and one Jet Propulsion Laboratory buildings located in California,
and Table B-7 shows the average for three GSA and one USPS buildings located in New York. The results are as follows:
Average overall rating for the six Florida projects: 8.90
Average overall rating for the three Washington projects: 5.83
Average overall rating for the four California projects: 6.96
Average overall rating for the four New York projects: 3.75
Average overall rating for all 27 projects reported on: 6.41
Although the results indicate a strong correlation between project location and results obtained with the design-build approach, the committee has doubts that the correlation actually exists. The problem is that all of the Florida projects were NASA projects, all the Washington projects were USPS projects, three out of four of the California projects were DVA projects, and three of the four New York projects were GSA projects. This raises the distinct possibility that the differences in the average ratings for the three groups are really due to differences in the way the three agencies carried out the projects and/or differences in the perceptions of the people who filled out the questionnaires. With regard to the New York projects, which got very low average marks, it should be noted that all four were costly projects--two cost more than $250 million each and one cost more than $100 million--and as discussed below, cost may be an important factor in the success of the design-build approach.
DOES THE AMOUNT OF THE CONTRACT MAKE A DIFFERENCE?
To determine whether the dollar amount of a design-build contract affects how well the approach works, the committee calculated the average overall ratings for three sets of projects grouped by contract amount--one group of 11 projects costing between $1 million and $10 million, a second group of eight projects costing between $10 million and $20 million, and a third group of seven projects costing more than $20 million--and compared the results with the average rating for the entire sample. The dollar ranges used to define the three groups were chosen because they were round numbers and created sub-samples of adequate size. The analyses are shown in Appendix B; specifically, Table B-8 shows the average for the 11 projects costing between $1 million and $10 million, Table B-9 shows the average for the eight projects costing between $10 million and $20 million, and Table B-10 shows the average for the seven projects costing more than $20 million. The results are as follows:
Average overall rating for the 11 projects costing between $1 million and $10 million: 6.91
Average overall rating for the eight projects costing between $10 million and $20 million: 6.79
Average overall rating for the seven projects costing more than $20 million: 4.81
Average overall rating for all 27 projects reported on: 6.41
The results suggest that the design-build approach might be increasingly less successful as the amount of the contract increases. However, the data are inadequate to show at what dollar amount the design-build approach might become less successful than the traditional approach. Undoubtedly it is influenced by many factors.
DOES THE TYPE OF CONTRACTOR MAKE A DIFFERENCE?
To determine whether the type of contractor selected for a design-build project affects how well the approach works, the committee calculated the average overall ratings for three sets of projects in its sample grouped by the type of contractor used--one group of three projects carried out by firms specializing in design-build projects, another group of nine projects carried out by teams consisting of a general contractor and an architect-engineer (A-E) firm, and a third group of 10 projects carried out by general contractors--and compared the results with the average rating for the entire sample.
The analyses are shown in Appendix B; specifically, Table B-11 shows the average for the three projects carried out by design-build specialists, Table B-12 shows the average for the nine projects carried out by general contractor/A-E teams, and Table B-13 shows the average for the 10 projects carried out by general contractors. The results are as follows:
Average overall rating for the three projects carried out by design-build specialists: 7.14
Average overall rating for the nine projects carried out by general contractor/A-E teams: 5.66
Average overall rating for the 10 projects carried out by general contractors: 7.32
Average overall rating for all 27 projects reported on: 6.41
The results indicate that the best results have been achieved when general contractors have been used to carry out design-build projects, and that the poorest results have been achieved with contractor/A-E teams. Because
of the small sizes of the samples, these indications should not be taken as clear evidence, but they ought not be dismissed out of hand either. It should also be noted that the respondents rated results achieved with all three types of contractors better than the results achieved with comparable traditional projects.
DOES THE EXTENT OF DESIGN WORK COMPLETED PRIOR TO AWARD MAKE A DIFFERENCE?
One of the most basic questions that an agency must answer before undertaking a design-build project is how much, if any, of the design of the proposed facility should be developed prior to hiring the design-build firm. Some agencies believe that the design-build firms competing for the contract should be given a bare minimum of information about the project in order to encourage the competitors to look for creative solutions. Other agencies believe that it is in their best interest to have a well developed design before entering into a design-build contract in order to minimize the number of unresolved issues and to keep the project as “clean” as possible.
Most design-build contractors have indicated a definite preference for the latter approach; i.e., being given well developed designs by the owner.8 However, the committee hoped to determine for itself whether the extent of design work completed prior to the award of a design-build contract affects how well the approach works. To do so, the committee calculated the average overall ratings for three sets of projects in its sample grouped by the extent of pre-award design work done--one group of six projects in which the design was 35 percent or more complete prior to contract award, another group of nine projects in which the design was more than 15 percent but less than 35 percent complete prior to contract award, and a third group of 12 projects in which the design was 15 percent or less complete prior to contract award--and compared the results with the average rating for the entire sample.
The analyses are shown in Appendix B; specifically, Table B-14 shows the average for the six projects in which the design was 35 percent or more complete prior to contract award, Table B-15 shows the average for the nine projects in which the design was more than 15 percent but less than 35 percent complete prior to contract award, and Table B-16 shows the average
|
8 |
This position has been stated by a number of organizations involved in design-build work; for example, see the American Society of Civil Engineers' 1992 report Design-Build in the Federal Sector and Engineering News Record, September 28, 1992, Design-Build Job Stokes Tempers. |
for the 12 projects in which the design was 15 percent or less complete prior to contract award. The results are as follows:
Average overall rating for the six projects in which the design was 35 percent or more complete: 6.28
Average overall rating for the nine projects in which the design was more than 15 percent but less than 35 percent complete: 7.59
Average overall rating for the 12 projects in which the design was 15 percent or less complete: 5.68
Average overall rating for all 27 projects reported on: 6.41
The results indicate clearly that the best results have been achieved on projects in which designs have been 15 to 35 percent complete prior to hiring a design-build contractor, and that the poorest results have been achieved when designs were 15 percent or less complete prior to award of the design-build contract. Intermediate results were achieved when designs were 35 percent or more complete prior to contract award.
Obviously, the committee's data do not resolve the basic question.


