
1
Introduction
The future of the national immunization partnership, especially the status of the public health infrastructure for immunization within the states, is the focus of this report of the Institute of Medicine (IOM). We propose a national strategy to guide the federal and state partnership in supporting immunization efforts, improving coordination, and allocating costs between the public and private health care sectors. We also consider how the roles and responsibilities for this partnership should be shared among federal and state agencies.1
BACKGROUND
Immunizations that protect children and adults from the dangers of vaccine-preventable diseases are one of the genuine triumphs of basic medical science and the health care delivery system within the United States. Disease morbidity rates declined dramatically for nine vaccine-preventable diseases (smallpox, polio, diphtheria, pertussis, tetanus, measles, mumps, rubella, and Haemophilus influenzae type b) during the 20th century (Centers for Disease Control and Prevention [CDC], 1999a). According to current data, smallpox has been eradicated, the number of polio cases has been reduced to 5,500 worldwide, and each of the other seven diseases occurs only sporadically throughout the United States (CDC, 1999a) (see Table 1–1 for disease mortality trends).
Three key strategies have contributed to this success in disease prevention: (1) the discovery and commercial production of vaccines; (2) the
TABLE 1–1 Comparison of 20th-century Baseline and Current Morbidity, Vaccine-Preventable Diseases
|
Disease |
20th Century |
1999 Provisional |
Percent Decrease |
|
Smallpox |
48,164 |
0 |
100.0 |
|
Diphtheria |
175,885 |
1 |
100.0 |
|
Measles |
503,282 |
86 |
100.0 |
|
Mumps |
152,209 |
352 |
99.8 |
|
Pertussis |
147,271 |
6,031 |
95.9 |
|
Polio (paralytic) |
16,316 |
0 |
100.0 |
|
Rubella |
47,745 |
238 |
99.5 |
|
Congenital Rubella Syndrome |
823 |
8 |
99.0 |
|
Tetanus |
1,314 |
33 |
97.5 |
|
Haemophilus influenzae Type b and unknown (<5 years) |
20,000 |
146 |
99.2 |
|
SOURCES: CDC, 1999a; Cochi et al., 1985. |
|||
integration of immunization services (including vaccine purchase and delivery) within private and public systems of personal health care services; and (3) the development of a public health infrastructure that can monitor disease patterns and improve immunization coverage rates, especially among vulnerable populations. The combination of these three strategies has resulted in unprecedented high levels of vaccination coverage for a growing number of vaccines for both children and adults within the United States (see Table 1–2). The U.S. immunization system has also demonstrated an ability to achieve high immunization coverage levels among all age groups, across economic and social class lines, and spanning all racial and ethnic populations (CDC, 1998a). To sustain this success is difficult, however, requiring constant vigilance to detect signs of erosion and decline in coverage rates among vulnerable populations.
Costs of Achieving Current Levels of Immunization Coverage
Enormous effort is required within the U.S. health care system to maintain high levels of immunization coverage for a growing number of vaccines and among various age groups. The effort is especially challenging since a new birth cohort of 11,000 infants born each day requires attention within the routine immunization schedule. The first 2 years of life is perhaps the most vulnerable period for transmission of infectious diseases; thus it is crucial that this population be brought up to date as quickly as possible with regard to immunization status. Indeed, immuni-
TABLE 1–2 Vaccination Coverage Levels Among Children Aged 19–35 Months, by Selected Vaccines (1995–1999a)
|
|
1995 |
1996 |
1997 |
1998 |
1999c |
|||||
|
Vaccine/Dose |
% |
(95% CIb) |
% |
(95% CI) |
% |
(95% CI) |
% |
(95% CI) |
% |
(95% CI) |
|
DTPd |
||||||||||
|
≥3 Doses |
94.7 |
(±0.6) |
95.0 |
(±0.4) |
95.5 |
(±0.4) |
95.6 |
(±0.5) |
95.9 |
(±0.4) |
|
≥4 Doses |
78.5 |
(±1.0) |
81.1 |
(±0.7) |
81.5 |
(±0.7) |
83.9 |
(±0.8) |
84.0 |
(±0.8) |
|
Poliovirus |
||||||||||
|
≥3 Doses |
87.9 |
(±0.8) |
91.1 |
(±0.5) |
90.8 |
(±0.5) |
90.8 |
(±0.7) |
90.0 |
(±0.6) |
|
Haemophilus influenzae Type b (Hib) |
||||||||||
|
≥3 Doses |
91.7 |
(±0.6) |
91.7 |
(±0.5) |
92.7 |
(±0.5) |
93.4 |
(±0.6) |
93.7 |
(±0.5) |
|
Measle-Containing Vaccine (MCV) |
||||||||||
|
≥1 Doses |
89.9 |
(±0.7) |
90.7 |
(±0.5) |
90.5 |
(±0.5) |
92.1 |
(±0.6) |
92.0 |
(±0.6) |
|
Hepatitis B |
||||||||||
|
≥3 Doses |
68.0 |
(±1.0) |
81.8 |
(±0.7) |
83.7 |
(±0.6) |
87.0 |
(±0.7) |
87.9 |
(±0.7) |
|
Varicella Vaccine |
||||||||||
|
1 Dose |
N/Ae |
|
16.0 |
(±0.7) |
25.9 |
(±0.7) |
43.2 |
(±1.0) |
52.1 |
(±1.0) |
|
Combined Series |
||||||||||
|
4 DTP/3 Polio/1 MCVf |
76.2 |
(±1.0) |
78.4 |
(±0.8) |
77.9 |
(±0.7) |
80.6 |
(±0.9) |
86.2 |
(±0.7) |
|
4 DTP/3 Polio/1 MCV/3 Hibg |
74.2 |
(±1.0) |
76.5 |
(±0.8) |
76.2 |
(±0.8) |
79.2 |
(±0.9) |
78.8 |
(±0.9) |
|
aChildren were born during February 1992-May 1994 (1995 survey), February 1993-May 1995 (1996 survey), February 1994-May 1996 (1997 survey), and February 1995–May 1997 (1988 survey). bCI=confidence interval. cFirst two quarters of 1999 and last two quarters of 1998. Data can be found at http://www.cdc.gov/nip/. dDiphtheria and tetanus toxoids and pertussis vaccine/diphtheria and tetanus toxoids. eNot available; data collection for varicella began in July 1996. fFour or more doses of DTP/DT, three or more doses of poliovirus vaccine, one or more doses of MCV. gFour or more doses of DTP/DT, three or more doses of poliovirus vaccine, one or more doses of MCV, and three or more doses of Hib. SOURCE: Information provided by CDC. |
||||||||||
zation coverage assessments commonly focus on 2-year-olds because older children are usually well immunized as a result of child care or school requirements, because most childhood vaccines must be administered within 24 months after birth, and because the immunization status of this population can reveal shifting health care patterns in different geographic areas and health care settings.
The current vaccine schedule (see Figure 1–1 and Table 1–3) recommends that each infant born today receive between 19 and 23 doses of vaccine, most of which should be administered by 18 months of age, to be fully immunized. In 1987, the cost of fully immunizing a child was $116 in the private sector and $34 in the public sector. One decade later, in 1997, the total costs for the vaccines recommended for children had increased to $332 in the private sector and $176 in the public sector (Orenstein et al., 1999).2 These costs can escalate rapidly. The manufacturer’s list price for the new pneumococcal conjugate vaccine (which is effective against meningitis, bacteremia, pneumonia, and otitis media) is $58 per dose, and the Advisory Committee on Immunization Practices (ACIP) has recommended that infants receive 4 doses of the vaccine before age 2 to complete their immunization (Lieu et al., 2000).
Finally, while vaccine purchase costs have increased in both the public and private sectors, it is important to note that the public sector now bears a larger share of the cost of vaccines. The public-sector discount declined from 75 percent of catalog prices in 1987 to 50 percent in 1997 (Orenstein et al., 1999). A smaller number of vaccines recommended for adults differ by age group (see Table 1–3). Annual influenza vaccine is currently recommended for two categories of adults: (1) all persons aged 50 and older, and (2) all persons younger than 50 with certain chronic conditions, such as diabetes, heart disease, and lung disease (CDC, 2000a). One-time pneumococcal vaccines are recommended for adults aged 65 and older and for younger adults with chronic health conditions. ACIP is considering lowering the age range for this vaccine as well, but as of this writing had not made a revised recommendation. ACIP has also made recommendations regarding adult immunization for hepatitis B, hepatitis A, tetanus, diphtheria, measles, mumps, rubella, varicella, polio, and Lyme disease.
National cost data for adult vaccines are generally not available. According to one estimate, the cost for influenza vaccine ranges from $4.16 to $4.87 in the New York City area and for pneumococcal vaccine from $11.54 in upstate New York to $13.02 in Queens (Poland and Miller, 2000).
In addition to the costs of purchasing vaccines, payers must support many other expenses, including the costs of administering the vaccines (which may or may not be billed separately), and record-keeping costs
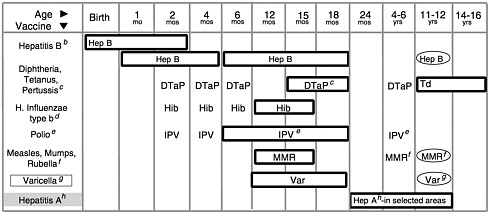
FIGURE 1–1 (Opposite) Recommended childhood immunization schedule— United States, January-December 2000.a Vaccines are listed under routinely recommended ages. Bars indicate range of recommended ages for immunization. Any dose not given at the recommended age should be given as a “catch-up” immunization at any subsequent visit when indicated and feasible. Ovals indicate vaccines to be given if previously recommended doses were missed or given earlier than the recommended minimum age. Approved by the Advisory Committee on Immunization Practices (ACIP), the American Academy of Pediatrics (AAP), and the American Academy of Family Physicians (AAFP). On October 22, 1999, the Advisory Committee on Immunization Practices (ACIP) recommended that Rotashield® (RRV-TV), the only U.S.-licensed rotavirus vaccine, no longer be used in the United States (MMWR, Volume 48, Number 43, Nov. 5, 1999). Parents should be reassured that their children who received rotavirus vaccine before July are not at increased risk for intussusception now.
aThis schedule indicates the recommended ages for routine administration of currently licensed childhood vaccines as of 11/1/99. Additional vaccines may be licensed and recommended during the year. Licensed combination vaccines may be used whenever any components of the combination are indicated and its other components are not contraindicated. Providers should consult the manufacturers’ package inserts for detailed recommendations.
bInfants born to HBsAg-negative mothers should receive the 1st dose of hepatitis B (Hep B) vaccine by age 2 months. The 2nd dose should be at least one month after the 1st dose. The 3rd dose should be administered at least 4 months after the 1st dose and at least 2 months after the 2nd dose, but not before 6 months of age for infants.
Infants born to HBsAg-positive mothers should receive hepatitis B vaccine and 0.5 mL hepatitis B immune globulin (HBIG) within 12 hours of birth at separate sites. The 2nd dose is recommended at 1–2 months of age and the 3rd dose at 6 months of age. Infants born to mothers whose HBsAg status is unknown should receive hepatitis B vaccine within 12 hours of birth. Maternal blood should be drawn at the time of delivery to determine the mother’s HBsAg status; if the HBsAg test is positive, the infant should receive HBIG as soon as possible (no later than 1 week of age). All children and adolescents (through 18 years of age) who have not been immunized against hepatitis B may begin the series during any visit. Special efforts should be made to immunize children who were born in or whose parents were born in areas of the world with moderate or high endemicity of hepatitis B virus infection.
cThe 4th dose of DTaP (diphtheria and tetanus toxoids and acellular pertussis vaccine) may be administered as early as 12 months of age, provided 6 months have elapsed since the 3rd dose and the child is unlikely to return at age 15–18 months. Td (tetanus and diphtheria toxoids) is recommended at 11–12 years of age if at least 5 years have elapsed since the last dose of DTP, DTaP or DT. Subsequent routine Td boosters are recommended every 10 years.
dThree Haemophilus influenzae type b (Hib) conjugate vaccines are licensed for infant use. If PRP-OMP (PedvaxHIB® or ComVax® [Merck]) is administered at 2 and 4 months of age, a dose at 6 months is not required. Because clinical studies in infants have demonstrated that using some combination products may induce a lower immune response to the Hib vaccine component, DTaP/Hib combination products should not be used for primary immunization in infants at 2, 4, or 6 months of age, unless FDA-approved for these ages.
eTo eliminate the risk of vaccine-associated paralytic polio (VAPP), an all-IPV schedule is now recommended for routine childhood polio vaccination in the United States. All children should receive four doses of IPV at 2 months, 4 months, 6–18 months, and 4–6 years. OPV (if available) may be used only for the following special circumstances: 1. Mass vaccination campaigns to control outbreaks of paralytic polio. 2. Unvaccinated children who will be traveling in <4 weeks to areas where polio is endemic or epidemic. 3. Children of parents who do not accept the recommended number of vaccine injections. These children may receive OPV only for the third or fourth dose or both; in this situation, health-care providers should administer OPV only after discussing the risk for VAPP with parents or caregivers. 4. During the transition to an all-IPV schedule, recommendations for the use of remaining OPV supplies in physicians’ offices and clinics have been issued by the American Academy of Pediatrics (see Pediatrics, December 1999).
fThe 2nd dose of measles, mumps, and rubella (MMR) vaccine is recommended routinely at 4–6 years of age but may be administered during any visit, provided at least 4 weeks have elapsed since receipt of the 1st dose and that both doses are administered beginning at or after 12 months of age. Those who have not previously received the second dose should complete the schedule by the 11- to 12-year-old visit.
gVaricella (Var) vaccine is recommended at any visit on or after the first birthday for susceptible children, i.e., those who lack a reliable history of chickenpox (as judged by a health care provider) and who have not been immunized. Susceptible persons 13 years of age or older should receive 2 doses, given at least 4 weeks apart.
hHepatitis A (Hep A) is shaded to indicate its recommended use in selected states and/or regions; consult your local public health authority. (Also see MMWR Oct. 01, 1999/48(RR12); 1–37).
SOURCE: CDC, 2000b.
(sometimes including the cost of registry development and maintenance). Other costs, such as outreach, education, training, data collection, and surveillance of coverage rates and vaccine safety, are incurred by public health agencies (as discussed later in this chapter). The American Academy of Pediatrics has estimated that its members charge approximately $15 per dose for vaccine administration (Fleming, 1995). Vaccine administration fees for adults are significantly lower, and range from $3.95 to $5.38 within the Medicare program, depending on the provider’s location (Health Care Financing Administration, 1999a). Such expenses are difficult to monitor, however, because they may or may not be billed separately within well-child visits or other office procedures, depending on
TABLE 1–3 Universally Recommended Vaccinations
|
Population |
Vaccination |
Dosage |
|
All young children |
Measles, mumps, rubella Diphtheria-tetanus toxoid and pertussis vaccine Poliomyelitis Haemophilus influenzae type ba Hepatitis B Varicella Hepatitis A (in selected areas)b |
2 doses 5 doses 4 doses 3–4 doses 3 doses 1 dose 2 doses |
|
Previously unvaccinated or partially vaccinated adolescents |
Hepatitis Bc Varicella |
3 doses total If no previous history of varicella, 1 dose for children aged<12 years, 2 doses for children aged≥13 years |
|
|
Mumps, measles, and rubella Tetanus-diphtheria toxoid |
2 doses, total If not vaccinated during previous 5 years, 1 combined booster during ages 11–16 years |
|
All adults |
Tetanus-diphtheria |
1 dose administered every 10 years |
|
All adults aged≥65d |
Influenza |
1 dose administered annually |
|
|
Pneumococcal |
1 dose |
|
aOnly children below age 5 receive Haemophilus influenzae type b. bHepatitis A was added to the schedule after the original table’s publication. cAn optional two-dose schedule for adolescents aged 11 to 15 was recently approved by the Food and Drug Administration. dThe Advisory Committee on Immunization Practices has recommended that all adults aged≥50 receive an influenza vaccination. SOURCE: Briss et al., 2000. |
||
insurance requirements and local practice guidelines. Some health practices may also charge separate fees for the production and copying of immunization records, fees that are commonly not reimbursed by health plans. Moreover, the shift in many states from fee-for-service to managed care plans (which has occurred swiftly within Medicaid), makes it more
difficult to track vaccine administration fees as a separate cost indicator because such fees now are generally included in the capitated payments.
The U.S. federal government currently spends more than $1 billion annually to purchase vaccines for disadvantaged children and adults and to support immunization programs within the 64 grantees, which include the 50 states, 6 municipal regions,3 and 8 U.S. political jurisdictions (see Table 1–4).4 These funds are allocated primarily by two federal agencies: CDC, which administers the National Immunization Program, established by Section 317 of the Public Health Service Act (see Appendix A); and the Health Care Financing Administration (HCFA), which administers the Medicaid and Medicare programs and the new State Children’s Health Insurance Program (SCHIP) in collaboration with the states. In addition, the Vaccines for Children (VFC) program, created in 1993 through an amendment to the Social Security Act, is financed through HCFA and administered by CDC. CDC supplies VFC vaccines and provides Section 317 vaccines and financial assistance awards to the states annually in response to state requests for assistance and estimates of vaccine need (see Boxes 1–1 and 1–2).
In fiscal year (FY) 1998, the VFC program, which provides federally financed vaccines for four categories of disadvantaged children, spent $437 million in federal funds for vaccines and operational costs; Medicaid program expenditures for immunization in this same year were an additional $127 million, $70 million of which was federal. In addition, CDC provided $418 million in support of vaccine purchase for the states, financial assistance for state immunization programs, and CDC program
TABLE 1–4 Total Federal Immunization Funding, FY 1999 ($ in millions)
|
Program |
Federal |
State |
Total |
|
Section 317a |
448 |
Unknown |
448 |
|
VFCb |
467 |
Not applicable |
467 |
|
Medicaid |
70 |
57 |
127 |
|
Medicare |
115 |
Not applicable |
115 |
|
TOTAL |
1,100 |
57 |
1,157 |
|
aTotal Section 317 federal immunization funding, FY 1999 (actual) as reported in the Department of Health and Human Services FY 2001 Centers for Disease Control and Prevention Justification of Estimates for Appropriations Committees. bTotal VFC federal immunization funding, FY 1999 (enacted), as reported in the Department of Health and Human Services FY 2001 Centers for Disease Control and Prevention Justification of Estimates for Appropriations Committees. SOURCE: Information provided by CDC. |
|||
|
BOX 1–1 Funding of State Activities Under Section 317 Grant Program CDC provides annual immunization project grants to 64 separate grantees, including 50 states, the District of Columbia, New York City, Chicago, Houston, San Antonio, Puerto Rico, the Virgin Islands, American Samoa, Guam, the Commonwealth of the Northern Mariana Islands, the Federated States of Micronesia, the Republic of Belau, and the Republic of the Marshall Islands. Immunization grant funds are intended to supplement but not supplant ongoing state and local immunization efforts. Each grantee’s funding level is contingent on a number of factors, including historical funding levels, the population size, the size of the state and local public health infrastructure, the size of the grantee’s immunization program, the geographical area of the grantee, the proportion of the childhood population served by the public sector, the level of state and local support for the immunization program, the occurrence of vaccine-preventable disease outbreaks, and the grantee’s ability to develop programs and expend funds. Vaccine is available as Direct Assistance (in lieu of cash), as requested by the applicant, in the form of a “credit line.” Grantees may order childhood or adult vaccines until the credit line is exhausted. CDC also considers requests for CDC personnel (and their travel) and other forms of direct assistance to purchase goods and services through General Services Administration contracts in order to develop and implement immunization registries. Grant funds in the form of Financial Assistance may be used for costs associated with planning, organizing, and conducting immunization programs. Grantees use financial assistance to pay for project personnel, travel, supplies, contracts, other miscellaneous costs, and indirect charges. Grantee personnel carry out programmatic functions such as conducting audits and surveys; investigating vaccine-preventable disease outbreaks; assisting with outbreak control measures; coordinating program efforts with other federal, state, and local governments and private and community-based organizations; and carrying out a variety of professional and community educational efforts. CDC has always specified that immunization grants are intended to supplement and may not supplant state and local resources. The immunization grants are “discretionary,” and no formula exists for the allocation of CDC funding to grantees. Each grantee’s funding level is contingent primarily on the grantee’s need as expressed in the amount requested annually. Matching funds from the states or territories are not required for the federal grants, and grantees need not allocate any of their own funds to purchase or distribute vaccines or pay for other operational costs. CDC does rely on some grantees to assume a larger share of the responsibility so that a greater proportion of the available funds can be allocated to other grantees. CDC adjusts the grant awards to meet each grantee’s operational needs and unique circumstances in each project area. In general, CDC is unable to provide grantees with as much funding as they request. In the past, the funds have been distributed among geographic regions and earmarked for specific program activities, such as perinatal hepatitis B prevention. Since 1998, CDC has determined the size of grant awards for each state by applying a uniform percentage reduction to all grantees’ operational funding needs. |
|
The requested amounts are adjusted, if necessary, during CDC’s review of the applications to exclude budget items outside the scope of the grants and to adjust any amounts considered excessive or unreasonable. The resulting amounts constitute a funding base to which grantee-specific incentive funds are added. In recent years, Senate appropriations language has instructed CDC to distribute $33 million of the grant funds (termed “incentive funding”) using a formula that rewards grantees with the highest vaccine coverage rates. Grantees usually receive funding in two or three installments, although the bulk of operational funds has been awarded in the initial installment since 1996. Vaccine funds continue to be awarded in several large installments. SOURCE: information provided by CDC. |
|
BOX 1–2 Section 317 Grant Guidance Annually, CDC’s National Immunization Program (NIP) publishes guidance for immunization grant applications. This guidance describes activities the grantees are required to undertake, as well as those NIP recommends if resources are available. The year 2000 grant application guidance includes 38 required activities and 28 recommended activities. In their applications, grantees describe how they will carry out these activities and provide a detailed budget and budget justification. Grantees are always instructed to request in their applications the amount of funding they will need, at a minimum, to implement the activities required in the guidance regardless of the federal budget situation. At present funding levels, CDC is not able to provide enough federal funds to support full implementation of all programmatic activities required by the grant guidance (see Box 1–1). Therefore, grantees are allowed the flexibility to pursue activities that are considered most appropriate and effective in their jurisdiction. Grantees must submit the following reports to CDC:
SOURCE: Information provided by CDC. |
operations in such areas as research and polio eradication. Medicare paid providers almost $115 million in 1998, including $87 million for influenza immunizations, $27 million for pneumococcal immunizations, and $800,000 for hepatitis B immunizations (information provided by HCFA).
In addition to these federal investments, many states and some local governments contribute funds to the support of the national immunization system. The total cost of the state contribution to the purchase of vaccines and the operation of immunization programs, based on estimates provided by state immunization program managers, is estimated at $340 million for FY 2000 (information provided by CDC). This estimate includes funds provided by state and local governments, as well as other federal funds (e.g., Maternal and Child Health Title V grants) that support immunization efforts.
Limitations of Current Efforts
The current levels of public and private investment in immunization efforts have been successful in controlling infectious diseases and improving levels of immunization coverage. But persistent problems remain within the U.S. immunization system:
-
Mortality and morbidity from preventable infectious disease. Between 50,000 and 70,000 adults die annually in the United States from vaccine-preventable diseases (VPDs) or their complications, compared with approximately 300 U.S. children who die from VPDs each year (National Foundation for Infectious Disease, 1999).
-
Low coverage rates for adult vaccines. National levels for influenza coverage have increased from 58 percent (1995) to 63 percent (1997) for adults aged 65 and older, but the percentage immunized among adults aged 55 to 64 is still considerably lower, with a median of 38.2 percent nationwide (National Center for Health Statistics [NCHS], 1997). Pneumococcal coverage levels for persons 65 and older are also low—only 42 percent of noninstitutionalized adults aged 65 and over had ever received a pneumococcal vaccination by 1997 (NCHS, 1997). Coverage rates for high-risk adults (under age 65) are especially poor. Recent surveys indicate that 26 percent of this group received an influenza vaccination, while only 13 percent received a pneumococcal vaccination (NCHS, 1997).
-
Persistent disparities in levels of immunization coverage. Immunization coverage levels within areas of concentrated poverty or among mobile populations are significantly lower than national and statewide levels.5 National surveys reveal a gap of 9 percentage points between children above and below the federal poverty level for completion of the 4:3:1:3 vaccine series,6 which includes some of the most critical childhood vaccines
-
(information provided by CDC). Although improvements have occurred over the past decade, patterns of disparity have persisted between state-level coverage levels and the levels in major metropolitan areas (see Table 1–5). A recent and troubling development is that coverage levels in a few cities (most notably Houston and Chicago) have begun to decline
TABLE 1–5 Estimated Vaccination Coverage of 4:3:1:3a Among Children 19–35 Months of Age by Selected Geographic Areas— United States, National Immunization Survey, 1995–1999
|
|
1995 |
1996 |
||
|
Area |
Geographic Area |
Rest of Statec |
Geographic Area |
Rest of Statec |
|
Jefferson County, AL |
85 (±4.9) |
74 (±5.5) |
77 (±4.8) |
75 (±4.8) |
|
Maricopa County, AZ |
69 (±7.2) |
71 (±6.1) |
71 (±5.1) |
69 (±5.8) |
|
Los Angeles, CA |
70 (±7.2) |
68 (±7.3) |
79 (±4.9) |
73 (±4.8) |
|
San Diego County, CA |
73 (±6.4) |
— |
77 (±4.4) |
— |
|
Santa Clara, CA |
74 (±5.7) |
— |
79 (±4.4) |
— |
|
District of Columbia |
67 (±6.9) |
n/a |
78 (±5.0) |
n/a |
|
Dade County, FL |
77 (±6.1) |
75 (±5.9) |
76 (±5.2) |
78 (±4.9) |
|
Duval County, FL |
71 (±6.8) |
— |
76 (±5.1) |
— |
|
Fulton/DeKalb, GA |
79 (±5.8) |
76 (±5.9) |
74 (±5.5) |
82 (±4.3) |
|
City of Chicago, IL |
69 (±6.8) |
83 (±5.1) |
74 (±5.6) |
75 (±4.8) |
|
Marion County, IN |
75 (±6.0) |
74 (±5.5) |
72 (±5.4) |
70 (±4.7) |
|
Orleans Parish, LA |
75 (±6.1) |
76 (±5.4) |
71 (±5.9) |
80 (±4.5) |
|
City of Boston, MA |
87 (±4.9) |
79 (±4.9) |
84 (±4.2) |
86 (±3.6) |
|
Baltimore City, MD |
75 (±6.9) |
79 (±5.2) |
81 (±4.8) |
78 (±4.7) |
|
Detroit, MI |
57 (±7.6) |
69 (±5.6) |
63 (±6.1) |
76 (±4.5) |
|
Newark, NJ |
67 (±7.3) |
73 (±5.8) |
62 (±6.2) |
78 (±4.8) |
|
NY—5 Counties (NYC) |
78 (±6.5) |
76 (±5.7) |
75 (±5.5) |
82 (±4.5) |
|
Cuyahoga County, OH |
71 (±6.8) |
73 (±5.5) |
80 (±4.7) |
77 (±4.3) |
|
Franklin County, OH |
74 (±5.9) |
— |
78 (±5.4) |
— |
|
Philadelphia, PA |
67 (±7.4) |
77 (±5.5) |
75 (±5.4) |
80 (±4.3) |
|
Davidson County, TN |
73 (±5.7) |
74 (±5.6) |
77 (±4.7) |
80 (±4.1) |
|
Shelby County, TN |
68 (±6.2) |
— |
70 (±5.3) |
— |
|
Bexar County, TX |
74 (±6.3) |
74 (±5.4) |
74 (±5.2) |
74 (±5.1) |
|
City of Houston, TX |
70 (±6.7) |
— |
68 (±5.9) |
— |
|
Dallas County, TX |
70 (±6.1) |
— |
71 (±5.8) |
— |
|
El Paso County, TX |
77 (±5.1) |
— |
62 (±5.6) |
— |
|
King County, WA |
82 (±4.7) |
75 (±5.7) |
81 (±4.2) |
77 (±4.6) |
|
Milwaukee, WI |
68 (±6.0) |
76 (±4.8) |
70 (±5.2) |
78 (±4.2) |
|
a4:3:1:3=four or more doses of diphtheria, tetanus, and pertussis vaccine; three or more doses of poliovirus vaccine; one or more doses of a measles-containing vaccine; and three or more doses of Haemophilus influenzae type b vaccine, bFirst two quarters of 1999 and last two quarters of 1998. |
||||
-
(information provided by CDC). The disparities encompass the range of vaccines received by each child or adult; the age of onset and completion of immunization; and the extent of unnecessary, duplicative immunization that occurs because of insufficient documentation. Given these gaps, the National Vaccine Advisory Committee (NVAC) has stated that a com-
|
1997 |
1998 |
1999b |
|||
|
Geographic Area |
Rest of Statec |
Geographic Area |
Rest of Statec |
Geographic Area |
Rest of Statec |
|
82 (±4.3) |
86 (±3.7) |
85 (±4.8) |
82 (±5.0) |
87 (±4.1) |
75 (±5.6) |
|
72 (±4.8) |
74 (±4.8) |
77 (±5.8) |
74 (±6.2) |
75 (±6.0) |
77 (±5.4) |
|
71 (±5.5) |
76 (±4.6) |
76 (±6.0) |
75 (±5.8) |
77 (±5.7) |
75 (±5.5) |
|
78 (±4.3) |
— |
77 (±5.1) |
— |
76 (±5.4) |
— |
|
73 (±4.8) |
— |
84 (±4.7) |
— |
82 (± 5.1) |
— |
|
73 (±5.4) |
n/a |
71 (±6.2) |
n/a |
72 (±5.9) |
n/a |
|
75 (±5.0) |
78 (±4.5) |
75 (±6.0) |
80 (±5.3) |
82 (±5.1) |
81 (±5.1) |
|
70 (±5.1) |
— |
79 (±6.0) |
— |
79 (±5.1) |
— |
|
75 (±4.9) |
80 (±4.3) |
71 (±6.9) |
82 (±4.8) |
80 (±5.9) |
81 (±5.1) |
|
68 (±5.5) |
77 (±4.8) |
64 (±7.4) |
83 (±5.5) |
70 (±6.1) |
84 (±4.6) |
|
81 (±4.5) |
70 (±4.4) |
78 (±5.3) |
77 (±5.6) |
79 (±5.2) |
72 (±5.6) |
|
69 (±6.0) |
77 (±4.6) |
79 (±5.7) |
78 (±5.6) |
77 (±5.7) |
76 (±5.4) |
|
86 (±3.6) |
86 (±3.4) |
89 (±3.6) |
86 (±4.3) |
86 (±4.5) |
89 (±3.7) |
|
83 (±4.7) |
79 (±4.2) |
81 (±5.7) |
76 (±5.6) |
77 (±5.9) |
78 (±5.2) |
|
65 (±5.6) |
76 (±4.2) |
70 (±6.4) |
79 (±5.4) |
67 (±6.3) |
75 (±5.6) |
|
66 (±6.3) |
77 (±4.5) |
64 (±8.7) |
83 (±6.5) |
67 (±7.3) |
85 (±4.6) |
|
75 (±5.1) |
77 (±4.7) |
81 (±5.8) |
86 (±4.5) |
76 (±5.9) |
84 (±4.8) |
|
73 (±5.3) |
73 (±4.6) |
75 (±6.0) |
79 (±5.2) |
72 (±5.5) |
74 (±5.6) |
|
74 (±5.0) |
— |
78 (±6.2) |
— |
79 (±5.3) |
— |
|
78 (±5.1) |
80 (±4.3) |
80 (±5.8) |
84 (±4.3) |
83 (±4.7) |
85 (+±4.2) |
|
77 (±4.6) |
80 (±4.2) |
80 (±5.3) |
85 (±4.6) |
77 (±5.7) |
78 (±5.6) |
|
70 (±5.3) |
— |
71 (±6.5) |
— |
68 (±6.0) |
— |
|
79 (±4.8) |
76 (±4.6) |
79 (±5.5) |
77 (±5.5) |
74 (±6.0) |
76 (±5.3) |
|
64 (±6.1) |
— |
61 (±7.5) |
— |
57 (±6.9) |
— |
|
74 (±5.4) |
— |
71 (±6.7) |
— |
73 (±6.5) |
— |
|
65 (±5.3) |
— |
78 (±5.0) |
— |
79 (±4.9) |
— |
|
77 (±4.6) |
79 (±4.1) |
86 (±4.8) |
79 (±5.0) |
82 (±4.6) |
74 (±5.4) |
|
70 (±4.9) |
81 (±3.7) |
73 (±6.0) |
79 (±4.9) |
75 (±6.2) |
83 (±4.5) |
|
cFor states with more than one selected geographical area, “rest of state” data do not include any of the selected areas. SOURCE: CDC, 2000c. |
|||||
-
prehensive, efficient national immunization system is incomplete and remains “a work in progress” (NVAC, 1999a).
-
Serious gaps and inconsistencies in the coordination, support, and documentation of immunization efforts. As the number and types of vaccines recommended for both adults and children have increased, the systems in place for ensuring their availability, monitoring immunization coverage rates, and improving coverage among vulnerable populations have remained the same. These systems are showing signs of stress in the form of inconsistent measurement, bureaucratic delays, excessive paperwork, and administrative burdens that reduce program efficiencies in private and public health agencies. Efforts to improve coverage rates in areas of social and economic disadvantage are further complicated by two factors: (1) uneven benefits coverage for vaccines within private health plans; and (2) strict eligibility requirements for federally financed vaccines that deny access to similarly situated children on a state-by-state basis (see, for example, HCFA and CDC correspondence regarding the use of VFC vaccines for children enrolled in non-Medicaid SCHIP programs [Richardson and Orenstein, 1999]).
-
Unstable finance patterns. Budgetary shifts in the support for vaccine purchase and immunization programs have created a climate of uncertainty and instability within the states that discourages the implementation of preventive interventions to improve immunization coverage rates. As a result, states report that they have reduced efforts to link immunization services with other health and social service programs, such as the Women, Infants, and Children (WIC) nutritional supplement program; that they lack sufficient documentation of immunization records; and that they have been hampered in their efforts to audit immunization coverage levels within private provider practices.
The collective result of the above problems is a significant delay in the public benefit of vaccines, especially for groups of children and adults who are not closely connected with high-quality primary care services. Closing the gaps that persist in child and adult immunization levels will require sustained as well as additional efforts within state and federal public health agencies. At the same time, however, these agencies currently confront serious difficulties in achieving stable funding streams, as well as uncertainties about their roles and responsibilities for immunization activities in the United States.
CHARGE TO THE COMMITTEE
Current analyses of immunization investments reveal the absence of a strategic plan that can guide the federal and state partnership in sup-
porting immunization efforts. The lack of such a plan makes it difficult to establish program priorities or estimate the scale of investments necessary to sustain current levels of immunization coverage for children and adults. The absence of a national consensus about the roles and responsibilities of federal and state agencies in fostering immunization also complicates efforts to extend immunization benefits to the relatively small population of high-risk individuals who remain unprotected. Uncertainties about how the costs of such efforts should be allocated across the different levels of government lead to inefficiencies in the use of public resources, including redundant efforts, gaps in services, and unnecessary paperwork.
It is for these reasons that the U.S. Senate Appropriations Committee in 1998 asked IOM to conduct a study of the Section 317 program.7 The study was designed to identify areas in which research-based evidence can guide federal, state, and local immunization policies and practices. The Congress formulated five key questions as the basis for the IOM study:
-
What was the extent of overall spending by all sources for immunizations in the United States during the 1990s?
-
How were new federal funds spent by the states, and to what extent did states maintain their own levels of effort over the past 5 years?
-
What are current and future funding requirements for immunization activities, and how can those requirements be met through a combination of state funding, federal Section 317 immunization grant funding, and funding available through SCHIP?
-
How should federal grant funds be distributed among the states?
-
How should funds be targeted within states to reach high-risk populations without diminishing levels of coverage among the overall population?
In addition, a sixth question was posed by CDC during the negotiation of the study contract:
-
What should be the role and financing level for CDC’s current program supporting state efforts to vaccinate adults and achieve the nation’s goals for influenza and pneumococcal vaccines?
These questions reflect a need for guidance regarding the level of national effort necessary to achieve immunization objectives, as well as strategies that can balance federal and state contributions in extending the benefits of immunization to unprotected children and adults.
STUDY CONTEXT: THE NATIONAL IMMUNIZATION PARTNERSHIP
The U.S. achievement in reducing the burden of infectious disease and increasing immunization coverage rates throughout the states has been accomplished through a series of incremental initiatives over the past 50 years (see Appendix B). An ongoing partnership between the public and private health sectors has emerged that includes extensive collaboration among federal, state, and local health agencies. The result is a dynamic and flexible immunization system that has adapted to evolving science and new vaccines; changing social conditions; and shifting health care finance patterns within all settings, from remote rural counties to metropolitan areas.
In contrast with many other industrialized nations, the United States has a health care system that is highly decentralized and depends primarily on the private sector to deliver services. Each regional health care system is shaped by local circumstances, resources, and needs, as well as by national goals and policies. Though cumbersome, this system has demonstrated an extraordinary capacity to ensure the reliable delivery of an increasing number of vaccine antigens in a growing number of private and public health care settings for an expanding range of age groups, including newborns, preschool and school-aged children, adolescents, and adults.
At present, however, federal and state roles within the national immunization partnership are unstable. Several trends contribute to this instability: rapid acceleration in the science of vaccine research and production, systemic changes in the health care environment of the United States (especially the emergence of managed care organizations), and shifts in thinking within the Congress about the roles and responsibilities of federal and state health agencies in building and supporting public health services. The instability is worrisome because it can create pressure points and blind spots that can swiftly contribute to outbreaks of infectious disease, as was seen in the 1989–1991 measles epidemic in the United States that contributed to 43,000 cases and resulted in more than 100 deaths, particularly among children below age 5 (see Box 1–3) (NVAC, 1991).
The persistence of low immunization coverage rates for routine vaccines (especially measles, rubella, diphtheria, and pertussis) within metropolitan areas is cause for serious concern. Constant vigilance is required to protect the gains that have been made, and to prevent gaps that could result from the addition of new or improved vaccines to the recommended schedules, as well as from changes in health care services for underimmunized populations of adults and children. Unprotected sectors can unexpectedly become sources of infectious disease outbreaks and can
|
BOX 1–3 The Measles Epidemic, 1989–1991 Measles reached a record low in 1983 (1,497 cases), a 97 percent reduction from the more than 57,000 cases reported in 1977. The Carter Administration’s Measles Elimination Program had the goal of eradicating measles in the United States by 1982. However, measles was not eliminated, and this success was not sustained. In 1984 and 1985, outbreaks occurred among older children, including college-age youth who had entered school before the vaccine was in routine use. A new pattern emerged in 1986 when outbreaks occurred among preschool age children and were concentrated in inner city, low-income neighborhoods in 20 U.S. counties. Sporadic outbreaks of disease became a measles epidemic between 1989 and 1991. During 1989 more than 18,000 cases and 41 deaths were reported, rising to an additional 25,000 cases and at least 60 deaths in 1990 (CDC, 1991). With a reservoir of unimmunized and underimmunized preschool-aged children, the disease spread rapidly through several cities, including Chicago, Houston, and Los Angeles, which accounted for one-third of all cases in 1989. CDC’s findings on selected cities (Chicago, Dallas, Los Angeles, Milwaukee, and New York) were used to develop a response to contain the epidemic, as well as new strategies to raise immunization rates. CDC found that half of the children who had had measles were not immunized, even though many of them had seen a health provider. Researchers dubbed these visits “missed opportunities” for immunization, and reducing missed opportunities became a priority. CDC also found that more than one in five of the unvaccinated children who contracted measles were also enrolled in Aid to Families with Dependent Children (AFDC), Medicaid, or the Supplemental Nutrition Program for Women, Infants, and Children (WIC). It became clear that underimmunized children could be identified through other publicly funded programs, and CDC developed demonstration projects to improve immunization levels among WIC clients. While CDC conducted the laboratory and epidemiological studies of the measles epidemic, the federal response to the epidemic also was shaped by a new force in policy analysis, the National Vaccine Advisory Committee (NVAC). Created by Congress in 1986 as part of the National Vaccine Program, this body was designed to be an independent advisor to the Assistant Secretary for Health. By 1990, an active group of advisors had been appointed by the Bush Administration, and the measles epidemic led them to take unprecedented leadership (A Shot in the Arm for Vaccine Advocates, 1990). With the support of CDC and National Vaccine Program Office (NVPO) staff, NVAC prepared a measles white paper, which made key recommendations for responding to the measles epidemic (National Vaccine Advisory Committee, 1991). Following release of the white paper, a federal Interagency Coordinating Committee was formed to outline an implementation plan involving eleven federal agencies. This committee met on a quarterly basis for 18 months, creating a “Public Health Service Action Plan to Improve Access to Immunization Services.” In testimony before the Senate Appropriations Committee in June 1991, Dr. William Roper, Director of CDC, stated that the measles “epidemic still affects predomi |
|
nantly unvaccinated preschool racial and ethnic minority children in inner cities” (U.S. Senate, 1991). Other witnesses expressed the view that low-income working families living in communities across the country faced financial barriers to immunization. A year later President Bush announced the Infant Immunization Initiative, targeted at improving the low immunization rates of certain populations, including those under age 2. The model immunization plans were the beginning of a national effort to ensure adequate and timely immunization of infants and young children. This ultimately resulted in the preparation of Immunization Action Plans (Orenstein et al., forthcoming). The Childhood Immunization Initiative, a major effort launched in the early years of the Clinton Administration, subsequently strengthened this effort to include the creation of the Vaccines for Children program and the expansion of the Section 317 program in the early 1990s. |
serve as hosts for preventable pathogens such as pertussis. The continued presence of large groups of children and adults that do not have regular access to immunization services also represents an important indicator for those monitoring the performance of the U.S. health care system in meeting the basic health care needs of an increasingly diverse population.
It is ironic that the United States is now in the situation of creating an impressive array of vaccines that can reduce and perhaps eliminate the dreaded diseases that threatened prior generations of Americans, while at the same time relying on a patchwork system for purchasing, distributing, and administering these powerful drugs that undermines the effectiveness of the nation’s disease prevention strategy. It is time, therefore, for a strategic vision that can clarify the roles and responsibilities of state and federal agencies in achieving national immunization goals and provide the resources to support this effort.
Role of the Section 317 Program
In the first few decades of the formation of the national immunization partnership, the federal role was limited primarily to the purchase of vaccines that would allow the states to meet the needs of disadvantaged children (see Appendix B for a chronology of the U.S. immunization system). Over time, the federal role gradually expanded to include three key features: (1) financial assistance that allows the states to purchase vaccines collectively under a federal contract at discount prices; (2) infrastructure
grants that provide funds for both direct services and other components of the state’s immunization program; and (3) federal personnel and technical expertise, especially in such areas as information collection, data analysis, and long-term planning. Section 317, established in 1963, was the first in a series of late 20th-century federal initiatives related to immunizations and primary health care services for disadvantaged families.
Creation of the VFC Program
In 1994, the VFC program was launched as a new entitlement for Medicaid and uninsured children and other groups specified by law. Section 13631 of the Omnibus Budget Reconciliation Act of 1993 created VFC as a means of providing free vaccine to children aged 18 and younger who are uninsured, are eligible for Medicaid, or are Alaska Natives or American Indians. Underinsured children (those whose insurance does not cover childhood vaccinations) are also eligible for VFC vaccines, but may receive them only in federally qualified health centers or rural health clinics (see Chapter 3 for further discussion of the program).
VFC is a vaccine purchase program designed to encourage the provision of immunizations to children within a “medical home” that provides basic primary care services. VFC was created on the premise that the cost of vaccine for parents constituted a major barrier to children’s timely immunization, an assumption that was not supported in an evaluation study prepared by the General Accounting Office (GAO) in 1995. GAO concluded that strategies other than VFC may better improve timely vaccination among children, potentially at lower public cost, by reducing missed opportunities for immunization through Medicaid, public health clinics, and other providers with whom underimmunized children already have contact (GAO, 1995a:3). Furthermore, GAO observed that CDC cannot ensure that VFC will reach pockets of need—areas or populations in which immunization rates are low and the risk of disease is consequently high. The legislation creating the VFC program limits VFC expenditures to vaccine purchase and narrowly defined operational costs, such as expenses associated with ordering, inventory maintenance, vaccine distribution, and provider enrollment. VFC lacks any built-in evaluation mechanism that could measure its performance in providing vaccine to at-risk children or attribute changes in age-appropriate immunization rates to the program’s operation.
Despite these limitations, VFC has been successful in attracting the participation of public and private health care providers. In 1998, an estimated 44,000 public and private providers were eligible to receive VFC vaccines.
State Children’s Health Insurance Program
In 1998, SCHIP was initiated to provide grants to the states to help finance health care services for children in low-income families without health insurance. As discussed in Chapter 3, SCHIP is a block grant program that provides federal resources allowing states to extend services to low-income children who are ineligible for Medicaid but otherwise uninsured (e.g., the “working poor”). States are required to cover all ACIP-recommended vaccines and their administration to children as part of the annual federal SCHIP allotment.
Interaction of Federal Immunization Efforts
The creation and implementation of the VFC and SCHIP programs have raised questions about the mission and role of the Section 317 program. During the first half of the 1990s, the budget for Section 317 state immunization infrastructure grants grew substantially, but funding levels for state infrastructure awards have declined significantly in the past 4 years (see Figures 1–2 and 1–3). Since the federal government now relies heavily on the private sector to administer programs such as VFC and SCHIP to improve the quality of health care for disadvantaged children, the potential for overlap and duplication of effort between these programs and Section 317 awards may exist and requires consideration and oversight. Opportunities may exist to leverage public and private investments and integrate programs to achieve multiple goals or to diminish unnecessary bureaucracy associated with the administration of separate funding streams. At the same time, if different federal programs perform separate but related missions, appropriate measures need to be in place that can be used to assess the performance of individual units in contributing to national goals and objectives.
The separate federal immunization initiatives undertaken over the past several decades have responded to new problems and addressed new dimensions of the immunization system. But certain features have remained consistent over time. One historical review of federal immunization policy identifies the following as critical components of federal immunization policy in the 20th century (Johnson et al., forthcoming):
-
From the beginning, immunization financing was explicitly structured to be a federal–state–private-sector partnership.
-
Federal policy makers never expected federal funds to be sufficient to cover the full cost of vaccine purchase and delivery for disadvantaged groups.
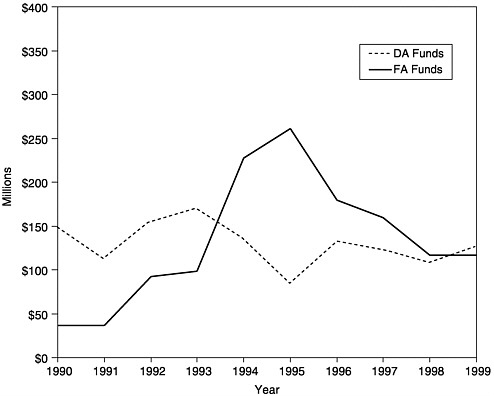
FIGURE 1–2 Amount of new funding awarded as Section 317 Direct Assistance (DA)a and Financial Assistance (FA),b 1990–1999. aDA funds include funds for vaccine purchase and operations. bFA funds include funds for state infrastructure programs. SOURCE: Information provided by CDC.
-
Federal funds are designed to be used within the states for specific purposes to target specific problems.
-
Federal funds are provided to supplement, not supplant, state investments in immunization programs.
Assessment, Assurance, and Policy Development in the National Immunization Strategy
When infectious disease was widespread during the first half of the 20th century, vaccine services generally consisted of community-based, stand-alone, self-contained efforts designed to achieve universal coverage in schools or other community settings within a relatively short period of time. Local health agencies often funded and publicized programs such as “Shots on Sunday” or “Back-to-School Shots.” As these programs expanded
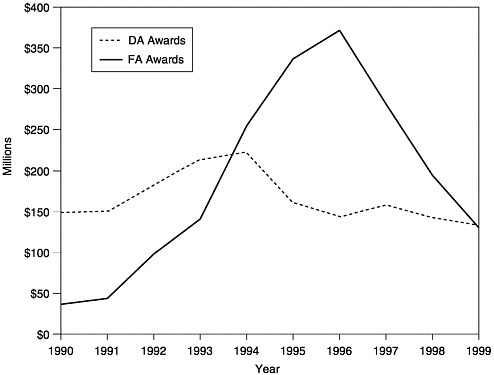
FIGURE 1–3 Amount of total annual awardsa of Section 317 Funds, Direct Assistance (DA)b and Financial Assistance (FA),c 1990–1999. aTotal funds include new funds plus carryover. bDA funds include funds for vaccine purchase and operations. cFA funds include funds for state infrastructure programs. SOURCE: Information provided by CDC.
to include year-round clinic services, outreach, education, and data collection responsibilities, costs were shared between the states and the federal government. Investments were often financed through emergency appropriation bills or vaccine purchase budgets that drew strong bipartisan support in the interest of controlling outbreaks of infectious disease.
Public health clinics have traditionally provided free vaccines for disadvantaged families and are commonly the first line of defense during outbreaks or epidemics. Special community-based immunization programs such as “Back to School Shots” still continue in many disadvantaged neighborhoods. Today, however, immunizations are routinely acquired within the set of clinical services associated with primary preventive care and well-baby health care. Third-party coverage of immunization services, financed through private and public insurance plans, is more common, resulting in declining use of public health clinics to deliver immuni-
zation services. Vaccines purchased with state or federal funds are increasingly delivered through private health care practices, except in states that continue to rely heavily upon public health clinics for primary health care services.
Completion of an immunization series requires multiple interactions with providers over a lengthy period of time, and determining the immunization status of an individual at any particular time can be difficult for both clients and health professionals. More than half of all infants and children aged 0 through 5, for example, are covered by private health insurance, but not all health plans include immunization coverage.8 In contrast, all Medicaid health plans include comprehensive immunization benefits within the Early and Periodic Screening, Diagnosis and Treatment program (as described in Chapter 3). SCHIP plans must also include immunizations as a basic benefit, comparable to Medicaid standards.
As noted earlier, however, the costs of achieving national immunization goals are not limited to the purchase and administration of vaccines. Other costs are incurred by public health agencies as part of their communitywide immunization programs, both universal and targeted (see Box 1–4). Disease prevention and control efforts, public information campaigns, provider education, reminder and recall systems, and immunization registry programs are all examples of universal programs whose costs are generally borne by the public sector. Immunization budgets are frequently combined with other public health programs at the state and local levels, supporting both core efforts and targeted initiatives. For individuals who do not have insurance or whose insurance does not cover immunization services, for example, targeted community assistance efforts are often required to assess their immunization status, and to connect individual children and adults with recommended immunization services and immunization records. Immunization assessment and referral services have also been added to Head Start centers, welfare assistance programs, and WIC clinics that provide nutritional supplement programs. Such efforts are commonly distributed across a broad spectrum of public and private agencies and are part of mission efforts within such fields as primary care, maternal and child health services, migrant health, and public health. As a result, their costs are generally not measured in estimating the expenses associated with immunization. Later in this report we examine whether the basic components of these costs can be identified, along with how they are allocated across different levels of government.
In summary, the role of the public health sector in immunization has shifted in the 1990s from a service-delivery function to one that is more directly involved with assessment, assurance, and policy development. This shift is consistent with trends in other public health programs, as described in earlier IOM reports (IOM, 1988, 1997). Yet federal immuniza-
|
BOX 1–4 Immunization infrastructure: The Michigan Example Michigan received $6.4 million for “infrastructure” in 1999, about $20 per child under age 3. These funds support efforts associated with direct service delivery, infectious disease prevention, surveillance and assessment, efforts to improve coverage rates, and programs to strengthen system performance. Additional federal support pays for the state health department’s immunization program staff. That staff includes two public health advisers (employees of CDC)—one on the Michigan state central staff and one assigned to the city of Detroit. More than half the infrastructure grant funds support service delivery. The state allocates funds to 43 local health departments based on the number of young children who live in the area. Local health departments are free to pursue the strategy they choose to ensure timely immunization. The most common use of the funds is to pay staff to administer vaccines. The infrastructure grant supports a central immunization program staff and two four-person field staffs—one that works with local health departments and another that works with the VFC providers who work in the private sector. Both field staffs work with providers on the logistics of obtaining vaccines and proper vaccine storage and handling. The field staff working with local health departments assists when outbreaks occur. It also reviews assessments of coverage levels among children immunized by local health departments. This group is responsible as well for working with schools to ensure compliance with school entry immunization requirements. The field staff that deals with other VFC providers tries to retain and recruit new providers. The core of the central staff comprises the program manager, a series of individuals with specialized functions, and support staff. A surveillance coordinator focuses on epidemiology and surveillance through activities such as visiting localities experiencing outbreaks and gathering reports of vaccine-preventable diseases. An outreach and education manager and staff work broadly through a newsletter with a circulation of 8,000 and annual immunization workshops conducted around the state that attract 800 people a year. This group targets efforts to improve service delivery, such as a peer-to-peer physician education network and distribution of an immunization provider toolkit. The assessment coordinator oversees two contracts designed to provide immunization assessments—one for clinics and physician offices in the Detroit area and the other in 22 community and migrant health centers. This individual also conducts assessments outside Detroit. Assessments use the CDC-developed Assessment, Feedback, Incentives, and exchange of information (AFIX) methodology. This activity has produced an average of 10 percent higher coverage levels at the time of the second follow-up assessment. The state staff also includes an immunization registry coordinator, although the costs of operating the registry are paid with state funds. One person focuses on reducing perinatal hepatitis B transmission, following up on possible cases of transmission by mothers to their newborn children. Federal funding for infrastructure supports other outreach efforts as well. These include contracts to answer calls to a toll free number for immunization information, and to conduct outreach to day care providers in an urban area with a history of outbreaks in day care centers. |
tion policy is still concentrated primarily on service-delivery roles; VFC, for example, is narrowly restricted to vaccine provision and some small amount of operational costs. The VFC program does not have the flexibility to supply resources to the states that could be used to support oversight of public- and private-sector performance in meeting the immunization needs of vulnerable groups. Section 317 appears to be the only federal program, at present, that provides opportunities and resources to support the states in developing performance measures that can help in managing the immunization system itself and responding to shortcomings within the private sector, rather than simply providing vaccines to individuals who request them or conducting short-term outreach programs.
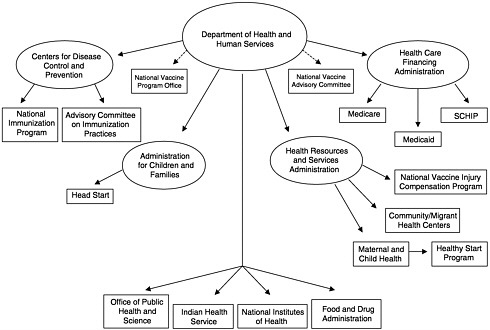
SIX ROLES OF THE NATIONAL IMMUNIZATION SYSTEM
To address the questions under its charge, the IOM committee constructed a new analytic framework to represent the fundamental roles of the national immunization system. At present, this system is often described in terms of the federal and state agencies that administer immunization services and programs (see, e.g., Figure 1–4) or the components of the state programs that are administered with Section 317 funds (termed “core functions” by CDC) (see Figure 1–5). The committee found that these representations inadequately illustrate the dynamics of the national immunization system because they do not address the interactions among public and private roles and responsibilities. Most important, the presence or absence of private health care services (including insurance coverage and benefits that encompass immunization services for children, adolescents, and adults at reasonable cost) influences the burden of effort required within the public sector to assure access to vaccines recommended for widespread use. Changes in the recommended vaccine schedule, as well as shifts in the quality of and access to primary care services for disadvantaged groups in any community, necessitate responses by the public sector to “gear up” or “gear down,” often in the face of static or declining resources.9
In examining current policies and practices in the public and private health care sectors, the committee identified six fundamental roles of the national immunization system:
-
Assure the purchase of recommended vaccines for the total population of U.S. children and adults, with a particular emphasis on the protection of vulnerable groups.
-
Assure access to such vaccines within the public sector when private health care services are not adequate to meet local needs.
-
Control and prevent infectious disease.
-
Conduct population wide surveillance of immunization coverage
|
Public Health Function |
Essential Services |
Immunization Core Functions |
Immunization Program Components |
|
Assessment |
• Evaluate effectiveness, accessibility, and quality of personal and population-based health services. |
Assessment |
• General assessment • Public clinic AFIXa • Private-sector AFIX • Registry • Perinatal hepatitis B prevention |
|
|
• Monitor health status to identify community health problems. |
Surveillance |
• Surveillance of vaccine-preventable disease adverse events • Perinatal hepatitis B prevention |
|
Policy Development |
• Develop policies/plans that support individual and community health efforts. • Enforce laws/regulations that protect health. • Research new insights and innovative solutions to health problems. |
Management Research |
• Program management • Partnerships • Program management |
|
Assurance |
• Diagnose and investigate health problems in the community. • Ensure the availability of a competent public health and personal health care workforce. • Inform, educate, and empower people about health issues. • Mobilize community partnerships to identify and solve health problems. • Link people to needed personal health services, and ensure the provision of health care when it is not |
Outbreak control Assuring service delivery Public Information/education Provider training Vaccine supply |
• Control of infectious disease • Service delivery • Perinatal hepatitis B prevention • WICb linkage • Outreach • AFIX • Registry • VFCc • Public education • Outreach • Professional information/education • Public clinic AFIX • Private-sector AFIX • Perinatal hepatitis B prevention • Vaccine management • VFC |
FIGURE 1–5 Immunization core functions. aAssessment, Feedback, Incentives, and eXchange of information. bSpecial Supplemental Nutrition Program for Women, Infants, and Children. Vaccines for Children. SOURCE: Information provided by CDC.
-
levels, including the identification of significant disparities, gaps, and vaccine safety concerns.
-
Sustain and improve immunization coverage levels within child and adult populations, especially in vulnerable communities.
-
Use primary care and public health resources efficiently in achieving national immunization goals.
The last of these roles provides overarching support for the other five, and was the focus of the committee’s charge. In conducting the study, we gave particular attention to the responsibilities of federal and state health agencies and the burden of effort required to support each of the above roles in an integrated manner. Figure 1–6 displays these roles as components of the national immunization partnership.
We recognize that the U.S. immunization infrastructure involves a broader set of activities than can be incorporated within the six roles described above. For example, the separate cycles of research, development, licensing, and production of vaccines and the selection of vaccines
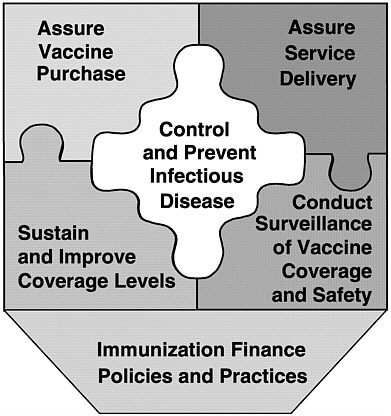
FIGURE 1–6 Six roles of the national immunization system.
for the recommended schedule of child and adult immunizations are important parts of the national immunization partnership; however, such efforts are not addressed in this report.10 Efforts to monitor vaccine safety and provide adequate compensation for adverse events related to vaccine use through special government trust funds represent an additional area of concern that lies beyond the framework for this study, although public concerns about the safety of vaccines have major implications regarding the level of resources necessary to sustain high immunization coverage rates.11
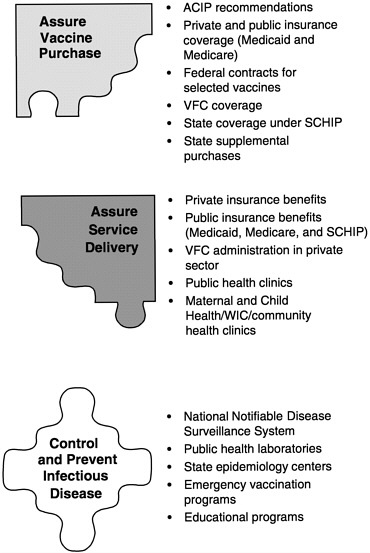
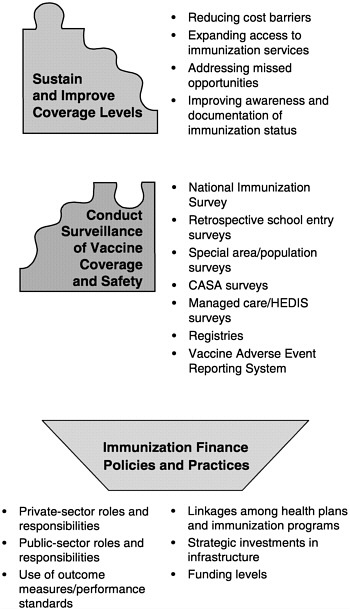
The six roles of the national immunization system are complex for three reasons. First, each encompasses an array of specific programs and functions (see Figure 1–7). Programs to improve immunization coverage rates, for example, include interventions to reduce vaccine costs, expand access to immunization services, address missed opportunities, improve documentation of immunization status, increase community demand for vaccinations, and establish requirements and incentives for providers. Likewise, the surveillance of immunization coverage rates may include a variety of tools and methods, including the National Immunization Survey, national surveillance studies, pocket-of-need assessment studies, regional and state immunization registries, and local-area surveillance studies that focus on specific populations.12
Second, the six roles of the national immunization system are not rigid or fixed, and certain other factors add to their complexity. Although they share common features, they are also elastic and decentralized, expressed in different ways over time within the broad array of public health efforts throughout the United States. A successful national immunization system requires that each role be present within each state, but their form, scope, and intensity will vary. For example, certain populations are easier to track than others, and the extent of monitoring efforts required will be proportional to the level of heterogeneity within the population and the complexity of the health service plans that serve their immunization needs. Likewise, the public costs of immunizing the first 10 percent of a large population, who often have private insurance and are motivated to request immunizations from their health care providers, are significantly lower than the costs of immunizing the final 10 percent, who rely fully on public assistance to cover their health care costs and vaccine purchases. The final 10 percent includes significantly larger numbers of individuals who are not routinely connected to health care service centers, who experience consistent disruptions in changes in residence and in health care coverage (and whose health records are consequently scattered across multiple sources), and who are socially isolated or distrustful of services that do not demonstrate a tangible or immediate health benefit. Targeted community assistance efforts are required to connect
these groups with immunization services and to sustain that connection over time. Financing that effort is expensive, and pay-offs may be small in terms of absolute numbers of individuals who are brought up to date in immunization coverage. Yet even small improvements in immunization coverage in high-risk areas have broad positive impacts within the general community, since they reduce the risk of outbreaks (and the costs of hospitalization or injury that may result), improve general health status, and demonstrate improvements in the quality of health care services within a selected region.
Third, the level of resources required for each state to perform each role effectively is not well understood, since immunization coverage rates are influenced by a broad mix of factors that include national health trends, local demographics and social conditions, and public and private health finance patterns. For example, some states (e.g., Alabama) rely heavily on public health clinics to immunize more than 80 percent of their disadvantaged populations. Such states may spend large amounts on vaccine purchase and direct services and invest little effort in assessing rates of immunization coverage among private providers because vulnerable groups are served directly by the public health system. In contrast, states (e.g., New Jersey) that rely primarily on private managed care plans to supply vaccines to Medicaid clients or other at-risk groups may spend less on direct services, but need to create incentives, regulations, or performance measures that establish accountability within the private health sector for achieving high levels of immunization coverage.
The complexity of the national immunization system should not discourage efforts to address the finance policies and practices that can ensure high levels of performance and direct resources to areas of need. Achieving consistency of effort in both service delivery and assessment of performance and coverage patterns is especially important, because history has demonstrated that when levels of protection begin to decline, disease outbreak occurs, and remedial action becomes necessary (NVAC, 1991). As noted earlier, unprotected sectors can unexpectedly become sources of infectious disease outbreaks and can serve as hosts to preventable pathogens such as pertussis. These lapses in public health preparedness have tremendous negative impacts involving loss of life, preventable morbidity, and financial cost. A strong and vigilant infrastructure is necessary to sustain coverage rates in the face of the changes in science, social conditions, and health care systems discussed above.
STUDY APPROACH
To respond to the six questions listed above, IOM formed the Committee on Immunization Finance Policies and Practices in December 1998.
The committee was tasked to conduct an 18-month study that involved both extensive data collection and careful deliberations about the nature, scope, impact, and cost of the national immunization partnership for both children and adults. The committee met five times to consider relevant research data and expert testimony (see Appendix C for a list of sources that contributed to the committee’s deliberations). The committee heard testimony from congressional staff; officials of federal, state, and local health agencies; and organizations representing public and private health care professionals.
In May 1999, the committee released an interim report that addressed two key concerns posed by CDC: (1) the experience with carryover (unobligated funds) in the administration of the Section 317 program, and (2) the impact of SCHIP on the need for federal Section 317 funds for both infrastructure initiatives and vaccine purchase (IOM, 1999a).
Recognizing that local circumstances and economic and social factors strongly influence the levels of need and the quality and scope of immunization services within the states, the committee organized two major fact-finding efforts to illustrate and compare the ways in which states allocate resources for health care services and infrastructure. These efforts included (1) a national survey of 50 states and the District of Columbia conducted by a research team at the University of Michigan,13 and (2) a set of eight case studies (Alabama, Maine, Michigan, New Jersey, North Carolina, Texas, Washington State, and a two-county comparison of San Diego and Los Angeles counties in California), prepared by a team of project consultants.14 Four site visits were organized to supplement the national survey and case study materials.15 State-level data were also drawn from background materials and data analyses provided by CDC’s National Immunization Program, including proposals submitted by case study states for Section 317 funds in FY 1992, 1995, 1999, and 2000.16 In addition, the committee sponsored a workshop on pockets-of-need issues, held in September 1999.
Committee members and staff met frequently with state health officials over the course of the study17 and received materials pertaining to state and private immunization efforts from the American Academy of Pediatrics, the American Association of Health Plans, the Association of Maternal and Child Health Programs, the Association of State and Territorial Health Officers, the Health Insurance Association of America, the National Association of City and County Health Officers, and the National Association of WIC Directors. Additional materials regarding state roles in public health were provided by the National Governors’ Association and the National Conference of State Legislatures. Information on public-and private-sector investments in immunization services was also obtained through literature searches.
ORGANIZATION OF THE REPORT
Five chapters follow this introduction. Chapter 2 explains how today’s U.S. immunization system differs from that of 1990 and earlier decades, and identifies emerging challenges and scientific opportunities in the decades ahead that have finance implications for the national immunization system. Chapters 3, 4, and 5 address the six roles of the national immunization system: vaccine purchase and service delivery (Chapter 3); infectious disease prevention and control, surveillance of vaccine coverage and safety, and efforts to improve and sustain coverage rates (Chapter 4); and immunization finance policies and practices (Chapter 5). Throughout Chapters 2 through 5, the committee’s findings are in italics. In Chapter 6, the committee uses these findings to respond to the six questions posed under our charge and to formulate a final set of conclusions and recommendations.
ENDNOTES
|
11. |
Vaccine safety issues have been addressed by several IOM reports, including Research Strategies for Assessing Adverse Events Associated with Vaccines: A Workshop Summary (IOM, 1994a), Adverse Events Associated with Childhood Vaccines: Evidence Bearing on Causality (IOM, 1993), and Adverse Effects of Pertussis and Rubella Vaccines (IOM, 1991). |
|
12. |
In addition, vaccine safety reporting systems (e.g., the Vaccine Adverse Events Reporting System), add another dimension to the role of surveillance. |
|
13. |
The survey was conducted by a team that included Gary Freed, MD, MPH, principal investigator; Sarah Clark, MPH; and Anne Cowan, MPH, all in the Division of General Pediatrics at the University of Michigan. See Appendix D for a brief overview. |
|
14. |
See Appendix E for a detailed description of the case study selection and preparation methods. |
|
15. |
Site visits were conducted within four of the case study states: Detroit, Michigan; Newark, New Jersey; Houston, Texas; and Los Angeles and San Diego, California. |
|
16. |
As noted, one case study involved a two-county comparison in California. County-level data were included in California’s statewide grant proposal. |
|
17. |
These meetings included a CDC meeting with national partners in March 1999 (Atlanta), a CDC meeting with state immunization directors in April 1999 (Atlanta), and the National Immunization Conference in June 1999 (Dallas). In addition, the following state and local health officers presented testimony at meetings of the IOM committee: David Johnson, Deputy Director and Chief Medical Executive, Michigan Department of Community Health, Lansing; Donald Williamson, State Health Officer, Alabama Department of Public Health, Montgomery; Christine Grant, Acting Commissioner, New Jersey Department of Health and Social Services, Trenton; Steven Friedman, Assistant Commissioner, New York City Health Department; Eleni Sfakianaki, Medical Executive Director, Dade County Health Department, Miami, Florida; Akiko Kimura, Medical Director, Immunization Program, Los Angeles, California; Babatunde A.Jinadu, Kern County Health Department, Bakersfield, California; Edd Rhoades, Chief, Maternal and Child Health Service, Oklahoma State Department of Health, Oklahoma City; and Natalie Smith, Chief, Immunization Branch, California State Health Department, Berkeley. |


