
Ocean Studies Board Commission on Geosciences, Environment, and Resources National Research Council May 2000
Summary Review of the Summer Flounder Stock Assessments1
The National Academy of Sciences was mandated by Congress to evaluate whether the summer flounder stock assessments, and the assumptions used to make these assessments, are reasonable. The National Research Council formed the Committee on Improving the Collection and Use of Fisheries Data to undertake this task (see Appendix for committee list), as well as to examine broader issues of fisheries data collection, management, and use. The committee fully reviewed the summer flounder stock assessments of 1997 and 1999 and held public meetings to hear the concerns of commercial fishermen, recreational fishermen, and environmental advocacy groups related to those summer flounder assessments. The committee used two approaches to examine the assessments. First, the summer flounder data were evaluated using different stock assessment models: the ADAPT model, a Virtual Population Analysis (VPA) model, and a CAGEAN-like model implemented using Fournier ’s AutoDifferentiation Model Builder software.2 Second, sensitivity analyses were conducted using a VPA model to test a number of the assumptions used in the assessments. (The details of these analyses will be included in the full report.)
Assessment Models
Three analyses of summer flounder data by three different individuals using three different stock assessment models yielded the same general decadal trends indicated by the 1999 National Marine Fisheries Service (NMFS) assessment (see Figure 1 andFigure 4). Namely, these analyses showed that the spawning stock biomass has recovered substantially from a trough in the early 1990s and that fishing mortality dropped substantially during the same period. The committee believes both changes are probably due to strict management measures implemented in 1992.
However, the models yielded some differences in predictions that are relevant to the upcoming Stock Assessment Workshop. Because all the models used the same data, differences in the estimates arose due to the structural assumptions of each modeling method. Model
|
1 |
This brief report summarizes some of the findings and recommendations from a more detailed NRC report, Improving the Collection, Management, and Use of Marine Fisheries Data, to be released in June 2000. This material is being made available in advance of the full report in order to assist in the Stock Assessment Workshop for summer flounder, scheduled to begin on May 30, 2000. This report is funded in part by a contract from the National Oceanic and Atmospheric Administration. The views expressed herein are those of the authors and do not necessarily reflect the views of NOAA or any of its subagencies. |
|
2 |
ADAPT and CAGEAN are not acronyms; they are the names of models. The AutoDifferentiation Model Builder software is described in Fournier, D. 1996. An Introduction to AD Model Builder for Use in Nonlinear Modeling and Statistics. Otter Research Ltd., Nanaimo, B.C., Canada. The committee’s use of the AD Model Builder software does not constitute endorsement of this commercial product. |
structure introduces implicit assumptions, and some models are built to be robust by “hard-wiring” the way some factors are handled. These assumptions often go unstated, but in this case conflicting signals in the data dramatically influenced model results. It is important to note that our analysis does not necessarily indicate that the NMFS results are incorrect or that any of our specific results are correct. However, the analysis does show that the assumptions are influencing the results and that their influence should be acknowledged explicitly and used to help understand the dynamics of fish populations.
In recent years, where the estimates are most critical, the model estimates of spawning stock biomass differ most dramatically from each other (Figure 1). All of our model biomass estimates are lower than the NMFS estimates in recent years. In particular, NMFS assessments show an increase in spawning stock biomass in recent years, whereas our results indicate that the spawning stock biomass may have stabilized or fallen during the same time period. The committee was able to narrow down the likely causes of these differences and believes they are related to the structure imposed on fishing mortality-at-age in the various models. This structure is implemented in the assumption of separable selectivity and full recruitment fishing mortality in the CAGEAN model and by the level set for the “shrinkage” control assumption in the VPA and ADAPT models. The separable selectivity assumption in the CAGEAN model forces selectivity-at-age to remain fixed over time. The shrinkage factor, used in the ADAPT and VPA models, controls how quickly fishing mortality (F) is allowed to change from year to year.
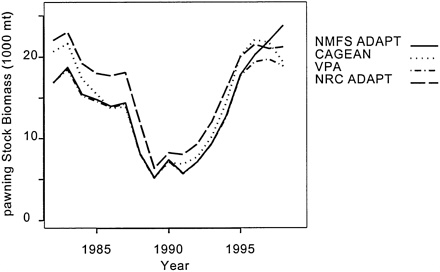
FIGURE 1 Summer flounder spawning stock biomass as estimated by NMFS, as compared with three independently conducted model applications. NOTE: NMFS = National Marine Fisheries Service, NRC = National Research Council, and VPA = virtual population analysis.
The CAGEAN model shows the most distinct drop in spawning stock biomass in recent years because it does not have the flexibility to deal with the decrease in younger fish seen in both the catch-per-unit-effort (CPUE) and the catch-at-age data. The behaviors of the VPA and ADAPT models appear to be related to the degree of variability in fishing mortality allowed through the shrinkage applied to fishing mortality-at-age. Although the controls imposed by these models take place through different mechanisms, both types of controls decrease the degree
to which the estimates of fishing mortality-at-age can depart from what was estimated in the past. We believe that some degree of shrinkage is appropriate in all assessment models, because if the F values are not constrained they may drift, especially for younger age classes in the most recent years. Alternatively, if analysts believe that F values should not be constrained, the analysts should justify why fishing mortality-at-age for these younger age classes is expected to change (e.g., through changes in recruitment or in the bycatch or discard mortality rates). Such changes may not be obvious in outputs showing only annual fishing mortalities averaged over age classes.
Models differ in how they deal with conflicting data, such as seen in the survey CPUE data (Figure 2). The relative abundance indices appear to have peaked with the 1995 cohort. The trends indicated by the two observations available for the 1998 cohort (shown in Figure 2 as age 0 and age 1) go in opposite directions. For example, the survey CPUE of year-0 summer flounder is increasing, whereas the survey CPUE for year-1 fish is decreasing. This creates a conflict in the data that may lead to equally likely, but conflicting, trends in model estimates. To explore and address this issue, a modification was made to the CAGEAN model to allow for some variation in selectivity over time.3 When the CAGEAN model was used with varying selectivity at age 0 and age 1, the spawning stock biomass estimates more closely followed those derived under the 1999 NMFS assessment (results not shown). This indicates that the selectivity assumption caused at least some of the differences in the outputs of the NMFS ADAPT and CAGEAN models. Selectivity estimates, as portrayed in fishing mortality estimates at age (shown in Figure 3), show a sharp drop in recent years, which the model assumes corresponds to changes in selectivities in commercial and recreational fisheries. This assumption, if false, could mask more serious alternative processes that also could provide an explanation for the trends, such as a drop in recruitment in recent years.
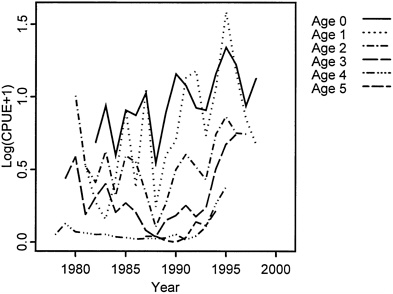
FIGURE 2 Log(CPUE+1) averaged over surveys for each age class and lagged so that cohort indices coincide. NOTE: CPUE = catch-per-unit-effort.
|
3 |
This was done by allowing deviations to occur in the log selectivity-at-age with a penalty applied to the sum of the squared deviations in the log-likelihood formulation used to specify the optimization surface. |
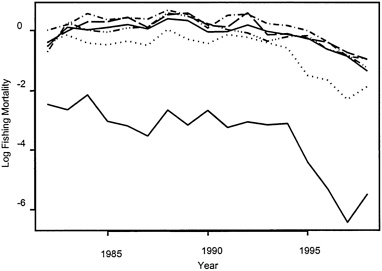
FIGURE 3 Estimates of fishing mortality from the CAGEAN model with varying selectivity-at-age (see Figure 2 for legend).
Estimated fishing mortality rates varied greatly among the models (Figure 4). In the last year of the series, each method produced almost the same estimate of fishing mortality, yet all are above the fisheries management target level for F of 0.24.
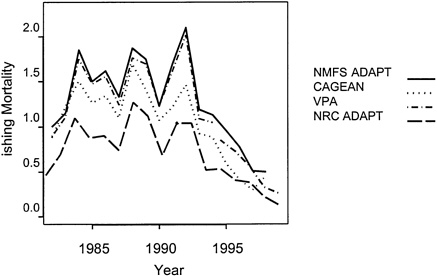
FIGURE 4 Summer flounder fishing mortality for ages 2-4 as estimated by NMFS and compared with three independently conducted model applications (see Figure 1 for legend).
Stock assessment scientists responsible for summer flounder should investigate how differences among model results arise and whether such differences indicate changes needed in the models or assumptions used. Participants in the Stock Assessment Workshop should try to test the effects of shrinkage and should investigate the conflicting trends in the youngest year classes. As stated in the 1998 NRC report Improving Fish Stock Assessments4:
Because there are often problems with the data used in assessments, a variety of different assessment models should be applied to the same data. . . . The different views provided by different models should improve the quality of assessment results. (p. 113)
This advice is borne out by the current committee’s reassessment of summer flounder data.
In the summer flounder case, the NMFS assessment could be improved by analyzing the same data using different models. The differences obtained should help analysts learn about problems in the data, problems in using the ADAPT model with these data, or problems with the assumptions used in the NMFS ADAPT model (e.g., related to shrinkage and changes in selectivity over time).
Assessment Implementations
The committee also investigated concerns about the summer flounder stock assessment by analyzing data using the VPA method a number of times and changing single assumptions for different runs. The most significant finding for the upcoming SAW to consider relates to the number of age classes used to tune the assessment model. Survey data on age classes 5 and older typically are excluded from the analyses for all but the NEFSC winter survey (available only since 1992). This is due in part to the difficulty some assessment procedures have in dealing with sparse data, observed zero values, or missing data, which are more common for older age classes. Committee analyses determined that the assessments can be sensitive to the number of age classes included in assessments. Therefore, future NMFS assessment activities for summer flounder should include more year classes (up to age 7) to tune the model and decrease the possibility of missing changes in fishing mortality on older ages. This will be particularly important as the summer flounder population recovers and includes a greater proportion of older fish.
Much more detailed analyses, and additional findings and recommendations, will be presented in the full report, Improving the Collection, Management, and Use of Marine Fisheries Data.
|
4 |
National Research Council. 1998. Improving Fish Stock Assessments. National Academy Press, Washington, D.C. |


