
CHAPTER 26
MONITORING BIOLOGICAL DIVERSITY FOR SETTING PRIORITIES IN CONSERVATION
F.WILLIAM BURLEY
Senior Associate, World Resources Institute, Washington, D.C.
Identifying the elements of biological diversity and monitoring their changes through time is a daunting task. Biologists have long recognized that the full array of biological diversity will never be known completely—that is, not all species and ecosystems will be identified, named, cataloged, and studied in any detail before many of them are lost. For example, it is likely that there are many more than 10 million species living today. Only 1.4 million of these have been described and named, and a tiny fraction of them have been studied thoroughly for potential use by humans. Ecosystems also vary greatly in size, composition, complexity, and distribution, and it is not uncommon for ecologists to differ in describing and defining them. For example, despite many studies by vegetation ecologists and biogeographers in the United States, today there is no single, agreed-upon vegetation classification that can be used by the federal land-management agencies or by the many state and private organizations that could productively use a national classification scheme.
All this makes the work of systematically conserving species and ecosystems more difficult. It presents a real problem when we try to determine how well various ecosystems are protected or represented in the global, national, and state systems of protected areas (Harrison et al., 1984).
THE GAP ANALYSIS CONCEPT
To tackle this problem, conservation biologists for years have intentionally or unwittingly used the process called gap analysis to establish short-term and longer-term conservation priorities. The concept is deceptively simple, if not simplistic:
within a particular country or region, first identify and classify the various elements of biological diversity in several ways. Then examine the existing and proposed systems of protected areas and other land-management units that help conserve biological diversity. Finally, using various classifications, determine which elements (e.g., major ecosystems, vegetation types, habitat types, species) are unrepresented or poorly represented in the existing system of conservation areas. Once this is known with reasonable precision, priorities for the next set of conservation actions can be established. The process continues indefinitely, and the conservation system is refined as land use changes and as better information about the distribution and status of species and ecosystems is obtained.
In practice, this process usually entails comparing and analyzing many different sets of information by using maps or computers to identify, for example, the gaps in coverage. Many countries have begun this process, but unfortunately, very few have attempted it in a thorough, systematic fashion with defined conservation objectives. Notable exceptions include Great Britain, Peru, Australia, and South Africa (Specht et al., 1974).
The example from Australia illustrates the process well. By the mid-1970s, there was an adequate description of the major vegetation types found throughout Australia. A comprehensive review of the various park and reserve systems was begun to determine which vegetation types were already represented and seemingly adequately protected. The thoroughness of this effort varied considerably from state to state, but by the late 1970s and early 1980s, it was becoming possible to make more objective statements about which vegetation types were poorly represented in the national and state systems and therefore which ones needed conservation attention first. The state of Queensland has taken this broad-scale analysis one step further (Sattler, 1986). The Queensland National Parks and Wildlife Service recently completed mapping the vegetation of Queensland’s 90 national parks, environmental parks, fauna reserves, and scientific reserves larger than 1,000 hectares, and it now is analyzing gaps in the representation of vegetation types by protected areas. As these are identified, steps will be taken to protect or otherwise conserve good representative examples of the highest-priority vegetation types (Sattler, 1986).
AN UNDERLYING CONCEPT
An important concept underlies the gap analysis process: by ensuring that all vegetation types are well represented in a system of conservation areas, it is assumed that much if not most of the biological diversity (species and ecosystems) will be protected. Systems in practice verify this, e.g., in much of the United States, Australia, and Europe, but in addition, special efforts must be made to ensure the protection of particularly critical species and ecosystem types.
Debates continue to rage among biologists about the minimum critical sizes of populations and ecosystems that are necessary to conserve the biota over the long term. A very practical question emerges from these debates: should a particular ecosystem type already represented in the system of conservation areas be better represented, or should the next conservation effort be aimed at conserving other
ecosystems that are either unrepresented or not adequately represented? All these considerations and unanswered questions in conservation biology do not obviate the need for gap analyses in all regions and countries, however, because inevitably we must have a good information base on which to base better conservation decisions.
Gap analysis exercises similar to the one for Australia mentioned above have been undertaken in other countries. In Chapter 29, Huntley describes progress to date in several countries of southern Africa. A somewhat similar process is also being used to identify global priorities in plant conservation, as described by Williams and Lucas in Chapters 28 and 30, respectively.
In the United States, no such countrywide analysis of ecosystems exists, except for several very preliminary studies using coarse classifications of ecoregions and the most general vegetation types. The federal agencies have never agreed on the methods to be used, but a nongovernmental organization, The Nature Conservancy, has made the most thorough state-by-state investigations using several vegetation classifications and all the species distribution data available. By developing a standardized methodology for all the states, the Conservancy is now able to make regional and preliminary national assessments of the most important gaps in ecosystem and species coverage, thereby establishing conservation priorities in a more systematic fashion than was previously possible. Chapter 27 by Jenkins describes this effort further.
On the global scale, the International Union for Conservation of Nature and Natural Resources (IUCN) and the World Wildlife Fund have worked over the past decade to identify major conservation priorities. A biogeographic classification developed by Dasmann, Udvardy, and others was used to determine which major biomes and biogeographic provinces worldwide are relatively well represented in the global system of protected areas and where there are major gaps in the system (Udvardy, 1975). The analysis itself does not take into account the quality or level of management (and therefore the degree and quality of protection) of the conservation areas, but it has been useful to IUCN and others in helping to determine the allocation of program funds and to design conservation activities on a global scale and in particular regions. IUCN is carrying this global analysis further, and its Commission on National Parks and Protected Areas is coordinating a series of regional analyses to identify high-priority ecosystems and to recommend the establishment of additional protected areas (MacKinnon and MacKinnon, 1987).
The next step in refining this process, however, is to do essentially the same type of analysis at the country and local levels. This is already under way in several Latin American countries. The Conservation Data Center (CDC) in Lima, Peru, for example, recently analyzed gaps in ecosystem coverage by overlaying biogeographic provinces, life zones, selected vegetation types, and existing and planned conservation areas. Although biologists in Peru have known for some time that the Andean cloud forests and coastal vegetation types were being decimated by human impacts and were important ecosystems to be conserved, the gap analysis done by the CDC revealed these priorities in a much more systematic, quantified way and identified particular areas that should be put under some form of protective management.
Unfortunately, however, most developing countries are not this far along in the process. This is ironic, because the cost and time needed to reach this level of data richness are not great, and a small team of biologists could pull together the necessary information in much less than a year. If every country in the tropics, for example, could generate this level of conservation information quickly, it would mean that more objective conservation priorities could be identified and made available for use not only by conservationists but also by land-use planners and development agencies.
REFERENCES
Harrison, J., K.Miller, and J.McNeeley. 1984. The world coverage of protected areas: Development goals and environmental needs. Pp. 24–33 in J.A.McNeeley and K.R.Miller, eds. National Parks, Conservation, and Development. Smithsonian Institution Press, Washington, D.C.
MacKinnon, J., and K.MacKinnon. 1987. Review of the Protected Area Systems of the Afrotropical Realm. International Union for the Conservation of Nature and Natural Resources, Gland, Switzerland. 350 pp.
Sattler, P.S. 1986. Nature conservation in Queensland: Planning the matrix. Proc. R. Soc. Q. 97:1–21.
Specht, R.L., E.M.Roe, and V.H.Boughton, eds. 1974. Conservation of Major Plant Communities in Australia and Papua New Guinea. Aust. J. Bot., Supp. No. 7. Commonwealth Scientific and Industrial Research Organization, East Melbourne, Australia. 667 pp.
Udvardy, M.D.F. 1975. A Classification of the Biogeographical Provinces of the World. IUCN Occasional Paper No. 18. International Union for the Conservation of Nature, Merges, Switzerland. 48 pp.
CHAPTER 27
INFORMATION MANAGEMENT FOR THE CONSERVATION OF BIODIVERSITY
ROBERT E.JENKINS, JR.
Vice President, Science Programs, The Nature Conservancy, Arlington, Virginia
Everyone is beginning to recognize that biodiversity at all levels—gene pool, species, and biotic community—is important for many reasons and that it is being rapidly diminished by habitat destruction and other damaging influences resulting from human population growth, pollution, and economic expansion. No one seems to think that we can do anything effective to control the root causes soon enough to provide breathing space for the biota, so biological conservationists devote themselves to the use of techniques that are believed to be helpful in the context of a shrinking natural estate. All these techniques involve forms of triage, increasingly complex interventions, and decreasing margins for error. To conserve biodiversity in less and less space under greater and greater pressure requires that we have more and more knowledge.
We need to know about the existence, identity, characteristics, numbers, condition, status, location, distribution, and ecological relationships between biotic species and biological communities or assemblages; their individual occurrences in the landscape; existing preserves and what they contain; the most important unprotected areas; related land ownerships; and sources of further information, among other things. With such knowledge we can select and design new preserves, improve existing ones, determine what sort of management is needed, establish priorities for ex situ conservation of species, monitor changing status, note restoration opportunities, and maybe even decide where we need to cut our losses and move on.
Of course much of the basic information we would like to have has not even been collected in the field or, if collected, not yet developed into usable form. Kosztarab (1986, p. 23) estimated that “In the United States biologists have described only one-third of the living organisms and their developmental stages.”
Erwin (1982) has shown that the extent of our knowledge of the tropics is much more limited. From his collection of insects in tree canopies, he estimates that there may be 30 million species of organisms on Earth. This means that only about 5% have been described and classified at the species level, much less for all their developmental stages. Most of the undescribed organisms are invertebrates, fungi, and nonvascular plants. Kosztarab (Virginia Polytechnic Institute and State University, personal communication, 1986) believes it would take 50 entomologists 40 years just to describe the rest of the insects in the United States, not counting the work needed for additional collecting. It is implausible to think that we can mount a sufficient effort to amass this basic knowledge in time to have much bearing on the conservation of biodiversity. Fortunately, we can do a lot with the basic information already in hand.
Before existing data can be put to use, they must be compiled from scattered secondary sources and repositories and organized into usable form. Accomplishing just this is a very complicated matter, much more so than can be realized without getting deeply into such matters as the details of system design, operational administration, and interinstitutional arrangements. The job would be quite challenging under ideal conditions, but in virtually all instances, this work has had to be carried out under severe financial constraints. Therefore, it is no wonder that many attempts to master the data compilation task have failed. The rest of this chapter describes an effort that seems to be succeeding.
NATURAL HERITAGE DATA CENTERS
The Nature Conservancy was established to conserve biodiversity by establishing natural area preserves. These preserves are selected and designed to protect examples of the widest possible spectrum of native ecosystems and species habitats. It was always clear that identifying the most important areas to be conserved was crucial to making the best use of limited resources. Therefore, gathering and organizing scientific information for conservation became one of the first orders of business. For many years, however, we were overmastered by the complexity of the task, and even the best of our efforts were essentially defeated by methodological flaws, limited duration of effort, underfunding, and similar problems.
In 1974, in cooperation with the South Carolina Department of Wildlife and Marine Resources, The Nature Conservancy initiated the first of what are called State Natural Heritage Inventories. In this program, we finally brought together a sufficiently well-engineered mix of concepts and operational procedures for data gathering and management to successfully function as an efficient and effective tool for planning the conservation of biological diversity. The methodology used in that program has been continuously improved since 1974 and has become the most systematic, comprehensive, and widely used technology in existence for gathering and organizing the information needed for biodiversity conservation. (See Jenkins, 1985, for fuller explanations.)
Natural Heritage Data Centers now exist in nearly every state of the United States, almost always as cooperative ventures between agencies of state government and the Conservancy (see Figure 27–1). Heritage inventory technology is also being
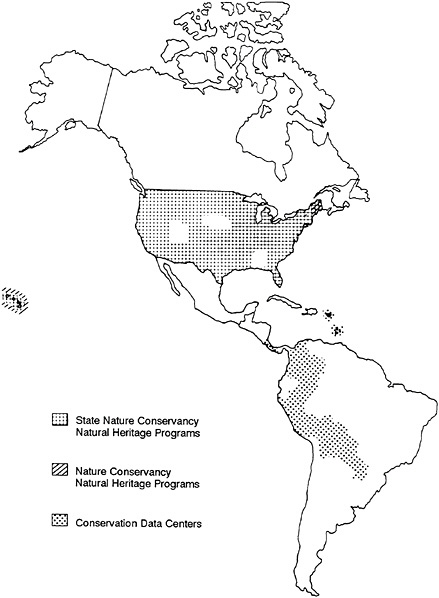
FIGURE 27–1 Distribution of the Natural Heritage Data Centers in 1986.
used to help an increasing number of Latin American institutions to develop their own Centres de Datos para la Conservacion (CDCs), and requests for assistance in starting more such data centers have been coming in from other institutions all over the world. Collectively, the existing programs employ more than 250 biologists and have total annual operating budgets over $10 million.
Each of these inventories used a highly standardized methodology, which provides some important economies in terms of system development and administration. In
other words, because of this standardization, the Conservancy has been able to develop, refine, and support systems on a very efficient basis, drawing new experience from all over, incorporating it into the central model, and propagating it throughout the network. Standardization also facilitates data exchange among the individual programs and permits higher order aggregation of data derived from many data centers.
NETWORKING AND CENTRAL DATA BASES
The standardization referred to above does not merely facilitate higher order aggregation of data, it virtually demands it. To optimize the effectiveness of the crucial bottom-up data collection of the individual centers, the Conservancy has gradually accumulated more and more data in a series of national data bases. We needed, for example, to have consistent taxonomic names for species to avoid the confusion brought about by locally used synonyms. We therefore kept central lists of names along with standard “element” codes for all rare and endangered plant and animal species being investigated by any state program. (An “element” is a species, a community type, or some other feature or phenomenon of special interest to conservationists.) We also began to accumulate national Element Manual Files on such species with information added and extracted by individual Heritage programs. We first thought that our central files would only accumulate information on a limited number of rare species. Since everything is rare somewhere in its range, however, we eventually discovered that we had at least some information on nearly every vascular plant and vertebrate animal species in the United States. We therefore went ahead and entered data on the rest of the species in these groups. We also have extensive information on species in other taxonomic groups, and these species- and community-type tracking data bases have become the most comprehensive compilations of such information in existence (Figure 27–2).
Beyond standard taxonomy, there are many other data of common interest to more than one geographic area. To spare each data center the redundant effort of collecting and managing such data, we are dividing the labor by assigning lead responsibility for a given data item to one data center; results are then added to the central data bases, from which the other centers needing that same information can retrieve it.
We have also found it useful to work this process in reverse, by undertaking special projects to add data obtained directly from national or regional sources for downloading to one or more individual data centers. From the beginning we have been compiling data from the National Museum of Natural History, for example, and then sending it back to Minnesota or Arizona where it came from. The central data bases are greatly facilitating this sort of procedure. Another reason for creating central data bases is the increasing need to compare information over wider geographic areas in order to gain a better perspective on the relative significance of conservation objectives and projects and to monitor status changes across a species’ or community’s entire range.
In addition to the central data bases on North America, the Conservancy’s international office has made significant progress through a special Latin American
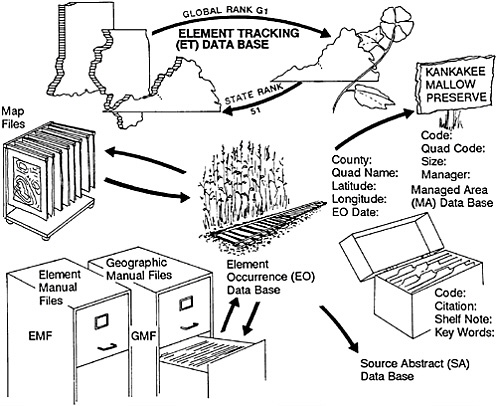
FIGURE 27–2 Data-processing procedure in the Natural Heritage program.
Biogeography Project in assembling parallel data bases on the biota, ecosystems, and conservation areas throughout the rest of the Western Hemisphere. These central data bases are in Spanish and exchange information with the Latin American Conservation Data Centers. Since so many of the Latin American scientific data are located in U.S. repositories, the kind of top-down data repatriation from the central data base referred to above will be particularly helpful to the CDCs.
Altogether, the network of local and central data bases, with its continually improving methods and procedures, has become a sort of machine for collective learning and retention of carefully winnowed facts. This network has been cumulatively amassing an immense body of knowledge with the capability of providing ever better insights about biological conservation needs and priorities. It is already being tapped as an important aid to decision making by a continually widening usership.
APPLICATIONS OF THE DATA
Following are some of the principal uses of these data:
-
Facilitating continuing inventory. By organizing data well enough to tell what is and is not known, data needs can be targeted with precision. This is crucial in
-
order to use our limited resources efficiently and to avoid choking the data system with low-value data.
-
Conservation priority setting. By its process of continual data enhancement, the Heritage network obtains an ever-better picture of the relative endangerment of species, natural communities, and other natural features. This perspective is encapsulated in Element Priority Ranks. These are assigned to each species and community type on a comparative basis through the use of consistent criteria of rarity, threat, etc. From these, we determine which species to recommend for listing by the Office of Endangered Species, which should be taken off the list, which are candidates for ex situ conservation, which species and communities are most in need of habitat protection, and other categorizations. Specific Element Conservation Plans are developed for many species and communities, and like everything else, are continually revised.
-
Preserve selection. The greatest threat to biodiversity comes from habitat destruction. The identification of areas that still sustain the critical elements is one of the most important tasks of a heritage program. The Element Tracking and Site Tracking lists are continually revised to organize the most focused biological land conservation agenda possible.
-
Preserve design. Once a site has been selected as a potential preserve, the Heritage or Conservancy staff undertakes intensive field investigations and defines optimal boundaries for a viable, defensible, and manageable preserve for the targeted species or community. Individual property ownership tracts within each site are also identified.
-
Land conservation administration. The Site Tracking lists, the Site, Tract, and Managed Area (existing Preserve) data bases, and various other data bases and files are used to organize the actual land protection effort. The systematization of this activity is facilitating the more efficient and sophisticated use of a full spectrum of protection devices from land owner notification to registration, rights-of-first-refusal, cooperative management agreements, leases, easements, agency designation, and land acquisition (see Hoose, 1981). It is also helping in coordination of the activities of many separate agencies and institutions, e.g., in the Tennessee Interagency Protection Planning Committee.
-
Element status monitoring. A large fraction of the total heritage data consists of records on Element Occurrences (actual field localities with rare species populations, rare community remnants, or other features). Collectively, the network manages data on more than 150,000 such occurrences, including data on all the rarest and most endangered elements known. This enables any user to make a very quick field reassessment of status, often with the assistance of cooperators from the Heritage Data Center itself or from among its other users. For the rarest biodiversity elements, all necessary efforts to monitor their status, such as establishing permanent plots and conducting annual population censuses, are being undertaken.
-
Element management. Special efforts are devoted to the biodiversity elements that require for survival not only protection but also active management. Through Element Stewardship Abstracts and manual files, we attempt to compile pertinent information on their ecological responses to various management options and to put this information to use in the field.
-
Site management. Site Stewardship Summaries and Managed Areas Records aid in various administrative and monitoring activities on existing preserves.
-
Development planning. Information from the data centers is available to all legitimate users, including corporations and consultants engaged in land development. By supplying information about sensitive sites and project design requirements before decisions and investments have been made, less-damaging alternatives are chosen and much fruitless conflict avoided.
-
Environmental impact analysis. Most of the state programs are routinely consulted on all proposed projects requiring special permits or adherence to various environmental regulations. Objective reviews based on real data are highly valued by everyone involved and produce the same kinds of results as above. A typical state program may review more than 2,000 project proposals a year.
-
Access to additional information. Information in the system is flagged with citations to published documents, individual experts, museums, agency files, other existing data bases, map series, unpublished data on file, etc. This greatly facilitates follow-up investigations by system users and magnifies the utility of other data repositories.
-
Predictive modeling. There is a lot of very definite information in the network, much of it associative, e.g., species with habitats, one species with another, total composition of communities, and habitat-habitat juxtaposition. Some of this lends itself to predictive extrapolation for a variety of purposes. Some of the newer units of the evolving system, such as the Vertebrate Characterization Abstract, facilitate prediction of what is most apt to occur in as yet unsurveyed landscapes.
-
Research. Many of the kinds of uses cited above, such as finding field localities of entities or combinations of entities desired for study, can be of assistance to the scientific community. The data bases also constitute one of the largest and most accurate biogeographic resources in existence and may increasingly be used directly as grist for the analysis mill. As a conservation planning device, the Heritage enterprise can also help identify for the growing body of conservation biologists which research problems could produce practical results for applied conservation in such areas as minimum critical habitats, minimum viable population sizes, genetic variation among metapopulations, landscape ecology and patch dynamics, the role of corridors between reserves, management of vegetation succession, nuclear preserves in macrosites, and archipelagos of associated reserves.
In these ways the Heritage data network is put to a tremendous amount of use. Just in conservation or development siting and land management, we estimate that the U.S. programs alone are consulted on more than 50,000 decisions per year. The total amount of practical use is much greater.
INTERACTIONS WITH SCIENTISTS AND THE PUBLIC
The Heritage programs do not accomplish all these things alone—they simply specialize in long-term organization and management of information needed for the conservation of biodiversity. They are not the original source of the vast majority of data, they do not try to be a substitute for the systematic community
on species taxonomy, they do not undertake the job of the museums, they do not engage in comprehensive, scientific abstracting or bibliographic work, they are not usually an active conservation or land management entity, and they are not an environmental regulatory agency. Therefore, they depend on cooperative relationships with a broad array of other individuals and institutions as both contributors to the effort and users of it.
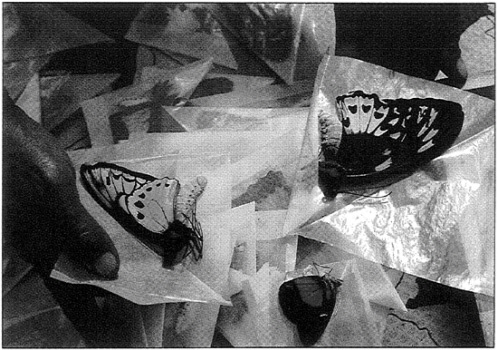
If it weren’t for John Kartesz’ monumental and heroic compilations in botanical taxonomy, for example, I don’t know what we would do in this area (Kartesz, 1985; Kartesz and Kartesz, 1980). We are similarly indebted to the Association of Systematic Collections for much of our vertebrate taxonomy. The Center for Plant Conservation is a major user of data on plant status and distribution for their conservation collections for which they will be keeping parallel and mutually accessible data bases. The U.S. Fish and Wildlife Service is our closest cooperator on endangered species and even funds some of our status surveys. Paul Opler of the U.S. Fish and Wildlife Service has compiled Global Element Ranking forms on most of the butterflies in the United States as a labor of nights and weekends. The U.S. Forest Service is cofunding a regional ecologist to work on plant community classification in the Southeast. Stanford’s Center for Conservation Biology is cooperating closely with the Conservancy on its studies of minimum viable populations and preserve design. We freely exchange information and efforts with the National Park Service Natural Landmarks program. Various utility companies have provided financial support for Heritage inventories so they can learn whether their proposed power lines are going to run afoul of endangered species populations or other significant elements of biodiversity. Private foundations, including the A.W.Mellon Foundation, the J.N.Pew Charitable Trust, the Hewlett Foundation, the MacArthur Foundation, and many others, have supported this work because they believe it can make a difference. Innumerable individual scientists and natural historians are working with the network. U.S. and Latin American data centers are being used as first and last stops for many field biologists, that is, they use the centers to learn what is known and what needs to be learned in their areas of interest and then report their discoveries to the centers so the data can be put to good use. I cannot begin to cite all the individuals and organizations without whose cooperation this work could not proceed.
The Natural Heritage Data Network is the furthest thing imaginable from a proprietary enterprise. It has been developed with the goal of serving the needs of anyone and everyone involved in the conservation of biodiversity, all of whom are cordially invited to work with the various operating units within the system as much as possible in the furtherance of the system’s purposes and of their own.
REFERENCES
Erwin, T. 1982. Tropical forests: Their richness in Coleoptera and other arthropod species. Coleopterists Bull. 36(1):7475.
Hoose, P.M. 1981. Building an ark: Tools for the preservation of natural diversity through land protection. Island Press, Covelo, Calif.
Jenkins, R.E. 1985. Information methods: Why the Heritage programs work. Nature Conservancy News 35(6):21–23.
Kartesz, J.T. 1985. 1985 Draft Revised Kartesz Vascular Plant Checklist. Unpublished review draft distributed by the author, Reno, Nev. 694 pp.
Kartesz, J.T., and R.Kartesz. 1980. A Synonymized Checklist of the Vascular Flora of the United States, Canada, and Greenland. University of North Carolina Press, Chapel Hill, N.C. 498 pp.
Kosztarab, M. 1986. Prefatory comments: Some of the activities leading to this symposium. Pp. 23–27 in K.C.Kim and L.Knutson, eds. Foundations for a National Biological Survey. Association of Systematics Collections, Lawrence, Kans.
The Nature Conservancy. Undated (continually revised). Natural Heritage Program Operations Manual (some parts available on request).
CHAPTER 28
IDENTIFYING AND PROTECTING THE ORIGINS OF OUR FOOD PLANTS
J.TREVOR WILLIAMS
Director, International Board for Plant Genetic Resources, c/o Food and Agriculture Organization, Rome, Italy
Plants that are used for food present special problems in the monitoring of genetic diversity and its conservation. The diversity of food plants in existence today evolved over the past 10,000 years or so since the origins of agriculture in the Neolithic era. The progenitors of cultivated plants were wild species, which along with countless others were harvested by hunters and gatherers. The genetic diversity of crops increased greatly as the wild species were domesticated and were moved from environment to environment; cultivars adapted to specific environments and were put to different uses. Many cultivars must have been discarded even in early days, but some of them remained in certain areas and others diversified further as they were taken far from their original homes. Hence, the evolution of major crops has been a continuing process—from the wild progenitors to the products of modern plant breeding and genetic manipulation.
By contrast, other species have been used as food but have never been domesticated. Included among these are a multitude of minor fruit and forage plants that are grown in gardens. Included too are many other species that conservationists stress for their potential value in medicine, as food, or for other purposes. The intraspecific variability of such species may be rather insignificant compared with that of major cultigens and is often poorly documented. There has been less opportunity for diversification over millenia of cultivation.
There are thus three types of wild species of interest for conservation: the progenitors of cultivated plants; species used but not domesticated; and those that might be of use in the future. The distinction between these categories has been
inadequately considered both by conservationists and by international funding organizations in budgeting. It has led to the misuse of the term “genetic resources” as a justification for almost any conservation activity, and may also lead to confusion and to the unscientific planning and operation of programs. A significant exception remains the work on crop plants guided by the International Board for Plant Genetic Resources (Williams, 1984).
THE INTERNATIONAL BOARD FOR PLANT GENETIC RESOURCES PROGRAM
The International Board for Plant Genetic Resources (IBPGR) was established within the Food and Agriculture Organization because of the loss of substantial intraspecific diversity produced by domestication as fewer and fewer successful modern cultivars were grown over large areas of land. This loss was termed genetic erosion.
When IBPGR was created in 1974, the mandate given to it by the Consultative Group on International Agricultural Research (CGIAR) was to establish a global network of activities to further the collection, conservation, documentation, and use of germplasm for crop species. The network, which has been in existence for some time, is complex and includes gene banks (repositories of seeds, tubers, and other sources of genetic materials) at conservation centers and activities dealing with the collection, characterization and documentation of crop genetic resources, and training. Beginning with a handful of countries in 1974, IBPGR’S work now involves 106 countries, and the number of gene banks has grown from half a dozen in 1974 to more than 100, about 40 of which have agreed to accept responsibility for long-term maintenance of genetic resources. The more than 50 crops in the IBPGR program include cereals, legumes, vegetables, oil seeds, fruits, and a limited number of cash crops of importance to rural farmers. More recently, forage plants have been included.
Emphasis was initially placed on the collection and conservation of local cultivars of crops that had evolved in diverse environments under traditional agricultural practices; these are often known as landraces. Farming methods were also changing rapidly due to the availability of modern cultivars and agricultural techniques. The landraces have provided and continue to provide a rich resource for exploitation, but it is neither practicable to collect and conserve all of them nor is it necessary. Attempts have mainly been directed to securing representative samples from those areas with the richest diversity. These genetic resources have always been regarded by the IBPGR as a heritage of mankind to be freely available to all bona fide users.
Much of the diversity of crop plants of use in plant breeding is of cryptic expression. There are clearly limited numbers of morphological characteristics of the plant, and many of them, with the exception of those controlling such yield determinants as the number and size of ears of corn, may be agronomically irrelevant. Physiological characteristics abound, however, controlling life cycle through photoperiodicity, breeding system, and numerous responses to stress factors such as salinity, drought, and especially pests and diseases. Conserved samples are used primarily as a source of genes for broadening the genetic base of modern cultivars
and thereby counteracting the vulnerability of cultivars with too narrow a genetic base to resist new races of pests and diseases.
IBPGR’s emphasis began to shift away from the collection of landraces as its work progressed and as plant breeding techniques advanced, and to include the wider gene pools of the crops such as the wild progenitors and close relatives. The materials conserved embrace an evolutionary spectrum of the past 10,000 years and include obsolete and fairly recent cultivars, but breeders’ lines rarely need conservation; their diversity is already present elsewhere. This point, which is not widely understood, has led pressure groups to urge the conservation of breeders’ lines, which except in a few cases is not justified. In any case, germplasm for major staple crops is available from the International Centres of the CGIAR, the parent body of IBPGR, and from several national agricultural research organizations.
For most of the major crops, germplasm collections provide opportunities for continued introduction of genes with conventional or sophisticated breeding techniques. For many minor crops that have not greatly diversified following domestication, collections may contain cultivars that may be introduced as crops to other countries without further breeding. Hence, the collections of the major crops, e.g., rice, wheat, millet, and groundnut, will be large, whereas those of the minor ones, e.g., okra, many tropical fruits, and forage crops, will be relatively small. As the value of such minor crops becomes appreciated, however, there is likely to be a need for a more diverse germplasm base.
The IBPGR budget is small (a little over U.S. $5 million per year); hence, it does not provide long-term institutional or program maintenance support but, rather, serves as a stimulus or catalyst to work done by national or international organizations. Some of its funds are used to carry out urgent work and to fill gaps in the collection. Linked with the IBPGR program are all crop genetic resources activities in the world, many collections of which were initiated and supported by IBPGR. IBPGR coordinates rather than directs these activities in which all participants are equal partners.
To date, IBPGR has organized more than 500 collecting missions in scores of countries. Germplasm has been acquired in accordance with established priorities (IBPGR, 1981; Williams, 1982) and conserved in long-term storage in 40 centers around the world. All major crops have now been placed in designated gene banks. The IBPGR is currently reviewing the financial support it gives to such gene banks and to centers that are actively involved in ensuring that genetic resources are available for use in crop improvement programs.
CROP ORIGINS AND GERMPLASM USE
Over the past few decades, a great deal of information has been accumulated on the origin and evolution of cultivated species. In general, the wild species tend to have limited patterns of distribution. Although Vavilov (1951) laid the basis for further work in defining centers of origin and centers of diversity based on observed botanical variation, the nuclear centers of the origin of agriculture have
been confused with the areas of evolution and diversity of crop plants (Hawkes, 1983). Harlan (1951) identified smaller microcenters that are rich in diversity and not necessarily near civilization nor confined to plains or mountains—features strongly associated with the Vavilovian centers—usually in the areas that would be regarded as broader centers of diversity.
There are therefore different definitions of the regions that comprise centers—from Vavilov’s to those of Zhukovsky (1975). Whatever the definitions, it is still clear that there are areas where crop plant diversity is great and others where it is slight. The centers of diversity of several crops coincide and comprise limited numbers of regions in contrast to the 13 centers proposed by Vavilov. Crop germplasm is by no means obtained solely from developing countries; centers also cover areas of the developed world. Examples of crops that originated in the developed world include the adzuki bean (Vigna angularis) in Japan, oats (Avena sativa) and rye (Secale cereale) in northern Europe, and the sunflower (Helianthus annuus) in the United States. Many old landraces of the developed world are extremely valuable resources being fed back, through breeding, to Third-World agriculture.
In view of the apparent confusion surrounding the definition of the regions of diversity, it is pertinent to question how the material can best be identified and preserved. Over the past decade IBPGR’s strategy has been to mobilize scientific information from hundreds of the world’s best breeders and crop botanists. Scientists who have grown, used, and evaluated germplasm know far more about its variability than collectors who can only observe phenotypes. This strategy has been highly successful in ensuring the preservation of intraspecific diversity in a very limited time and is still implemented.
For the wider gene pools, where species and species relationships are the principal interest, taxonomy plays a major role in the conservation of genetic resources work, especially experimental taxonomy designed among other things to clarify genomic relationships. But information on the origins and evolution of crop gene pools is obtained not only from taxonomy but also from a synthesis of disciplines, including archaeology, linguistics, ecology, and molecular biology.
For some of the major crops, e.g., wheat and maize, there are still gaps in our knowledge, but in many other cases, the progenitors are well known. Although the ancestor of the faba bean (Vicia faba) has not been equivocally identified, several closely related species have frequently been found, the most recent during an IBPGR mission to Syria in 1986. Truly wild forms of cassava are not definitely known either, although Brazilian workers supported by IBPGR may have found one in 1986.
When a theory of origin has been postulated but not verified by taxonomic work, it may not be clear what germplasm should be collected and where. The cowpea (Vigna unguiculata) is a good example; taxonomically its ancestral home has been variously proposed as Ethiopia or central/southern Africa. IBPGR examined all herbarium specimens of this species in 1986 and found that the progenitor of the cowpea occurs in every country of sub-Saharan Africa. Thus until experimental work on freshly collected material is complete, we will not know the patterns of variation or where to collect samples. Meanwhile, collection of material
will be ad hoc and provide useful allelic diversity but not necessarily from the ancestral area of domestication.
In other cases, such as that of citrus crops (Citrus spp.), existing classifications are substantially untested in the field. IBPGR has put emphasis on relatives of the lime, lemon, and orange and will be organizing fieldwork to this end—not knowing whether the taxonomy works or not. Obviously, the field strategy may have to be modified to fit new knowledge and adapted as necessary. The collection and conservation work will no doubt greatly add to information on the origins, evolution, and distribution of Citrus gene pools. This has already proved true for beans of the genus Phaseolus (G.Debouck, IBPGRI/Centro Internacional de Agricultura Tropical, Colombia, personal communication, 1986), coles (Brassica) (wild gene pool of the Mediterranean), perennial soya bean (Glycine) (IBPGR collaborative work in Australia; A.H.D.Brown, Commonwealth Scientific and Industrial Research Organization, Australia, personal communication, 1986), African eggplants (Solanum spp.) (Lester et al., 1986), and cucurbits (Cucurbitaceae) (L.Merrick, University of California, Davis, personal communication, 1986). Numerous other crops will be worked on in a similar way.
Harlan and de Wet (1971) defined primary, secondary, and tertiary gene pools on the basis of the degree to which closely and distantly related species can be cross-bred. Hitherto a gene-pool approach has been taken in defining IBPGR work. This has obviously been the best strategy, because wild progenitors and their related species have increasingly been shown to be valuable sources of genes for crop improvement. Others, such as wheat, are used for transferring entire chromosomes or parts of chromosomes. Both somatic hybridization and conventional crossing are likely to be more successful among closely related species, but embryo rescue techniques are already commonly used where the parents are less closely related, e.g., in wide crosses between wheat or barley and related wild grasses.
Many advances will continue to come from breeding closely related plant species, but where breeding is far advanced, even species of the tertiary gene pool are useful. IBPGR has recognized this for two groups: first, wild grasses of the tribe Triticeae, which includes wheat, barley, rye, forages, and dozens of species in more than 20 genera distributed throughout the world, and second, the East Asian-Pacific-Australian species of soya bean of the tertiary gene pool. In other cases, the wider gene pool has been used very little; hence, conservation priorities have been imprecisely defined. Wild plants related to maize in the genus Tripasacum are unlikely to be used in maize breeding before the next century.
EVALUATION OF THE RESOURCES
Integral to crop genetic conservation, but a step subsequent to collection, is description and evaluation of germplasm. Although this activity lags behind, it is an ongoing, long-term process. In autumn 1985, IBPGR held a small strategy workshop to look at the collections and study how they could be used more effectively. It has initiated, in particular, research and development to see how best to work on subsets of large collections, thereby accelerating work. Physiological or otherwise cryptic variation must be thoroughly assessed during this process.
By contrast, other conservation programs lack this user-driven input. It seems to me that scientists must develop aesthetic, moral, and evolutionary arguments for wider conservation practices that are not based on whims of individuals but, rather, are geared to perceived needs such as environmental stabilization and rational land-use planning. Only when studies on biological diversity provide data for these arguments can a clear rationale be presented. It is evident that the environmental data bases needed by my community of scientists are only just being developed. Interestingly, when speaking about wild relatives of crops, a well-known crop botanist recently said that identification of environments was more important than proceeding from past taxonomy and searching large areas with often poor chances of success (G.Ladizinsky, Hebrew University of Jerusalem, Israel, personal communication, 1986).
SCIENTIFIC SUPPORT FOR GENETIC RESOURCES WORK
Conservationists outside the field of crop genetic resources frequently base their plea for conservation of wild species on spurious evidence and unrecognized needs resulting from a lack of adequately trained scientific manpower. The work in crop genetic resources has been successful because of its user orientation, and in fact has been solely directed to this end. There is a clear lesson here for the wider conservation movement and also a reminder of the need to identify gaps in scientific knowledge.
The success of IBPGR would not have been possible without the work of botanists, geneticists, and scientists in related disciplines. Nonetheless, there has been insufficient scientific research pertinent to the conservation of crop genetic resources. This has been partly due to lack of funding and partly to the fact that strategic research is often not as attractive to the academic community as basic research. Accordingly, IBPGR has had to shift its program to accommodate strategic problem-solving research, much of it of an interdisciplinary nature.
Areas of research where such problems exist are:
-
the elucidation of patterns of genetic variation using such disciplines as taxonomy, ecology, cytogenetics, molecular biology, and population genetics; and
-
the understanding of genetic stability in conservation systems, again as interdisciplinary work involving genetics, tissue culture, molecular biology, and seed physiology.
IBPGR has initiated relevant research that not only will provide practical solutions to specific problems but also will add to scientific knowledge. Traditional disciplines such as taxonomy and cytogenetics have to keep up with exciting new developments in, for instance, molecular biology. One recent development is the proposal that DNA is in a state of flux. Exchange of genetic material between organelles and nuclei may be possible, while bacterial infection and tissue culture, for instance, may induce new genomic changes in response to changed environments (Hohn and Dennis, 1985).
On the whole, conservation biologists have not fully considered the technologies necessary for scientific and practicable solutions and need a synthesis of data from numerous disciplines. One recent initiative, that is supported in part by the government of the United Kingdom and draws on a wide range of expertise, is the International Legume Database Information Service (ILDIS). IBPGR has been associated with this service from its inception and views positively the mobilization of scientists within several institutions. Yet the provision of checklists of taxa continent by continent draws heavily on traditional taxonomy. This venture and the Missouri TROPICOS system and the BIOSIS (BioSciences Information Service) Taxonomic Reference File are to be applauded.
EX SITU AND IN SITU PRESERVATION
Because of their nature, most crop genetic resources are conserved ex situ. Many crop relatives are annuals or weeds associated with disturbed agricultural environments, and most do not lend themselves to in situ conservation. Landraces cannot be conserved by growing them in primitive agricultural conditions; it is neither practical nor can it be justified morally. There are exceptions to what can be conserved in situ, especially perennial species associated with complex ecosystems such as tropical rain forests, e.g., cocoa, oil palm, relatives of Citrus, and some root crops. To encourage in situ conservation where it is relevant and to rationalize further collecting work, IBPGR has recently been developing its expertise in the ecogeographic sampling and monitoring of genetic resources. But the opportunities for in situ conservation are limited and should not be overemphasized.
In addition, preservation of species diversity by ecosystem maintenance is not always relevant to the conservation of crop genetic resources. Allelic diversity is rarely considered by ecosystem conservationists, yet it is needed for utilization by crop botanists (Frankel and Soulé, 1981; Ingram and Williams, 1984).
The interface between ecosystem conservation and the special needs to conserve crop genetic resources has been discussed by Ingram and Williams (1984). Many of the scientific points have not yet been addressed by the wider conservation movement and merit further attention if scientific objectivity is to prevail over emotive generalization.
REFERENCES
Frankel, O.H., and M.E.Soulé. 1981. Conservation and Evolution. Cambridge University Press, Cambridge. 327 pp.
Harlan, J.R. 1951. Anatomy of gene centers. Am. Nat. 85:97–103.
Harlan, J.R., and J.M.J.de Wet. 1971. Towards a rational classification of cultivated plants. Taxon 20:509–517.
Hawkes, J.G. 1983. The Diversity of Crop Plants. Harvard University Press, Cambridge, Mass. 184 pp.
Hohn, B., and E.S.Dennis, eds. 1985. Genetic Flux in Plants. Springer-Verlag, New York. 253 pp.
IBPGR (International Board for Plant Genetic Resources). 1981. Revised Priorities Among Crops and Regions. IBPGR Secretariat, Rome. 18 pp.
Ingram, G.B., and J.T.Williams. 1984. In situ conservation of wild relatives of crops. Pp. 163–179 in J.H.W.Holden and J.T.Williams, eds. Crop Genetic Resources: Conservation and Evaluation. Allen and Unwin, London.
Lester, R.N., J.J.G.Hakiza, N.Stavropoulos, and M.M.Teixiera. 1986. Variation patterns in the African scarlet eggplant. Pp. 283–308 in B.T.Sytles, ed. Infraspecific Classification of Wild and Cultivated Plants. Clarendon Press, Oxford.
Vavilov, N.I. 1951. The origin, variation, immunity and breeding of cultivated plants. Chronica Bot. Volume 13. 364 pp.
Williams, J.T. 1982. International programs with special reference to genetic conservation and the role of the United States. Pp. 52–55 in Proceedings of the U.S. Strategy Conference on Biological Diversity 1981. Publication No. 9262. U.S. Department of State, Washington, D.C.
Williams, J.T. 1984. A decade of crop genetic resources research. Pp. 1–17 in J.H.W.Holden and J.T.Williams, eds. Crop Genetic Resources: Conservation and Evaluation. Allen and Unwin, London.
Zhukovsky, P.M. 1975. Mega-genecenters and Endemic Micro-genecenters: World Gene Pool of Plants for Breeding. USSR Academy of Sciences, Leningrad. 116 pp.
CHAPTER 29
CONSERVING AND MONITORING BIOTIC DIVERSITY
Some African Examples
BRIAN J.HUNTLEY
Director, National Programme for Ecosystem Research, Council for Scientific and Industrial Research, Pretoria, South Africa
Africa has excited the imagination of explorers, naturalists, and conservationists more profoundly than any other continent. The writings of Rooseveld, Blixen, and Haggard brought the romance of the African veld into the homes of millions who had never, nor would ever, toil under the African sun. But the romance of the colonial era has now been replaced by the realism of thirst, starvation, and desertification. The wide open spaces are gone, and pressures on productive lands are greater than they can sustain. There is neither money nor trained manpower to implement comprehensive conservation programs in Africa today though the task of the conservationist in Africa is currently much greater and more urgent than it has ever been.
Credibility and realism are needed. But these qualities have not always characterized conservationists in Africa. The impressive heritage of national parks and reserves is a legacy from the colonial era, built on the favorite stamping grounds of repentant white hunters. Fortunately, a new era may be dawning as the result of the World Conservation Strategy (IUCN, 1980)—a program that can be explained in terms that are meaningful to the African husbandman. The concepts of biotic diversity and the sustainability of production and life-support systems carry with them the promise of tangible values and benefits to the community at large, not just to the affluent foreign tourist visiting parks that are national in name alone.
The question addressed in this chapter is quite simple. Given the diversity of African wild plants, animals, and ecosystems and the severe constraints on money, manpower, and time, how should one identify priorities for biotic conservation
and monitor progress toward achieving objectives? This question is examined by drawing on experience in several southern African countries against a background of the diversity and dynamics of African ecosystems.
BIOGEOGRAPHIC SETTING
Africa broke away from South America and the rest of the ancient supercontinent of Gondwanaland some 140 million years ago. Dinosaurs and gymnosperms occupied the landscape but were soon replaced by mammals and the flowering plants that we know today. Equatorial rain forests dominated the vegetation for a long period and were only replaced by the savanna systems characteristic of most of Africa today at the onset of the Pleistocene ice age, some 2 million years ago. Throughout the Pleistocene epoch the expansion and shrinking of the polar ice caps were reflected by major changes in the global climate. Cooler, drier periods of approximately 100,000 years alternated with shorter, warmer, and moister spells, and variants of these. This exerted major environmental pressures on the continent’s flora and fauna. What we see of African ecosystems today is merely a narrow slice of the diversity that has existed on the continent throughout time. Through much of these massive oscillations of Pleistocene climate and vegetation, humans have exerted a profound influence on the shaping of African environments both as hunter and fire maker. A consequence of these varied influences is the tremendously dynamic character of African ecosystems, in which both speciation and extinction are ongoing processes.
PATTERNS OF SPECIES RICHNESS AND ENDEMISM
Students of plant and animal distributions have divided the world into eight major regions, or biogeographic realms, one of which is Africa south of the Sahara. Known as the Afrotropical realm (Udvardy, 1984), it includes not only sub-Saharan Africa but also the island continent of Madagascar, the islands of the western Indian Ocean, and the southern tip of Arabia. It possesses the richest mammal fauna of any realm and a rich and distinctive fish fauna but relatively impoverished bird, reptile, and amphibian faunas. The flora of tropical Africa is not nearly as rich as that of South America or Southeast Asia, but that of southern Africa is extraordinarily rich.
Of the 20 biogeographic units defined for the African continent, 17 fall within the Afrotropical realm and 7 of these are recognized as centers of endemism, the cradles of floristic evolution and speciation (White, 1983). The species richness and percentage of species restricted to each center of endemism are summarized in Table 29–1. Plants, birds, and fishes provide excellent examples of the differing patterns of biological diversity in Africa and can be used to illustrate the vulnerability of localized centers of species richness to human-induced impacts. The examples chosen also demonstrate that much of Africa’s biotic wealth lies outside the tropical savannas, which have enjoyed so much attention from wildlife conservation organizations.
TABLE 29–1 The Seven Centers of Endemism of the Afrotropical Realm, With Estimates of the Numbers of Seed Plant, Mammal (Ungulates and Diurnal Primates), and Passerine Bird Species in Each and the Percentage of These Endemic to the Unita
TABLE 29–2 The Number of Seed Plant Species in Various Regions of the Worlda
The flora of the Afrotropical realm probably includes some 40,000 species, the richest component of which is found in southern Africa, especially in the Cape Floristic Kingdom, one of the six major floristic divisions of the world’s flora defined by Good (1974). The magnitude of the floristic richness of southern Africa is indicated in Table 29–2, which provides data for a wide range of regions. The 8,500 species of the Cape flora are compressed into an extremely small area. The change of species composition from one patch of vegetation to the next is very high—two sides of the same valley may differ by 45%, adjacent large areas may share less than 40% out of more than 2,500 species. Such rapid changes in floristic composition are unknown elsewhere, not even in the Indo-Malayan rain forest (Kruger and Taylor, 1979). The Cape Peninsula, only 470 square kilometers in area, possesses 2,256 indigenous species—more than half the flora of eastern North America. The unique floristic richness of the Cape is unfortunately matched by unusually serious threats to its survival. A detailed 10-year survey of the conservation status of southern Africa’s 23,000 species of plants indicates that some 2,373 are threatened. The Cape Floristic Kingdom, occupying less than 4% of southern Africa, accounts for 68% of the threatened species (Hall et al., 1984). Satellite imagery indicates that 34% of the region’s natural vegetation has been transformed by agriculture and other human activities. The second most serious threat to the small heathland shrubs characteristic of this region is the aggressive competition exerted by large, introduced woody weeds. In addition, an invasive ant has been found to suppress populations of the native seed-storing ants, thus exposing critical seed sets to predation by rodents or destruction by the intense fires that characterize these Mediterranean-climate shrublands.
The distribution of Afrotropical birds is rather different from that of the patterns of floristic richness. A recent analysis of the distribution of 1,595 species of Afrotropical birds indicated fairly clear correlation between bird diversity and rainfall, vegetation, and other factors in the present environment. But many species of forest birds displayed distribution patterns that could best be interpreted in terms of past climatic and habitat conditions (Crowe and Crowe, 1982). These somewhat anomalous distributions indicate the occurrence of what are known as Pleistocene
refugia—sites that would have escaped the dramatic environmental changes that took place during repeated ice ages. They are not only sites of species richness and endemism but are also the habitat islands of rare and threatened species. Of the 168 species listed in Threatened Birds of Africa and Related Islands, the ICBP/IUCN Red Data Book, 87 are forest species (Collar and Stuart, 1985).
Many of these birds occur as isolated populations in widely separated montane forests. The most critically threatened group of these rare birds survive in the small patches of forest on Mount Moco in central Angola, more than 2,500 kilometers distant from similar but much larger forests in Cameroon, eastern Zaire, Tanzania, and the South African escarpment (Huntley, 1974). Pressure for timber and fuelwood on this 100-hectare remnant is severe—the rural peoples living on the cold mountain slopes have no alternative resources.
The Great Lakes of Africa are the only massive freshwater bodies in the tropics. They are comparable in size to the North American Great Lakes but are much older. The African lakes harbor the world’s richest palustrine fish faunas, one family of which (Cichlidae) provides the supreme example of vertebrate evolution within geographically isolated communities—upwards of 900 species—far more spectacular than that described and immortalized by Darwin in the 13 species of Galapagos finches.
Table 29–3 indicates the levels of species richness and endemism in the three largest African lakes. There are probably more than 1,100 species of indigenous fishes in these lakes, compared with less than 160 species in the much larger North American lakes. Not only are these fishes of immense ecological, evolutionary, and conservation interest, they also support a major traditional fishery. This fishing culture, and its socioeconomic fabric, is now being threatened by the introduction of sophisticated and capital-intensive fisheries based on Nile perch, an introduced species (Coulter et al., 1986). This piscivorous species was introduced into the northern part of Lake Victoria in 1960 in a well-intentioned but shortsighted effort to improve the commercial fishing industry. It has rapidly expanded its range in the lake at the expense of the endemic species. Massive changes in the abundance and distribution of these endemics are occurring, and it is estimated that up to 30 species have already become extinct. This is probably the highest rate of human-induced extinction of vertebrates yet recorded. The tragedy of the situation is that a vast number of the species currently threatened with extinction have not yet been collected, classified, and named.
TABLE 29–3 The Great Lakes of Africa: Area, Fish Species Richness, and Endemisma
APPROACHES TO THE CONSERVATION OF BIOTIC DIVERSITY IN AFRICA
The spectacular diversity of landscapes and biota in Africa is not matched by the human and financial resources needed to protect and manage this heritage. It is therefore essential that available skills and funds be directed to sites of the highest conservation priority. An objective system of assessing priorities in relation to clear and unambiguous goals is needed. Within the context of the goals of the World Conservation Strategy, the specific objective of in situ biodiversity conservation in Africa might take the following form:
To establish a minimum set of protected areas that provides for the preservation of the full range of African ecosystems and their biota, including marine and coastal species and systems.
Some of the steps to be taken to reach this objective include:
-
the development of a hierarchical series of biotic classification systems (from continental to regional to local scales);
-
the assessment of the current level of protection given to each element of these classifications;
-
the identification of gaps in the protected area network within a ranked listing of priorities; and
-
the mobilization of the funds and manpower needed to incorporate these areas within the network.
These needs will now be examined in the light of African examples.
BIOTIC CLASSIFICATION SYSTEMS
The first need in any review of biotic resources is information on the types, numbers, and distribution of the plants and animals to be found in the area under study. Such information is best synthesized within major vegetation and plant-geographic units. UNESCO has recently published a comprehensive review of the vegetation of Africa (White, 1983) and a detailed map at a scale of 1:5 million, which is of tremendous value in assessing the protected area cover of biota at a continental scale. Numerous regional and national vegetation classifications and maps that are also available in other publications permit analyses at finer resolution. But the complexity of biotic communities and the distribution of plants and animals require that much additional information be made available. The small, but species-rich communities of lakes, wetlands, rivers, estuaries, coastal dunes and mangroves, inselbergs, and escarpments, and many other specialized habitats are seldom included at the scale of even national vegetation maps. Conservation plans that ignore these communities will miss much of a region’s biotic richness (Clarke and Bell, 1986).
A more complex problem relates to endemism. Centers of endemism are seldom reflected in distinctive and mappable vegetation types, yet they are of considerable conservation interest. Of greater concern is the fact that centers of endemism can
only be revealed through exhaustive floristic analysis, a task that has been accomplished for very few species groups in Africa. Even in South Africa, which has benefited from more than 200 years of biological survey, new centers of endemism of considerable importance are only now being detected.
ASSESSING THE ADEQUACY OF CURRENT PROTECTED AREA COVER
During the past 30 years, the International Union for the Conservation of Nature and Natural Resources has developed a comprehensive data bank on the protected area systems of the world. It has recently completed a detailed listing of all protected areas of the Afrotropical realm, providing exhaustive information on the geographic, faunal, floral, and management attributes of each of some 620 protected areas greater than 50 square kilometers in the realm (IUCN/UNEP, 1987). This data base served as the foundation for the review of Afrotropical protected areas undertaken by MacKinnon and MacKinnon (in press), whose analysis indicates that 4.7% of the realm falls within protected areas totalling 949,500 square kilometers, considerably larger than the State of Texas. By comparing the total area of each mapped vegetation unit with that falling within protected areas, they found that only one of the seven major centers of endemism of the Afrotropical realm has more than 10% of its area protected. The other six centers have between 3.6 and 7.0% of their area within national parks and reserves. Even at the extremely coarse scale of resolution afforded by this analysis, the finding that as little as 3.6% of the biotic resource is protected gives cause for concern. On closer inspection, the situation is even worse—many of the so-called national parks in Africa are little more than yellowing documents in government archives. The Giant Sable Integral Nature Reserve in central Angola is occupied by more than 20,000 peasant farmers, several trading villages, and until guerilla activity prevented it, extensive diamond prospecting. The Reserve has not seen a game ranger in 10 years.
Factors such as the above necessitate a more objective evaluation of the effective protection afforded each biogeographic unit and protected area. In recent years, a variety of scoring systems have been proposed. These systems take account not only of the relative area protected but also of the effectiveness of government action to provide long-term security to the area (Clarke and Bell, 1986; Cumming, 1984). MacKinnon and MacKinnon (in press) developed a scoring system based on the size, protection objectives, and management effectiveness reported for each site. These data were then summarized by biogeographic unit and weighted for the number of distinct habitats and altitudinal ranges represented within the conservation network. Assessment of priority for action was based on the principle that action should be taken where it could have the best effect, not on lost causes—an all too common failing of conservation efforts based on sentiment rather than science.
At a finer scale of resolution, an analysis of the protected area cover of 189 vegetation units in 10 southern African states demonstrated the existence of major deficiencies in many of the 24 major vegetation divisions recognized (Huntley and Ellis, 1984). The most seriously threatened systems included the lowland forests
of Angola and Mozambique and the Highveld grasslands, lowland fynbos, and succulent karoo of South Africa. All these systems face rapid reduction due to agricultural development or exploitation of timber resources for foreign exchange or fuel wood.
To assess the adequacy of the protected area cover of 15 communities in the exceptionally rich communities of the lowland fynbos (Cape heathlands), Jarman (1986) made use of 1.25 million maps prepared from satellite imagery. More than 69% of this species-rich vegetation formation had already vanished under urban, industrial, and agricultural development, and 21% of the 8,955 square kilometers still in a seminatural state had been invaded by alien woody plants.
A working group of over 40 researchers, administrators, and land owners participated in a 3-year study of the remnant patches of lowland fynbos. The survey identified 153 sites of conservation value and ranked them according to a formula that incorporated quantified attributes such as the rarity of the vegetation type, habitat diversity, total species richness, and the number of threatened plants found on the site. The rating was weighted in terms of the size and shape of the site and its distance from other protected areas and the degree to which the site had been transformed by introduced woody plants or other forms of disturbance. The conservation merit ratings ranged from 13 to 80 out of a possible 100. Only 5 out of 32 sites with a rating above 50 were currently protected, whereas the majority of the other existing reserves had ratings below 30 and were considered either too small, too greatly disturbed, or too low in biotic richness to merit inclusion in a costly protected area network. The study was probably the most detailed of its kind ever undertaken in Africa; indeed, the variety and quality of data available for the analyses are unlikely to become available elsewhere on the continent for many years. The significance of the results lies in the finding that even in an area of considerable financial and manpower resources, past decisions on the selection of sites for protection have been wholly inadequate to meet biological conservation needs.
IDENTIFYING GAPS IN THE NETWORK
The results of surveys of protected area cover based on vegetation maps can only provide the first step in the process of identifying gaps in the network. Much of the diversity of African ecosystems lies in communities that are too restricted or too narrow or patchy in their distribution to be included in the analytical approaches described in the last section of this chapter. Rivers, wetlands, and coastal ecosystems fall in this category. As a consequence of this, they have been largely ignored by African conservation agencies. During the last 10 years, long overdue attention has been devoted to these ecosystems in southern Africa. Some of the experience gained can be described here.
Wetlands in the form of seasonally waterlogged grasslands (dambos) are a characteristic feature of the vast moist savannas of the central African plateau. Drainage of these dambos provides the only rich agricultural soils over vast areas, and much of these systems have been transformed into agricultural lands, dramatically reducing the habitat available to the vulnerable Wattled crane (Grus carunculata)
populations, which are dependent on these frequently burnt short grasslands. In South Africa, concern for the future of the Wattled crane has brought new emphasis to the conservation of the wetlands that support the remaining 100 pairs breeding in the country. Furthermore, 48% of the birds listed in the latest South African Red Data Book—Birds are grassland and wetland species (Brooke, 1984). Even more urgent, however, is the need to rehabilitate wetlands in the catchments of the country’s major rivers, which now carry up to 375 tons per square kilometer per year of soil lost from overgrazed rangelands and cultivated slopes.
Despite the importance of wetlands, conservation efforts have ignored them because of difficulties in defining, identifying, and mapping them. These problems have now been overcome by the use of hydromorphic soils as the key indicator of wetlands (Begg, 1986). Maps of such soils are readily available in most African countries, and their identification on aerial photographs for detailed checking in the field is relatively easy. Because the soils retain their structural characteristics longer than their vegetation cover, it is also possible to obtain a rapid estimate of the rate of change in wetland systems. In the Tugela Basin of Natal, up to 34% of wetland communities have been destroyed in the past 50 years due to cultivation or overgrazing followed by extensive soil erosion.
The most seriously neglected biotic systems in Africa are the tens of thousands of kilometers of streams and rivers that drain the continent. Even those rivers protected within national parks and reserves are subject to severe impacts from developments upstream or downstream of the protected section. Their narrow linear structure and diffuse spread make them difficult to contain within all but the largest protected areas, and detailed information on their biological values, degree of disturbance, and conservation needs are difficult to synthesize. They are, like wetlands, invariably ignored by conservation planners.
During the last 3 years, considerable progress has been made in overcoming the difficulties of analyzing river conservation needs in South Africa. A computer-based expert systems technique developed by O’Keeffe et al. (1986) simulates the logic processes of river ecologists and converts the multivariate probabilities and diffuse intuitions of real-life situations into a simplified expression of river conservation status. The advantage of the system is that the complex calculations of interrelationships are handled by the computer, but the flexibility to take account of unusual situations is retained. A wide range of attributes are included in the system framework, and the users enter the best-available information on each of these, ideally within a workshop situation where the researchers, conservationists, and planners can pool their resources.
Because each river is different and, therefore, all attributes do not always apply in the same way, a number of rules are included in the program to interrelate attributes or modify their effect. The system is designed to assess whole river systems, individual rivers, parts of rivers, or points in a river. The extent of the assessment must be defined by the user beforehand. Obviously, the assessment of a whole river system will be performed at a coarser resolution than that for a small tributary. The flexibility of the system, allowing successive levels of data to be added as knowledge improves, makes it especially useful in Africa, where few river systems
are adequately documented. The system has been developed for use on personal computers and is thus within the reach of most government agencies in Africa.
MONITORING THE SYSTEM
The dynamic nature of African ecosystems was mentioned at the beginning of this chapter. Continent-wide changes in the distribution of forests, savannas, grasslands, and deserts have occurred during the last 18,000 years due to major climatic events. San bushmen monopolizing isolated desert waterholes, iron-age communities deforesting coastal woodlands, and honey-gatherers burning moist savannas have induced subtle but significant fluxes in the distribution and abundance of plants and animals over the past 1,000 years. More recently, the changes brought about by both colonial and independent governments have been more extensive and less benign. Superimposed on these latter changes have been oscillating dry and wet rainfall patterns with intervals of 10 to 20 years.
Any attempt to monitor the status of species and ecosystems must be cognizant of such fluxes. Conservation biologists in Africa seldom occupy research posts for more than 10 years, and few remain at a given station for more than 5 years. Their observations are therefore of limited generality and frequently result in misleading rather than accurate predictions of a system’s behavior. Nature is often counter-intuitive, and the obvious management response to a problem is not always appropriate—it may even produce an effect directly opposite to that intended (Caughley and Walker, 1983). Research is needed to develop a predictive understanding of ecosystem structure and functioning in response to environmental changes and must be linked to monitoring systems that measure the direction and rates of these changes and responses.
There is extensive literature on the philosophy and technology of environmental monitoring. In Africa, much of this is irrelevant. What monitoring is being done varies tremendously in spatial and temporal scales and in duration and precision. Even where detailed long-term studies have been undertaken, few of the results are amenable to statistical analysis and valid interpretation due to faults in their experimental design (O’Connor, 1985). There are simply no reliable sets of data on some of the most critical issues in biotic diversity, such as the reduction of moist forests and the floristic impoverishment of arid lands. The need for a carefully planned international program of biotic diversity analysis and monitoring in Africa is an urgent priority. Without a reliable data base, cost-effective conservation measures cannot be planned. A few examples of successful monitoring activities suggest possible lines of approach.
At continental and regional scales, Red Data Books (RDBs) of plants, animals, and habitats are beginning to provide a valuable first approximation to the monitoring of biotic diversity (Anonymous, 1985). The accuracy and detail of information on many species in these lists are inadequate, but the mere publication of these data leads to critical review and improvement. The 1976 RDB on South African birds was cited in more than 150 papers within 8 years of its publication, and the latest edition (Brooke, 1984) includes the reclassification of 37 of the
original listing of 101 species and adds 30 more. Similar rapid improvements of the data base on mammals, fishes, and plants have been witnessed in the new editions of these volumes. Although most of these changes in status reflect the inadequacies of the original data rather than real changes in the field situation, the existence of the RDBs triggered an upsurge of interest in monitoring rare species. This activity has been followed by the launch of annual counts of storks and cranes at a southern African scale; monitoring of all RDB bird species is now undertaken within a national bird atlassing project (Hockey and Ferrar, 1985).
Perhaps the most ambitious and detailed monitoring project yet undertaken in Africa is that initiated in the Kruger National Park in South Africa in 1975. Following on 50 years of data collection on large mammal numbers and distribution, rainfall patterns, and fire occurrence, the current program includes a network of climate, vegetation transect, and fixed-point photographic stations plus detailed helicopter and fixed-wing aerial counts of 12 species of large mammals, estimates of forage and water availability, season and extent of controlled burns and wildfires, and other information, with a sampling scale of 4-square-kilometer units within the Park’s 19,853 square kilometers. The aerial and ground survey data are integrated within a series of computer programs, which provide a robust data base for the analysis and interpretation of large-scale patterns of change in savanna ecosystems (Joubert, 1983).
Even more detailed monitoring of the dynamics of large mammal populations has been undertaken at Sengwa Wildlife Research Area in Zimbabwe, where the movements and social behavior of the elephant population have been tracked by radio telemetry for over a decade. The elephant study is supplemented by 20 years of detailed transect surveys of the habitat use of 15 other species of mammal. The Kruger Park and Sengwa projects, along with similar studies elsewhere in Africa, provide the practical experience and theoretical framework for much less sophisticated monitoring systems for implementation in countries with more limited resources. Ironically, the lessons learned in such extended and expensive exercises are seldom noted by expatriate conservation biologists sent to Africa.
LESSONS LEARNED
The review in this chapter is far too brief to provide more than a superficial treatment of the problems and progress in conserving biodiversity in Africa. A few key points arise from experience in this field over the past 20 years.
-
African ecosystems are not as fragile and vulnerable as is popularly believed. Throughout their evolution, they have been subjected to enormous environmental pressures—including the hunter and the fire maker through the last few hundred thousand years. But current accelerated rates of change leave little room for complacency regarding the identification of real rather than perceived conservation priorities.
-
Biotic diversity is not linked to the distribution of elephants, rhinos, and other so-called charismatic megaherbivores. The massive investment in conservation campaigns directed at these species does more for the souls of the donors and the
-
egos of the elephant experts than it does for biotic diversity, which is centered on less exciting communities of montane forests, Mediterranean heathlands, wetlands, lakes, and rivers.
-
The analysis of the level of protection afforded mapped vegetation types is a valuable first approximation to evaluating the effectiveness of existing protected area systems. But attention must also be directed to centers of species richness and endemism and to sites of threatened species, which are seldom reflected in vegetation maps. RDBs of threatened plants, animals, and habitats are of considerable value in stimulating interest at a national level in issues of biodiversity conservation.
-
The existence of highly sophisticated environmental monitoring systems in several African states offers experience and expertise to other countries that require simple but effective approaches to monitoring biodiversity.
-
Expert systems based on the synthesis of available ecological principles and local knowledge offer tremendous potential in the development of objective decision rules for identifying conservation priorities in areas and on topics with limited expertise or data. With very few exceptions, knowledge of biotic conservation needs and priorities far exceeds the ability of African governments to implement conservation action plans.
REFERENCES
Anonymous. 1985. The plant sites Red Data Book. Pp. 3–24 in Plant Conservation in Africa. A Joint Session with the International Union for the Conservation of Nature. Association for the Taxonomic Study of the Flora of Tropical Africa.
Begg, G. 1986. The Wetlands of Natal. Natal Town and Regional Planning Report. No. 68. Pietermaritzburg, South Africa. 114 pp.
Brooke, R.K. 1984. South African Red Data Book—Birds. South African National Scientific Programmes Report. No. 97. Foundation for Research Development, Council for Scientific and Industrial Research, Pretoria, South Africa. 213 pp.
Caughley, G., and B.Walker. 1983. Working with ecological ideas. Pp. 13–33 in A.A.Ferrar, ed. Guidelines for the Management of Large Mammals in African Conservation Areas. South African National Scientific Programmes Report. No. 69. Foundation for Research Development, Council for Scientific and Industrial Research, Pretoria, South Africa.
Clarke, J.E., and R.H.V.Bell. 1986. Representation of biotic communities in protected areas: A Malawian case study. Biol. Conserv. 35:293–311.
Collar, N.J., and S.N.Stuart. 1985. Threatened Birds of Africa and Related Islands, the ICBP/ IUCN Red Data Book. International Union for Conservation of Nature and Natural Resources, Gland, Switzerland. 761 pp.
Coulter, G.W., B.R.Allanson, M.N.Bruton, P.H.Greenwood, R.C.Hart, P.B.N.Jackson, and A.J.Ribbink. 1986. Unique qualities and special problems of the African Great Lakes. Environ. Biol. Fish. 17(3):161–183.
Crowe, T.M., and A.A.Crowe. 1982. Patterns of distribution, diversity and endemism in Afrotropical birds. J. Zool. 198:417–442.
Cumming, D.H.M. 1984. Toward establishing priorities for funding and other international support for protected areas in Africa. Pp. 108–111 in Proceedings of the Twenty-Second Working Session of the Commission on National Parks and Protected Areas, Victoria Falls, Zimbabwe, 22–27 May, 1983. International Union for the Conservation of Nature and Natural Resources, Gland, Switzerland.
Gibbs Russell, G.E. 1985. Analysis of the size and composition of the southern African flora. Bothalia 15:613–629.
Good, R. 1974. The Geography of the Flowering Plants. 4th Edition. Longmans, London. 557 pp.
Hall, A.V., B.de Winter, S.P.Fourie, and T.H.Arnold. 1984. Threatened plants in southern Africa. Biol. Conserv. 28:5–20.
Hockey, P.A.R., and A.A.Ferrar. 1985. Guidelines for the Bird Atlas of Southern Africa.
Ecosystem Programmes Occasional Report. No. 2. Council for Scientific and Industrial Research, Pretoria, South Africa. 55 pp.
Huntley, B.J. 1974. Outlines of wildlife conservation in Angola. J. S. Afr. Wildl. Manage. Assoc. 4:157–166.
Huntley, B.J., and S.Ellis. 1984. Conservation status of terrestrial ecosystems in southern Africa. Pp. 13–22 in Proceedings of the Twenty-Second Working Session of the Commission on National Parks and Protected Areas, Victoria Falls, Zimbabwe, 22–27 May, 1983. International Union for the Conservation of Nature and Natural Resources, Gland, Switzerland.
IUCN (International Union for Conservation of Nature and Natural Resources). 1980. World Conservation Strategy. Living Resource Conservation for Sustainable Development, International Union for Conservation of Nature and Natural Resources, Gland, Switzerland. Four-brochure set.
IUCN/UNEP (International Union for Conservation of Nature and Natural Resources/United Nations Environment Programme). 1987. The IUCN Directory of Afrotropical Protected Areas. International Union for Conservation of Nature and Natural Resources, Gland, Switzerland. 1,034 pp.
Jarman, M.L. 1986. Conservation Priorities in Lowland Regions of the Fynbos Biome. South African National Scientific Programmes Report. No. 87. Foundation for Research Development, Council for Scientific and Industrial Research, Pretoria, South Africa. 53 pp.
Joubert, S.C.J. 1983. A monitoring programme for an extensive national park. Pp. 201–212 in R. N.Owen-Smith, ed. Management of Large Mammals in African Conservation Areas. HAUM Educational Publishers, Pretoria, South Africa.
Kruger, F.J., and H.C.Taylor. 1979. Plant species diversity in Cape Fynbos: Gamma and delta diversity. Vegetatio 41:85–93.
MacKinnon, J., and K.MacKinnon. In press. Protected Areas Systems Review of the Afrotropical Realm. International Union for the Conservation of Nature and Natural Resources, Gland, Switzerland.
O’Connor, T.G. 1985. Synthesis of Field Experiments Concerning the Grasslayer in the Savanna Regions of Southern Africa. South African National Scientific Programmes Report. No. 114. Foundation for Research Development, Council for Scientific and Industrial Research, Pretoria, South Africa. 126 pp.
O’Keeffe, J.H., D.B.Danilewitz, and J.A.Bradshaw. 1986. The River Conservation System, a User’s Manual. Ecosystem Programmes Occasional Report. No. 9. Council for Scientific and Industrial Research, Pretoria, South Africa. 17 pp.
Udvardy, M.D.F. 1984. A biogeographical classification system for terrestrial environments. Pp. 34–38 in J.A.McNeely and K.R.Miller, eds. National Parks, Conservation, and Development: The Role of Protected Areas in Sustaining Society. Proceedings of the World Congress on National Parks, Bali, Indonesia, 11–12 October 1982. Smithsonian Institution Press, Washington, D.C.
White, F. 1983. The Vegetation of Africa: A Descriptive Memoir to Accompany the UNESCO/ AERFAT/UNSO Vegetation Map of Africa. United Nations Educational Scientific Cultural Organization, Paris. 356 pp.


