
7
DOSE-RESPONSE ASSESSMENT
THIS chapter focuses on dose-response analysis and its role in choosing a point of departure to be used in the risk assessment for MeHg. The chapter begins with a brief review of risk assessment for noncancer end points. Problems with the traditional approach that is based on no-observed-effect levels (NOAELs) will be discussed, along with advantages of more recent approaches that are based on dose-response modeling and benchmark-dose calculations. The chapter then reviews some of the specific challenges that arise when considering benchmark-dose calculations for MeHg. Foremost among these challenges is the fact that three studies of similar quality yield different results regarding the association between low-level exposures to MeHg and adverse developmental outcomes. After exploring the possibility that differences in power might explain some of this discrepancy, the committee presents and discusses several approaches that could be used to provide a benchmark dose based on data from the three studies. Among the methods considered are traditional approaches based on selecting a single outcome from a single study and an integrative analysis that combines information from different studies and outcomes. Results are found to be sensitive to model choice and recommendations are made for model choice.
RISK ASSESSMENT FOR NONCANCER END POINTS
Quantitative risk assessment for noncancer effects is commonly based
on determination of a NOAEL from a controlled study in animals. In this context, the NOAEL is defined as the highest experimental dose that does not produce a statistically or biologically significant increase in adverse effects over those of controls. An “acceptably safe” daily dose for humans is then derived by dividing the NOAEL by a safety factor, usually 10 to 1,000, to account for sensitive subgroups of the population, data insufficiency, and extrapolation from animals to humans. The U.S. Environmental Protection Agency (EPA) refers to the resulting quantity as the reference dose (RfD), the Food and Drug Administration (FDA) uses the term allowable daily intake (ADI) and the Agency for Toxic Substances and Disease Registry (ATSDR) uses minimum risk level (MRL). The concept is also similar to the upper limits (ULs) recently introduced by the National Academy of Sciences for nutrient recommendations. In the event that the lowest experimental dose shows a significant difference from the control, it is termed a LOAEL (lowest-observed-adverse-effect level), and an extra factor of 10 is used in the determination of the RfD, ADI, or MRL (see, for example, EPA 1998). Various reports have provided RfDs for MeHg that are derived from animal studies (Rice 1992; Gilbert et al. 1993; Zelikoff et al. 1995; Rice 1996). Typically, these calculations have used the results from a series of nonhuman primate studies, which indicate that adverse developmental effects in several outcomes occur at 50 µg/kg per day maternal dose. Uncertainty factors of 10 were used for LOAEL to NOAEL, species differences, and individual variation in response for an RfD of 0.05 µg/kg per day.
In recent years, use of the NOAEL has become controversial among risk assessors and regulators because of several serious statistical drawbacks (Gaylor 1983; Crump 1984; Kimmel and Gaylor 1988; Kimmel 1990; Leisenring and Ryan 1992). For instance, because the NOAEL must, by definition, correspond to one of the experimental doses, it can vary considerably across different experiments, yet this statistical variation is usually ignored when computing RfD values. Furthermore, estimation of the NOAEL is sensitive to sample size: because the NOAEL is based on statistical comparisons between exposed and unexposed dose groups, larger studies have higher power to detect small changes and therefore tend to produce lower NOAELs. In contrast, smaller studies tend to yield higher NOAELs due to their lower power to detect real effects. Because NOAEL calculations are traditionally based on pairwise comparisons of exposed groups and controls, there is
no widely accepted procedure for calculating a NOAEL in settings where exposure is measured on a relatively continuous scale. Indeed, the current definition of NOAEL involves an implicit assumption that the dose levels are grouped in some way. Grouping is common in the context of controlled animal studies, but most epidemiological studies, including the available MeHg studies, measure exposure on a continuous scale.
Problems with the NOAEL and LOAEL approach have led to increasing interest in the development of alternative approaches based on dose-response modeling techniques. The benchmark dose was defined by Crump (1984) as a lower 95% confidence limit on the dose corresponding to a moderate increase (e.g., 1%, 5%, or 10%) over the background rate. Because the benchmark dose generally occurs within the range of experimental data, Crump and others have argued that its estimation is relatively robust to model choice. In an extensive empirical comparison of NOAEL and benchmark-dose calculations, Allen et al. (1994) found that the NOAEL in a typically sized developmental toxicity study was, on average, 6 times larger than the BMDL corresponding to a 5% risk. The NOAEL was higher than even a 10% BMD, on average, by a factor of 3. Leisenring and Ryan (1992) came to somewhat similar conclusions based on analytical considerations. Crump (1984) used the abbreviation BMD to refer to the benchmark dose. Other authors, including Crump (1995), use BMD to denote the estimated dose that corresponds to a specified risk above the background risk and BMDL to denote the corresponding lower limit. This latter notation has become standard usage now and will be used throughout the remainder of this chapter.
BENCHMARK-DOSE CALCULATIONS FOR CONTINUOUS OUTCOMES
Benchmark-dose calculations for quantitative outcomes (e.g., birth weight or IQ) are more complicated than those for quantal responses, such as presence or absence of a defect. Although Crump (1984) discussed how to calculate a BMD for a quantitative outcome, Gaylor and Slikker (1992) were the first to develop the approach in any detail. Their first step is to fit a regression model characterizing the mean of the outcome of interest as a function of dose and assuming that the data are normally distributed. The next step is to specify a cutoff to define values
for which the outcome can be considered abnormal. For example, a weight lower than 0.8 g might be considered abnormal for a teratology study in mice. Using the fitted model, one then calculates the dose-specific probability of falling into the abnormal region. The BMD is estimated as the dose corresponding to a specified increase in that probability, compared with the background probability. The BMDL is the corresponding 95% lower limit on that dose. Figure 7-1 illustrates the ideas behind the approach. The curve in the top panel represents the distribution of IQs in an unexposed population, and the curve in the lower panel has been shifted to the left in response to an exposure. Note that the mean IQ in the unexposed population is 100, and the standard deviation (SD) is 15. The shaded areas in the left tails of each distribution represent the proportion of the exposed and unexposed populations that fall below a specified cutoff point (we will refer to cutoff point as C), designated as the IQ level that indicates an adverse response. In Figure 7-1, we have used a value of C = 75, which represents the lower 5% of the control population. From the figure, it is easy to see that the further left we move the curve corresponding to the exposed group, the higher the percentage of the exposed population that falls below the cutoff point. Gaylor and Slikker's suggestion simply involves finding the exposure level that leads to a specific increase in the proportion of the population falling below the cutoff point. To be more precise, let Yi represent the outcome for the ith study subject, and suppose that a lowered outcome is considered to be adverse (e.g., as for IQ). Then, let P0 denote the probability that an unexposed individual falls below the value (C) that defines an adverse effect. The BMD is then defined as the dose, x, such that
Pr (Y < C | dose = x) − P0 = BMR,
where BMR denotes the “benchmark response” and refers to a specific risk increase above background risk. As in the quantal-response setting, BMR values of 0.1, 0.05, or possibly 0.01 are generally chosen. Later in the chapter, the committee focuses mostly on the case where P0 = 0.05 BMR = 10% of the children experiencing an adverse effect. Thus, these choices of P0 and BMR will result in a BMD that represents a doubling of the proportion of the population that falls into the adverse effect
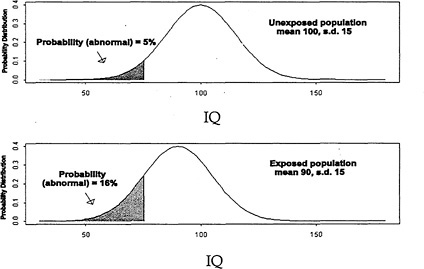
FIGURE 7-1 Hypothetical IQ distribution in an exposed and unexposed population.
region. Two broad approaches are available for BMD calculations that are based on continuous outcomes. As described above, one option is to fix P0 at a specified percentile of performance in the unexposed population (e.g., 0.05 or 0.10). Assuming that the data follow a linear model (Yi = a0 + a1X i + εi, where X i represents the exposure level for the ith subject, a0 and a1 are unknown regression coefficients, and εi is random error, assumed to be normally distributed with variance σ2), specifying a fixed P0 is equivalent to setting the cutoff value at a specified number of SDs below the mean in the unexposed group:
C = a0 + σΦ-1 (P0),
where Φ (×) represents the normal cumulative distribution function (i.e., the area under a standard normal curve up to and including the value ×). When P0 = 0.05, for example, the value of C is a0 −1.645 σ (i.e., 1.64 SDs below the control mean). Alternatively, one can choose the cutoff
value directly on the basis of clinical considerations or other information. For example, it might be appropriate to define 2,500 g as the cutoff in an epidemiological study of birth weight. In that case, P0 can be expressed as a function of C as follows:
As discussed by Crump et al. (1998), there are advantages to using the approach based on specifying a fixed P0 (i.e., the first option), because the calculations simplify in this setting, particularly in the presence of covariates (see also E. Budtz-Jørgensen, Copenhagen University, N. Keiding, Copenhagen University, and P. Grandjean, University of Southern Denmark, unpublished material, May 5, 2000). Under the assumption that the error terms follow a normal distribution, it follows that the benchmark dose will be the solution, BMD, to
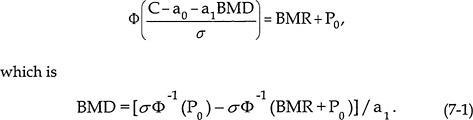
Notice that the estimated BMD simply corresponds to a constant divided by the dose-response slope from the regression model. That concept is important, because it provides some theoretical justification for some analyses (presented later) that are based on the inverse of the estimated benchmark doses from several MeHg studies.
Several authors have suggested variations on how to calculate BMDs for continuous outcomes. For example, Kodell and West (1993) and West and Kodell (1993) extended the Gaylor and Slikker approach to allow the model variance to depend on dose level (the calculations above assume a constant σ2). Crump (1995) developed a more general approach that relaxed the normality assumption required by previous approaches. Bosch et al. (1996) proposed a nonparametric approach that
avoided the need for specifying a distribution altogether. In general, the different approaches are unlikely to yield dramatically different results when the data are approximately normally distributed with constant variance, which is the case in most of the MeHg epidemiological studies.
SOME SPECIFIC CONSIDERATIONS FOR MeHg
Aside from the general issues discussed above, several specific issues further complicate the application of benchmark-dose methods for MeHg. Foremost among these issues is the existence of three studies of comparable quality that lead to seemingly conflicting results in terms of the association between MeHg and adverse developmental or neurological outcomes. Previous chapters have discussed in-depth some of the possible explanations for this conflict (e.g., unmeasured confounders, co-exposures, and variations in population sensitivity). Another possibility is that the differences are due to random chance. Indeed, study results have been presented and summarized largely in terms of p values based on statistical tests of the association between exposure and outcome. Only recently have several papers focused on dose-response modeling and benchmark-dose calculations. When the focus is on statistical testing rather than modeling, it is common to encounter apparent contradictions, wherein one study will yield a statistically significant association at p < 0.05, and another one does not. To assess study concordance more fully, it is useful to consider the statistical power1 that each has to detect effects of the magnitude observed.
For simplicity here, suppose that all confounders have already been accounted for, so that we can consider the power that a study will have to detect a true non-zero slope based on a simple linear regression (Yi = a0 + a1X i + εi, where Yi, X i, a0, a1, and εi are as defined above). It is straightforward to compute the power to detect specific values of the dose-response parameter a1, but comparing such calculations across studies is complicated, because the computed power depends on the distributions of exposure levels and outcomes within each study (see Zar
|
1 |
Statistical power refers to the probability of correctly rejecting the null hypothesis of no association when, in fact, a true association exists (see Zar 1998). |
1998). Cohen (1988, p. 75) argues that standardized regression coefficients provide a useful way to discuss power for the linear regression setting. The standardized regression coefficient corresponds to the raw slope (in our case, a1) multiplied by the standard deviation of exposure and divided by the standard deviation of the error term. In the simple linear regression setting, the standardized regression coefficient corresponds precisely to the Pearson correlation between X and Y. Because the standardized regression coefficient is a unitless quantity, power calculations are simplified considerably and involve only sample size. According to Table 3.4 of Cohen (1988), the New Zealand study would have had high power (85% or greater) to detect correlations of approximately ± 0.2 or larger, and the Seychelles and the Faroe Islands studies would have had power to detect smaller correlations of approximately ±0.1 or more. Figure 7-2 graphs the power that each study would have had to detect various values of the standardized regression coefficients. The Faroe Islands study, being the largest study, has the highest power, and the New Zealand study has the lowest.
To further aid in interpreting the power calculations summarized in Figure 7-2, we have computed the standardized regression observed in the studies. Table 7-1 shows the standardized regression coefficients for the significant outcomes in the Faroe Islands and New Zealand studies. Five of the eight effects reported in the Faroe Islands study were very small, ranging from −0.05 to 0.08. The power to detect such small effects in the Seychelles study — even with a sample of 700 children — was only about 50% (see Figure 7-2). Thus, some of the inconsistency between the findings of the Faroe Islands and the Seychelles studies could be due to limited power to detect very small effects, even in these very large samples. On the other hand, these analyses cannot explain the failure of the main Seychelles study to detect the neuropsychological effects of the magnitude reported in the New Zealand study, because the Seychelles study should have had adequate power to detect those effects.
There is at least one important caveat to the power considerations discussed above. Standard power calculations for the linear model setting are based on the assumption of a true linear relationship between exposure and outcome. In a real world dose-response setting, such as encountered for MeHg, there is likely to be some nonlinearity. That means that the observed level of statistical significance in a study might depend less on the total sample size than on the spread of the exposure
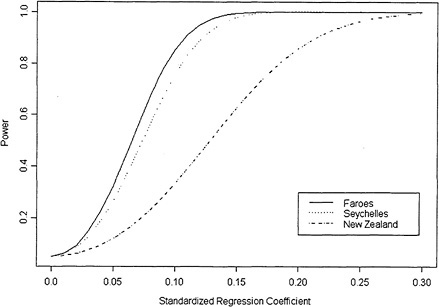
FIGURE 7-2 The power that each study has to detect a given standardized regression coefficient.
levels and, in particular, on whether there are sufficient observations at high exposure levels to characterize the true shape of the dose response in that region. In fact, all three studies had fairly skewed exposure distributions, with a large number of subjects clustered at low exposure levels, along with a few subjects exposed at moderate to high levels. Such skewness in the observed exposure levels can be associated with other problems as well. For example, extreme observations have the potential to exert a strong influence on the results in such settings. Indeed, Crump et al. (1998) reported nonsignificant results from a regression analysis on all the children in the New Zealand cohort, but significant results after omission of a single child whose mother's hair Hg concentration was 86 ppm (4 times higher than that of the next highest exposure level in the study). We will see presently that dose-
TABLE 7-1 Estimates of Standardized Regression Coefficients Based on Reported Study Results
|
Study |
Exposure SD |
Outcome |
Outcome SD |
Raw Regression Coefficient |
Standardized Regression Coefficient |
|
Faroe Islanda |
0.375 |
Finger Tapping |
6.15 |
−1.1 |
−0.07 Islands a |
|
CPT-Errors b |
0.54 |
0.12 |
0.08 |
||
|
CPT-Reaction |
80 |
40.3 |
0.18 |
||
|
Time |
|||||
|
Digit Span |
1.5 |
−.27 |
−0.06 |
||
|
Boston Naming |
5.3 |
−1.77 |
−0.12 |
||
|
Test-no cues |
|||||
|
Boston Naming |
5.3 |
−1.91 |
−0.13 |
||
|
Test-cues |
|||||
|
CVLT-Short-term |
3.1 |
−0.57 |
−0.06 |
||
|
CVLT-Long-term |
3.8 |
−0.55 |
−0.05 |
||
|
New Zealandc |
3.31 |
TOLD-Language Development |
16 |
−0.6 |
−0.12 |
|
WISC-R:PIQ |
16 |
−0.54 |
−0.11 |
||
|
WISC-R:FSIQ |
16 |
−0.55 |
−0.11 |
||
|
McCarthy |
10 |
−0.53 |
−0.17 |
||
|
Perceptual |
|||||
|
Performance |
|||||
|
McCarthy Motor |
0.15 |
−0.007 |
−0.15 |
||
|
Test b |
|||||
|
aExposures measured on the log-scale. Exposure SD and regression coefficients provided by study investigators (Grandjean et al. 1997). Outcome SDs estimated by dividing the interquartile range by 1.3. bLog transformed. cData from Crump et al. 1998. Abbreviations: CPT, Continuous Performance Test; CVLT, California Verbal Learning Test; TOLD, Test of Language Development; WISC-R:PIQ, Wechsler Intelligence Scale for Children-Revised Performance IQ; WISC-R:FSIQ, Wechsler Intelligence Scale for Children-Revised Full-Scale IQ. |
|||||
response estimates for the Faroe Islands study were also sensitive to omission of some of the observations with very high exposure levels.
COMPARING BENCHMARK DOSES
From a statistical perspective, reconciling differences among the various studies is more appropriately accomplished by a comparison of dose-response estimates (i.e., regression slopes) rather than p values resulting from the application of hypothesis tests. In this section, we present and compare benchmark-dose calculations from the New Zealand, Faroe Islands, and Seychelles studies. These have been reported individually for the New Zealand study by Crump et al. (1998) and also for the Seychelles study (Crump et al. 2000). BMDs for the Faroe Islands study have been calculated in a report prepared for EPA (Budtz-Jørgensen et al. 1999) and in an unpublished technical report (E. Budtz-Jørgensen, Copenhagen University, N. Keiding, Copenhagen University, and P. Grandjean, University of Southern Denmark, unpublished material, May 5, 2000), both of which were made available to the committee. The committee also requested and obtained some additional calculations to be discussed presently.
It might seem counterintuitive to present benchmark-dose calculations for the Seychelles study which did not show statistically significant associations between exposure and outcome. However, the idea makes more sense if we think of a benchmark dose as simply a transformation of the estimated dose response (as we saw in Eq. 7-1). Just as it can make sense to compare slope estimates from several studies, some of which are significantly different from zero and some of which are not, so can it make sense to compare benchmark doses. In the following example, we assume that lower values of the outcomes in question are adverse. Crump et al. (2000) argued that it is possible to calculate a BMDL even for studies where the estimated dose response goes in the ‘wrong' direction. In such settings, the estimated BMD will not even exist. That is, when the estimated regression line suggests a beneficial effect of exposure (as was the case for several outcomes in the Seychelles study), a linear regression model predicts that there will be no exposure level resulting in a 10% adverse response. However, even in such a setting, the BMDL will be finite so long as the estimated regression coefficient is not statistically significantly different from zero, so that its upper or lower confidence limit (depending on whether a larger or smaller response is considered adverse) still goes in the expected direction. Indeed, Crump et al. (2000) presented BMDLs for five outcomes
from the Seychelles study. An important caveat to this discussion is that BMDLs based on negative studies should be interpreted very cautiously. Although such calculations can be useful in a setting like ours where we are interested in comparing results over several MeHg studies, the committee advises that particular care be applied in using this approach in settings involving a single negative study as the basis for a risk assessment. Further research on this topic would be useful.
Crump et al. (1998) calculated BMDs for the New Zealand cohort at age 6, using the K-power model2 and assuming P0 = 0.05 and BMR = 0.10. Five outcomes were considered: TOLD Language Development, WISC-R Performance IQ, WISC-R Full-Scale IQ, McCarthy Perceptual Performance Scale, and McCarthy Motor Scale. It is important to note again that the results of the analysis reported here are based on omitting the highest exposed individual (86 ppm). A hair Hg concentration of 86 ppm is more than 4 times the next highest hair Hg concentration in the study. If the one-compartment pharmacokinetic model and EPA's standard default input assumption are used, it can be estimated that a 60-kg woman would have to eat an average of 0.5 pounds (227 g) of fish containing 2.2 ppm of Hg to reach a hair Hg concentration of 86 ppm. Consistent exposure at such a dose seems unlikely when the mean Hg concentration in fish from fish-and-chips shops, a principal source of exposure in New Zealand (Kjellström et al. 1986), is 0.72 ppm (Mitchell et al. 1982). On the basis of those considerations, the committee concluded that analyzing the New Zealand data without the data from that individual is appropriate.
Budtz-Jørgensen et al. (1999) presented BMDs and BMDLs for five outcomes measured in the Faroe Islands study: motor speed (finger tapping), attention (CPT reaction time), visuospatial performance (Bender), language (Boston Naming Test), and short-term memory (California Verbal Learning Test). The calculations for each outcome were done using the K-power model, as well as standard linear models applied to the untransformed exposure and square-root and log-transformed exposures. Calculations for the Faroe Islands study were per-
|
2 |
The K-power model assumes the following mean: a0 + a1xk, where K is a parameter to be estimated along with a0 and a1, thus allowing for a nonlinear dose-response relationship. The estimated value of K is typically constrained to be greater than or equal to 1. |
formed for both maternal-hair and cord-blood Hg. Methods similar to those reported by Crump et al. (1998) were used, fixed P0 values being 0.05 and 0.16 and excess risks (BMRs) being 5% and 10%. For comparability, the committee requested that the Crump analyses on the Seychelles and New Zealand data be expanded to include BMD and BMDL calculations for P0 = 0.05 and 0.16 and for BMR = 0.05 and 0.10. The committee requested these analyses only for the outcomes measured when the children were 5 to 7 years old, because that age period was the only one available from the Faroe Islands study, and data from that age group have better predictive ability than data from earlier ages (E. Budtz-Jørgensen, Copenhagen University, N. Keiding, Copenhagen University, and P. Grandjean, University of Southern Denmark, unpublished material, May 5, 2000). For the Seychelles study, six 66-month end points were considered: Bender Gestalt errors, Child Behavior Checklist-Total, McCarthy-General Cognitive Index, Preschool Language-Total Score, Woodcock-Johnson Applied Problems, and Woodcock-Johnson Letter-Word recognition. For reasons to be discussed in more detail presently, the focus here is on calculations derived from the K-power model applied with P0 = 0.05 and BMD = 0.05. The results of these analyses are summarized in Table 7-2 and graphically represented in Figure 7-3.
Table 7-2 and Figure 7-3 reveal some interesting patterns. First, we see that although study-to-study variability is substantial, within-study consistency (i.e., outcome to outcome) is relatively high. BMDs tended to be lowest for the New Zealand study. BMD and BMDL estimates for the Seychelles study tended to be either nonexistent or quite large (nonexistent values or values greater than 100 are indicated by asterisks in the table). Despite the substantial variability, however, the analyses yield a range of BMD values that are moderately consistent across the three studies. The next section discusses how those data might be used as the basis for a risk assessment.
CHOOSING A CRITICAL DOSE FOR A POINT OF DEPARTURE
An important step in the risk-assessment process is choosing an appropriate dose to be used as the “point of departure” (i.e., choosing the dose to which uncertainty factors will be applied to estimate an
TABLE 7-2 Benchmark Dose Calculations (ppm MeHg in maternal hair) from Various Studies and for Various End Points
|
Study |
End Point |
BMDa |
BMDL |
|
Seychellesb |
Bender Copying Errors |
25 |
|
|
Child Behavior Checklist |
21 |
17 |
|
|
McCarthy General Cognitive |
23 |
||
|
Preschool Language Scale |
23 |
||
|
WJ Applied Problems |
22 |
||
|
WJ Letter/Word Recognition |
22 |
||
|
Faroe Islandsc |
Finger Tapping |
20 |
12 |
|
CPT Reaction Time |
17 |
10 |
|
|
Bender Copying Errors |
28 |
15 |
|
|
Boston Naming Test |
15 |
10 |
|
|
CVLT: Delayed Recall |
27 |
14 |
|
|
New Zealandd |
TOLD Language Development |
12 |
6 |
|
WISC-R:PIQ |
12 |
6 |
|
|
WISC-R:FSIQ |
13 |
6 |
|
|
McCarthy Perceptual Performance |
8 |
4 |
|
|
McCarthy Motor Test |
13 |
6 |
|
|
aBMDs are calculated from the K-power model under the assumption that 5% of the responses will be abnormal in unexposed subjects (P0 = 0.05), assuming a 5% excess risk (BMR = 0.05). bData from Crump et al. 1998, 2000. “Extended” covariates. cData from Budtz-Jørgensen et al. 1999. dData from Crump et al. 1998, 2000. e *** indicates value exceeds 100. Abbreviations: WJ, Woodcock-Johnson Tests of Achievement; CPT, Continuous Performance Test; CVLT, California Verbal Learning Test; TOLD, Test of Language Development; WISC-R:PIQ, Wechsler Intelligence Scale for Children-Revised Performance IQ; WISC-R:FSIQ, Wechsler Intelligence Scale for Children-Revised Full-Scale IQ. |
|||
RfD). In a traditional setting, NOAELs are computed for each end point in each study, and the point of departure would most likely be chosen to correspond to the highest observed NOAEL. In the present setting, however, where BMDs and BMDLs are calculated instead of NOAELs, the appropriate choice is not immediately clear. It is not necessarily
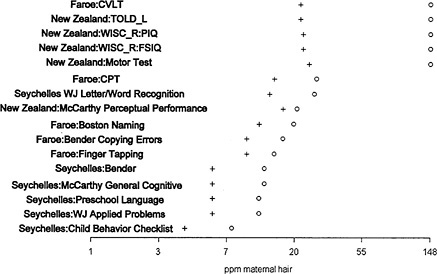
FIGURE 7-3 Benchmark dose (o) and lower 95% confidence limit on the benchmark dose (+): P0 = BMR = 0.05, K-power model. Abbreviations: WJ, Woodcock-Johnson Tests of Achievement; CPT, Continuous Performance Test; CVLT, California Verbal Learning Test; TOLD, Test of Language Development; WISC-R:PIQ, Wechsler Intelligence Scale for Children-Revised Performance IQ; WISC-R:FSIQ, Wechsler Intelligence Scale for Children-Revised Full-Scale IQ.
appropriate to choose the lowest BMDL as the point of departure because that could easily result in choosing an unreliable end point (i.e., one with great uncertainty). One suitable option might be to choose the BMDL corresponding to the end point with the lowest BMD, selected from among those end points that show a statistically significant effect of exposure. That would lead to choosing the BMD or BMDL based on McCarthy Perceptual Performance from the New Zealand study. The BMD for this end point estimated from the K-power model is 8 ppm; the corresponding BMDL is 4.
The committee had some reservations about choosing the New Zealand study as the basis for risk assessment. First, it is a relatively small study, with only 237 children in contrast to over 700 studied in both the
Seychelles and the Faroe Islands studies. The original study results were not reported in the peer-reviewed literature but in a technical report to the Swedish Government. Although Crump et al. (2000) reported some statistical modeling of the data, the study has not been as comprehensively evaluated nor subject to the same level of scrutiny and re-analysis as the Seychelles and Faroe Islands studies.
The committee concluded that it would be inappropriate to pick the Seychelles study as the basis for risk assessment, given the available evidence for positive effects in the New Zealand and Faroe Islands studies, as well as in the Seychelles own pilot study. The committee felt that a good argument can be made for choosing the Faroe Islands study as the basis for the risk assessment. The Faroe Islands study is large (over 900 children) and measured two biomarkers of exposure. Moreover, it has been extensively analyzed and re-analyzed to explore the extent of confounding and the impact of outliers.
As discussed in Chapter 4, both hair and blood are reliable biomarkers for MeHg exposure. Given the lack of knowledge of differential effects of MeHg at different periods of gestation, there is currently no compelling reason to consider one biomarker of fetal exposure more appropriate than the other. Comparison of the analyses based on hair and cord blood in the Faroe Islands study suggests that the cord-blood measure explains more of the variability in more of the outcomes than hair Hg (see Table 6-1). On that basis, the committee recommends that cord blood be used as the biomaker for a risk assessment of the Faroe Islands data.
Table 7-3 shows the BMDs and BMDLs for the five principal Faroe Islands outcomes based on cord-blood measurements. Normally, the most sensitive adverse end point is selected as the basis for risk assessment. However, in the context of a neuropsychological test battery, the reliability of the individual end points can be highly variable. Therefore, it might not be appropriate in all cases to select the one most sensitive end point as a point of departure for the BMDS. In the Faroe Islands cord-blood analyses, the CPT reaction time measure had the smallest BMD and BMDL. However, because of difficulties in test administration, the data from the second half of the cohort were discarded for the analysis of this end point. Under the circumstances, the committee felt that it would be more appropriate to select the second most sensitive end point, the Boston Naming Test, for which no administration difficulties were encountered. It is noteworthy that the Boston Naming Test
TABLE 7-3 Benchmark Dose Calculations (ppb MeHg in cord blood) from the Faroe Islands Study for Various End Points
|
End Point |
BMDa |
BMDL |
|
Finger Tapping |
140 |
79 |
|
CPT Reaction Time |
72 |
46 |
|
Bender Copying Errors |
242 |
104 |
|
Boston Naming Test |
85 |
58 |
|
CVLT: Delayed Recall |
246 |
103 |
|
aBMDs are calculated from the K-power model under the assumption that 5% of the responses will be abnormal in unexposed subjects (P0 = 0.05), assuming a 5% excess risk (BMR = 0.05). Abbreviations: CPT, Continuous Performance Test; CVLT, California Verbal Learning Test. Source: Budtz-Jørgensen et al. 1999. |
||
was the most sensitive end point in the analyses based on maternal-hair Hg concentration.
The results of the Faroe Islands cord-blood Hg analysis for the Boston Naming Test provide a BMD of 85 ppb and a BMDL of 58 ppb. Corresponding values for hair Hg can be calculated by dividing the cord-blood concentration by a factor of 5 ppb of blood per ppm hair (Grandjean et al. 1992). Such a calculation results in a BMD of 17 ppm and a BMDL of 12 ppm for hair. It is interesting to note that those values are in fact quite close to the BMD and BMDL calculated for the Boston Naming Test based directly on the hair Hg concentration (i.e., BMD, 15 ppm; BMDL, 10 ppm).
Despite several strong arguments in favor of choosing a point of departure based on the Faroe Islands study, there was some concern that the estimated BMDs and corresponding BMDLs could be confounded by PCB exposure, which was not adjusted statistically in the benchmark analysis. To address this question, the committee requested that the Faroe Islands research group provide some additional calculations. Accordingly, Budtz-Jørgensen and colleagues3 provided estimates of the
|
3 |
E. Budtz-Jørgensen, Copenhagen University, N. Keiding, Copenhagen University, and P. Grandjean, University of Southern Denmark, unpublished material, June 21, 2000. |
BMDs and BMDLs for four end points (Finger Tapping, CPT Reaction Time, Boston Naming, and CVLT Delayed Recall) based on (1) models that include log(PCB) as an additional covariate and (2) the subset of subjects in the lowest tertile of PCB exposures. Because PCBs were measured only for children examined in 1993, only about half of the full cohort (approximately 450 children) are used for analysis 1, and only one-sixth (approximately 150 Children) are used for analysis 2. Results were provided for Hg measured in both maternal hair and cord blood (see Table 7-4). The reduced sample sizes in these additional analyses increased the variability among the results. There was no clear pattern with respect to how the PCB-adjusted analyses differed from the original results.
Because of the potential for measurement error to cause additional bias with respect to estimating the Hg effects in the PCB-adjusted models, the committee gave greater weight to interpreting the results of analyses performed in the low PCB subset. Comparing the low PCB subset with the full cohort results, for example, the BMDs for Finger Tapping and CPT Reaction Time were 5-13 ppm lower for maternal hair and 19-99 ppb lower for cord blood, and the BMDs for Boston Naming and Delayed Recall were 5-6 ppm higher for maternal hair and 42-147 ppb higher for cord blood. Thus, the BMDs for the low-PCB-exposed subset for the two end points that were related to PCB exposure — Boston Naming and California Verbal Learning — did not differ from the BMDs for the total sample by any more than the BMDs for the two end points that did not relate to PCB exposure. It should also be noted that the variability seen in Table 7-4 is well within that expected by chance; note that, in all cases, the BMDs and BMDLs for both the PCB-adjusted and the low-PCB subset analyses lie well within the intervals defined by the BMDs and corresponding BMDLs derived for the full cohort. For example, the BMD for the Boston Naming Test based on cord blood in the full cohort (85 ppb) is smaller than the BMD based on the low PCB subset (127 ppb). In fact, the difference between the BMDs based on the full cohort and the low PCB subset is less than one standard error of the BMD based on the low PCB cohort. In weighing all these considerations, the committee concludes that results based on the full cohort provide a reliable basis for establishing a point of departure for a risk assessment for MeHg. Because cord blood explains more of the ob-
TABLE 7-4 BMD (BMDL) Estimates from the Faroe Islands Study with and Without Adjustment for PCBs and in the Subset of Low PCB-Exposed Children (Results are reported separately for MeHg measured in hair and cord blood and are calculated using the K-power model.)
|
Full Cohort |
Adjusted for PCBs |
Low PCB subset |
||
|
Exposure |
End Point |
BMD (BMDL)a |
BMD (BMDL) |
BMD (BMDL) |
|
Hair |
Finger Tapping |
20 (12) |
17 (9) |
7 (4) |
|
CPT Reaction Time |
18 (10) |
27 (11) |
13 (5) |
|
|
Boston Naming Test |
15 (10) |
24 (10) |
21 (6) |
|
|
CVLT: Delayed Recall |
27 (14) |
39 (12) |
32 (7) |
|
|
Cord |
||||
|
Blood |
Finger Tapping |
140 (79) |
149 (66) |
41 (24) |
|
CPT Reaction Time |
72 (46) |
83 (49) |
53 (28) |
|
|
Boston Naming Test |
85 (58) |
184 (71) |
127 (40) |
|
|
CVLT: Delayed Recall |
246 (103) |
224 (78) |
393 (52) |
|
|
aBMDs are calculated under the assumption that 5% of the responses will be abnormal in unexposed subjects (P0 = 0.05), assuming a 5% excess risk (BMR = 0.05). Abbreviations: CPT, Continuous Performance Test; CVLT, California Verbal Learning Test. Source: E. Budtz-Jørgensen, Copenhagen University, N. Keiding, Copenhagen University, and P. Grandjean, University of Southern Denmark, unpublished material, April 28, 2000. |
||||
served variability than Hg in maternal hair, the committee believes that it provides a more suitable biomarker for determining the point of departure.
AN INTEGRATIVE ANALYSIS
Although the committee felt comfortable with recommending that risk assessment be based on the Boston Naming Test from the Faroe Islands study, it also explored a weight-of-evidence approach based on an integrative analysis that allows a quantitative synthesis of informa-
tion available across studies (see Hedges and Olkin 1985 for a more general discussion). Indeed, the recent draft EPA guidelines for carcinogen risk assessment suggest that such approaches can be useful in settings where it is difficult to chose a single study to serve as the basis for a risk assessment (EPA 1999). When well conducted, integrative analysis can provide valuable information to bolster or support a weight-of-evidence argument. Of course, synthesizing data across studies requires a careful statistical analysis that takes proper account of appropriate study-to-study and, in this case, outcome-to-outcome heterogeneity. One approach is to use a hierarchical random effects model. The committee conducted such an analysis using an extension of a method discussed by Dominici et al. (in press). Although the technical details can be complicated, the hierarchical modeling basically serves to smooth away some of the random variation that complicates the interpretation of the data presented in Table 7-2.4 The approach also provides a way to quantify study-to-study and outcome-to-outcome variability. To motivate the approach, it is useful to consider the graphical presentation of our data in Figure 7-3. The Figure displays estimated BMDs and corresponding BMDLs for the outcomes listed in Table 7-2. Results are presented from the K-power model, the parameters P0 and BMR both taking the value 0.05. The plot is organized in order of increasing BMD values. The circles indicate BMD and the crosses indicate BMDLs. To allow the eye to distinguish more easily between the values associated with the Faroe Islands and New Zealand studies, the plot is drawn on the log scale. As discussed earlier, several of the BMDs did not exist for the Seychelles study. The committee has arbitrarily assigned those a value of 150 for the purpose of plotting. The figure illustrates the large study-to-study variability relative to the outcome-to-outcome variability. The figure suggests that it might make sense to borrow strength from the different studies and outcomes to gain increased precision. That is what the hierarchical model achieves. The results allow us to do several things. First, we can obtain a revised, smooth estimate of the BMDs in each study. Table 7-5 provides these
|
4 |
To handle nonexistent BMDs, the hierarchical model was applied to the inverse of the BMDs reported in Table 7-2. Nonexistent BMDs were assigned an inverse value of 0. See appendix for more detail. |
TABLE 7-5 Results of Applying the Hierarchical Analysis to BMDs (ppm of MeHg in Hair) Calculated Using the K-power Model
|
Original |
Smoothed |
||
|
Study |
End Point |
BMD (BMDL)a |
BMD (BMDL) |
|
Seychellesb |
Bender Copying Errors |
***e (25) |
*** (26) |
|
McCarthy General Cognitive |
*** (23) |
*** (24) |
|
|
WJ Applied Problems |
*** (22) |
*** (24) |
|
|
Child Behavior Checklist |
21 (17) |
22 (18) |
|
|
Preschool Language Scale |
*** (23) |
*** (25) |
|
|
WJ Letter/Word Recognition |
*** (22) |
*** (24) |
|
|
Faroe Islandsc |
Finger Tapping |
20 (12) |
20 (13) |
|
CPT Reaction Time |
18 (10) |
19 (12) |
|
|
Bender Copying Errors |
28 (15) |
24 (15) |
|
|
Boston Naming Test |
15 (10) |
17 (12) |
|
|
CVLT: Delayed Recall |
27 (14) |
24 (15) |
|
|
New Zealandd |
TOLD Language Development |
12 (6) |
13 (8) |
|
WISC-R:PIQ |
12 (6) |
13 (8) |
|
|
WISC-R:FSIQ |
13 (6) |
13 (8) |
|
|
McCarthy Perceived Performance |
8 (4) |
12 (7) |
|
|
McCarthy Motor Test |
13 (6) |
13 (8) |
|
|
aBMDs are calculated under the assumption that 5% of the responses will be abnormal in unexposed subjects (P0 = 0.05), assuming a 5% excess risk (BMR = 0.05). bData from Crump et al. (1998) and Crump et al. 2000. “Extended” covariates. cData from Budtz-Jørgensen et al. 1999. dData from Crump et al. 1998, 2000. e*** indicates nonexistent values or values greater than 50. Abbreviations: WJ, Woodcock-Johnson Tests of Achievement; CPT, Continuous Performance Test; CVLT, California Verbal Learning Test; TOLD, Test of Language Development; WISC-R:PIQ, Wechsler Intelligence Scale for Children-Revised Performance IQ; WISC-R:FSIQ, Wechsler Intelligence Scale for Children-Revised Full-Scale IQ. |
|||
smoothed BMDs along with corresponding BMDLs. For comparison, the original unsmoothed values are also included. Results are shown for the K-power model with P0 = 0.05 and BMR = 0.05. Note that the effect of the hierarchical modeling is to smooth away much of the random variability observed in the original data. That is especially true of the more extreme values. Estimated BMDs are relatively unchanged for the Faroe Islands study, although even in that study, the outcome-to-outcome variability is reduced. Smoothing increases the BMDs slightly for the New Zealand study. BMDs for the Seychelles study remain high and most are still indicated with asterisks. Another interesting thing to notice from the table is that all the BMDLs tend to move closer to their respective BMDs. That is because the hierarchical model is able to reduce the variability inherent to each individual BMD estimate by drawing strength from the other end points. An important feature of the table is that although much of the outcome-to-outcome variability seems to be smoothed away through the hierarchical modeling, substantial study-to-study variability remains.
Although the hierarchical modeling provides a useful tool for separating random versus systematic variation and provides more stable estimates of study-specific and outcome-specific BMDs, the question remains regarding how the results might be used for risk assessment. There are several possible approaches. One would be to repeat the exercise described in the previous section, basing the risk assessment on either the Faroe Islands or the New Zealand studies but replacing the original BMD and BMDL estimates with the smoothed values from Table 7-5. The argument in favor of this approach is that it will have removed some of the bias associated with selecting an extreme value, and also it will have reduced some of the statistical variability. One could also argue for using the estimate of central tendency derived from the hierarchical modeling approach. The committee's analysis based on the K-power model suggests a mean BMD of 21 ppm, which coincidentally corresponds precisely to the mean of the smoothed BMDs from the Faroe Islands study. (The mean of the unsmoothed BMDs from the Faroe Islands study is 22 ppm). A third approach would be to produce a theoretical estimate of the BMDL on the basis of the lower 5th percentile point from the estimated distribution of BMDs obtained from the hierarchical modeling exercise. Applying this approach to the results for
the K-power model yields an estimate of 7 ppm. The various approaches discussed in this section are summarized in Table 7-6.
MODEL CHOICE ISSUES
As mentioned earlier, the calculations provided by the Faroe Islands research group to the EPA included BMD and BMDL calculations under square-root and log transformations as well as calculations for the K-power model (Budtz-Jørgensen et al. 1999). To enable a full comparison with the results of other studies, the committee requested that the Crump analyses be expanded to include results based on the square-root and log transformations for the New Zealand and Seychelles studies. At first inspection, the results were troubling. Although standard statistical assessments of model adequacy could not distinguish between models based on the K-power model applied to untransformed data, or linear models based on square-root or log dose, the corresponding BMDs and BMDLs differed fairly dramatically. In general, BMDs and BMDLs were lowest for the log model and highest for the linear model. Budtz-Jørgensen and colleagues provided some extended discussion on this issue in the context of the Faroe Islands study (E. Budtz-J ørgensen, Copenhagen University, N. Keiding, Copenhagen University, and P. Grandjean, University of Southern Denmark, unpublished material, May 5, 2000). Because of the profound importance of model choice on estimation of the BMD, the committee requested that the Faroe Islands research group5 provide some additional calculations to aid the committee's deliberations. The committee wondered, for example, if the influence of a few highly exposed individuals on the estimated dose response might explain the large model-to-model variations. The Faroe Islands study research group conducted sensitivity analyses repeating the regression models after omitting some of the highest observations. The results suggested that the influence of the extreme observations did not explain the model-to-model variability.
|
5 |
E. Budtz-Jørgensen, Copenhagen University, N. Keiding, Copenhagen University, and P. Grandjean, University of Southern Denmark, unpublished material, April 28, 2000. |
TABLE 7-6 Approaches to Benchmark Dose Calculation (ppm MeHg in Hair)
|
Approach |
BMD |
BMDL |
|
Most sensitive end point from New Zealand |
8 |
4 |
|
Median end point from New Zealand |
12 |
6 |
|
Most sensitive end point from Faroe Islands study |
15 |
10 |
|
Median end point from Faroe Islands study |
20 |
12 |
|
Integrative analysis |
21a |
8b |
|
aLogically equivalent to a BMD. bLogically equivalent to a BMDL. Lower 5th percentile from the estimated distribution of BMDs. |
||
After extensive discussion, the committee concluded that the most reliable and defensible results for the purpose of risk assessment are those based on the K-power model. The argument for this conclusion is as follows. In dose-response settings like those with MeHg, when there are no internal controls (i.e., no unexposed individuals) and where the dose response is relatively flat, the data will often be fit equally well by linear, square-root and log models. The models can yield very different results for BMD calculations, however, because these calculations necessitate extrapolating to estimate the mean response at zero exposure level. Both the square-root and the log models take on a supralinear shape at low doses, that is, they postulate a steeper slope at low doses. Thus, they tend to lead to lower estimates of the BMD than linear or K-power models. From a toxicological perspective, the K-power model has greater biological plausibility, because it allows for the dose response to take on a sublinear form, if appropriate. Sublinear models would be appropriate, for instance, in the presence of a threshold. The K-power model is typically fit under the constraint that K ≥ 1, so that supralinear models are ruled out. Figure 7-4 contrasts several classes of dose-response models.
The model sensitivity described here might seem in conflict with the concept, put forward by Crump and others, that by estimating risks at moderate levels, such as 5% or 10%, the BMD should be relatively robust to model specification. As discussed by Budtz-Jørgensen and colleagues, key to understanding this apparent contradiction is that the Faroe Islands study does not include any true controls (i.e., subjects with
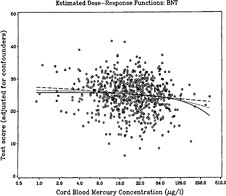
FIGURE 7-5 Dose-response curves fitted to cord-blood Hg data for the linear, square root, and log transformations. Source: E. Budtz-Jørgensen, University of Copenhagen, unpublished material, November 12, 1999.
zero exposure) (E. Budtz-Jørgensen, Copenhagen University, N. Keiding, Copenhagen University, and P. Grandjean, University of Southern Denmark, unpublished material, May 5, 2000). The majority of exposures resulted in hair Hg concentrations that exceeded 5 ppm (24 ppb cord blood). The interquartile range for hair Hg concentration was 3 to 8 ppm (13 to 40 ppb for cord blood) (Grandjean et al. 1992). When models are fitted to the data, they are really capturing the shape of the dose response in this middle range of exposure, as illustrated in Figure 7-5. The figure shows dose-response curves fitted to hair Hg data for the
linear, square-root and log transformations. The data and fitted curves are plotted on the log scale, so that the fitted log model appears linear and the linear model shows the highest degree of curvature. What becomes clear from Figure 7-5 is that variations in estimated BMDs are not explained by differences in how well the models fit the bulk of the data but rather what the models predict for the mean response for unexposed individuals.
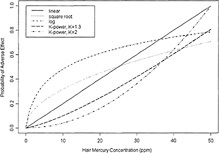
Figure 7-4 The estimated expected excess response due to Hg exposure as a function of the Hg concentration calculated using the linear, square root, and logarithmic (log) model. Source: E. Budtz-Jørgensen, Copenhagen University, N. Keiding, Copenhagen University, and P. Grandjean, University of Southern Denmark, unpublished material, May 5, 2000.
Because the BMD estimation is based essentially on extrapolation to zero exposure from three models that fit equally well, the committee concludes that the choice regarding which model to use cannot be based on statistical grounds alone. Instead, a more biologically based argument is needed. One useful way to think of differences between the various models is that the linear model implicitly assumes an additive effect of Hg exposure, the log model assumes a multiplicative effect, and the square root lies somewhere in between. All three models fit essentially equally well to data that for the most part correspond to concentrations between 2 and 20 ppm in hair. However, the models differ fairly dramatically with regard to how they extrapolate to values below those levels. The linear model would predict that the change in mean outcome as MeHg concentration goes from 0 to 10 ppm in hair should be the same as the change observed in the mean outcome as concentration increases from 10 to 20 ppm. In contrast, the log-model would predict that the change in mean outcome associated with any doubling of MeHg concentration should be the same as the change observed in the mean outcome as concentration increases from 10 to 20 ppm. Thus, the log model would predict that the same magnitude change in outcome would be expected as the concentration goes from 1 to 2 ppm or from 4 to 8 ppm as that observed for the concentration going from 10 to 20 ppm — that is, the extrapolation down to zero exposure will predict a very steep slope at low doses. Given the relative absence of exposures at very low levels, a decision should be made on biological grounds regarding which model makes the most sense for risk assessment. The committee believes that an additive (linear) or perhaps sublinear model is the most justifiable from a biological perspective, thus ruling out square-root and log-transformed models. For MeHg, the committee believes that a good argument can be made for the use of a K-power model with K constrained to be greater than or equal to 1. That rules out square-root (K = 0.5) and log models (the limiting case as K approaches 0). More generally, the committee concludes that considerable caution should be used in fitting models based on log or square-root transformations of exposure, which might not be appropriate in dose-response settings, such as those for MeHg, where there are no internal controls and where the dose response is relatively flat. In such settings, linear models based on log- or square-root-transformed data are likely to yield
results very similar to those based on untransformed exposures. The supralinear shape of the log and square-root models at low doses will tend to result in smaller BMD estimates than those based on untransformed models.
SUMMARY AND CONCLUSIONS
-
Benchmark-dose calculations are available for the Seychelles, New Zealand, and Faroe Islands studies. The calculations reveal fairly high within-study consistency (i.e., outcome to outcome) and high study-to-study variability.
-
In general, risk assessments for various toxicants based on animal studies have used a BMR of 0.1, because it usually represents the low range of the observed exposure data. Crump et al. (2000) used a BMR of 0.1 (i.e., 10% of the population is at risk) in their analyses of the New Zealand and Seychelles studies. For the end points studied, the baseline rate in the population is 0.05 (P0). Selection of a BMR of 0.1, therefore, could result in as much as a tripling of the percentage of the population falling into the abnormal range of neurological performance. The committee, to be more protective of public health, has used a P0 of 0.05, a BMR of 0.05 (i.e., 5% of the population is at risk). Specification of P0 in the context of the MeHg studies, however, is somewhat problematic because of the absence of subjects with true zero exposure. The mean response rate at zero is not actually based on observed data but is extrapolated from the fitted model. Because of that, extra caution is needed in choosing a dose-response model as the basis of a risk assessment. Choosing to have P0 and BMR both equal to 0.05 could lead to a doubling of the proportion of the population falling into the abnormal range. The committee recognizes, however, that the choice of P0 and the BMR is at the interface of science and policy and should be a science-informed policy judgment. That decision involves choosing a level of risk (i.e., 10%, 5%, or 1%) that is considered to be an “acceptable risk,” similar to the choice of an acceptable risk for a carcinogen (i.e., 1 × 10⁻⁶ cases). That decision should be guided by the full body of evidence and based on the best available and most relevant data. In choosing the P0 and the BMR for MeHg, it is
-
preferable that the range of MeHg concentrations and outcomes observed in the Faroe Islands study be considered.
-
Basing the risk assessment on the single most sensitive end point from the most sensitive study would lead to the use of McCarthy Perceptual Performance Scale from the New Zealand study.
-
The Faroe Islands study provides the strongest basis for choosing the critical dose for defining a point of departure. This large, high-quality study has been extensively analyzed and re-analyzed to explore the possibility of confounding, outliers, differential sensitivity, and other factors. The Boston Naming Test scores are the most sensitive, reliable end point.
-
The potential for confounding by PCB exposure is of some concern for the Faroe Islands study. However, on the basis of a series of sensitivity analyses provided by the Faroe Islands research group, the committee concluded that the PCB exposures were unlikely to be causing serious bias in BMD estimates. Although BMD and BMDL estimates were available in the subset of low PCB exposed subjects, the committee decided to use the estimates based on the full cohort because the considerably larger sample size was felt to result in more reliable estimates.
-
It would not be appropriate to base risk-assessment decisions on the Seychelles study because it did not find an association between MeHg and adverse neurodevelopment effects. That finding is not consistent with the weight of evidence demonstrating such an association in the Faroe Islands and New Zealand studies.
-
A risk assessment could also be based on an integrative analysis that combines the results of all three studies. One advantage of this approach is that it increases the precision of critical-dose estimates. One could choose either a measure of central tendency (leading to a BMD of 21 ppm in hair) or a lower 5% limit based on the estimated theoretical distribution of benchmark doses (leading to an estimate of 7 ppm in hair). Because the integrative analysis is exploratory, it would be premature to use this approach as the basis for risk assessment for MeHg. However, the approach was useful for facilitating a weight-of-evidence assessment. Furthermore, it is reassuring that the results based on this approach are consistent with those based on the more classic approaches that select a single study.
-
Model choice is an important source of uncertainty for the purpose of quantitative risk assessment. Changing the underlying modeling assumptions can have a dramatic effect on the estimated benchmark dose. The committee suggests that the K-power (K ≥ 1) model results be used.
-
Even when such modeling decisions have been made, benchmark-dose calculations require specification of the cutoff point used to define an adverse effect (P0) and the risk level (BMR) of the benchmark dose. Those are, in part, policy decisions.
-
The committee concludes that, given these considerations, the results from the Boston Naming Test in the Faroe Islands study should be used. For that end point, dose-response data based on Hg concentrations in cord blood should be modeled. For that data set, the K-power model (K ≥ 1) is the model of choice. This analysis estimates a BMD of 85 ppb and a BMDL of 58 ppb. Using a conversion factor of 5 ppb of blood per ppm of hair, that point of departure approximately corresponds to a BMD based on a hair Hg concentration of 17 ppm and a BMDL of 12 ppm. Those values are very close to the values estimated directly from the analysis based on hair Hg concentrations.
RECOMMENDATIONS
-
Until better statistical methods become available, risk assessment for MeHg should be based on benchmark dose calculations rather than NOAELs or LOAELs.
-
Given the available data, risk assessment should be based on the Boston Naming Test from the Faroe Islands study using MeHg measured in cord blood.
-
Despite some potential for PCB exposures to bias BMD estimates based on the Faroe Islands study, the committee recommends using estimates based on the full cohort and not adjusting for PCB exposure, mostly because the larger sample size is believed to result in more reliable estimates.
-
Benchmark doses should be based on the K-power model with K constrained to take a value of 1 or greater.
-
Because the integrative analysis is exploratory, it would be premature to recommend it for use now. However, the approach should
-
be considered in context of a weight-of-evidence argument. Further research on the use of integrative models for risk assessment would be useful.
-
Further research is generally needed on statistical issues related to risk assessment that is based on epidemiological data. In particular, further research to develop more appropriate methods for handling model uncertainty (e.g., the Bayesian technique of model averaging (Carlin and Louis 1998)) would be useful. Further work is also needed to develop risk assessment methods for a setting like MeHg where the study population contains no true controls.
REFERENCES
Allen, B.C., R.J. Kavlock, C.A. Kimmel, and E.M. Faustman. 1994. Dose-response assessment for developmental toxicity. II. Comparison of generic benchmark dose estimates with no observed adverse effect levels. Fundam. Appl. Toxicol. 23(4):487-95.
Bosch, R.J., D. Wypij, and L.M. Ryan. 1996. A semiparametric approach to risk assessment for quantitative outcomes . Risk Anal. 16(5):657-665.
Budtz-Jørgensen, E., N. Keiding, and P. Grandjean. 1999. Benchmark Modeling of the Faroese Methylmercury Data. Research Report 99/5. Prepared at the University of Copenhagen, Denmark for the U.S. Environmental Protection Agency.
Carlin, B.P., and T.A. Louis. 1998. Bayes and Emperical Bayes Methods for Data Analysis. New York: Chapman Hall.
Cohen, J. 1988. Statistical Power Analysis for the Behavioral Sciences, 2nd Ed. Hillsdale, NJ: Lawrence Erblaum Associates.
Crump, K.S. 1984. A new method for determining allowable daily intakes. Fundam. Appl. Toxicol. 4(5):854-871.
Crump, K.S. 1995. Calculation of benchmark doses from continuous data. Risk Anal. 15(1):79-89.
Crump, K.S., C. Van Landingham, C. Shamlaye, C. Cox, P.W. Davidson, G.J. Myers, and T.W. Clarkson. 2000. Benchmark dose concentrations for methylmercury obtained from the Seychelles Child Development Study. Environ. Health Perspect. 108:257-263.
Crump, K.S., T. Kjellström, A.M. Shipp, A. Silvers, and A. Stewart. 1998. Influence of prenatal mercury exposure upon scholastic and psychological test performance: Benchmark analysis of a New Zealand cohort. Risk Anal. 18(6):701-713.
Dominici, F., J.M. Samet, and S.L. Zeger. In press. Combining evidence on air
pollution and daily mortality from the 20 largest US cities: A hierarchical modelling strategy (with discussion). Royal Statistical Society: Series A.
EPA (U.S. Environmental Protection Agency). 1998. Guidelines for Neurotoxicity Risk Assessment. Fed. Regist. 63(93):26925-26954.
EPA (U.S. Environmental Protection Agency). 1999. Guidelines for Carcinogen Risk Assessment. Review Draft. NCEA-F-0644, Risk Assessment Forum, U.S. Environmental Protection Agency, Washington, DC, (July 1999). [Online]. Available: http://www.epa.gov/nceawww1/raf/crasab.htm
Gaylor, D.W. 1983. The use of safety factors for controlling risk. J. Toxicol. Environ. Health 11(3):329-36.
Gaylor, D.W., and W. Slikker. 1992. Risk assessment for neurotoxicants. Pp. 331-343 in Neurotoxicology, H. Tilson, and C. Mitchell, eds. New York: Raven Press.
Gilbert, S.G., T.M. Burbacher, and D.C. Rice. 1993. Effects of in utero methylmercury exposure on a spatial delayed alternation task in monkeys. Toxicol. Appl. Pharmacol. 123(1):130-6.
Grandjean, P., P. Weihe, P.J. Jørgensen, T. Clarkson, E. Cernichiari, and T. Viderø. 1992. Impact of maternal seafood diet on fetal exposure to mercury, selenium, and lead. Arch. Environ. Health 47(3):185-195.
Grandjean, P., P. Weihe, R.F. White, F. Debes, S. Araki, K. Yokoyama, K. Murata, N. Sørensen, R. Dahl, and P.J. Jørgensen. 1997. Cognitive deficit in 7-year-old children with prenatal exposure to methylmercury. Neurotoxicol. Teratol. 19(6):417-428.
Hedges, L.V., and I. Olkin. 1985. Statistical Methods for Meta-Analysis. Orlando, FL: Academic Press.
Kimmel, C.A. 1990. Quantitative approaches to human risk assessment for noncancer health effects. Neurotoxicology 11(2):189-98.
Kimmel, C.A., and D.W. Gaylor. 1988. Issues in qualitative and quantitative risk analysis for developmental toxicology. Risk Anal. 8(1):15-20.
Kjellström, T., P. Kennedy, S. Wallis, and C. Mantell. 1986. Physical and Mental Development of Children with Prenatal Exposure to Mercury from Fish. Stage I: Preliminary tests at age 4. National Swedish Environmental Protection Board Report 3080. Solna, Sweden.
Kodell, R.L., and R.W. West. 1993. Upper confidence limits on excess risk for quantitative responses . Risk Anal. 13(2):177-82.
Leisenring, W., and L. Ryan. 1992. Statistical properties of the NOAEL. Regul. Toxicol. Pharmacol. 15(2 Pt. 1):161-171.
Mitchell, J.W., T.E.U. Kjellström, and .L. Reeves. 1982. Mercury in takeaway fish in New Zealand. N. Z. Med. J. 95(702):112-4.
Rice, D.C. 1992. Effects of pre-plus postnatal exposure to methylmercury in the monkey on fixed interval and discrimination reversal performance. Neurotoxicology 13(2):443-452.
Rice, D.C. 1996. Sensory and cognitive effects of developmental methylmercury exposure in monkeys, and a comparison to effects of rodents. Neurotoxicology 17(1):139-154.
West, R.W., and R.L. Kodell. 1993. Statistical methods of risk assessment for continuous variables. Communications in Statistics: Theory and Methods 22(12):3363-3376.
Zar, J.H. 1998. Biostatistical Analysis, 4th Ed. Englewood Cliffs, NJ: Prentice-Hall.
Zelikoff, J.T., J.E. Bertin, T.M. Burbacher, E.S. Hunter, R.K. Miller, E.K. Silbergeld, S. Tabacova, and J.M. Rogers. 1995. Health risks associated with prenatal metal exposure. Fundam. Appl. Toxicol. 25(2):161-170.


