
6
Using the Tolerable Upper Intake Level for Nutrient Assessment of Groups
This chapter briefly describes the concepts underlying the development of the Tolerable Upper Intake Levels (ULs). It also provides guidance on the use of the UL in conjunction with the appropriate usual intake distribution to determine the proportion of individuals in a group who may be potentially at risk of adverse effects due to excessive intake of a nutrient.
THEORY AND DEFINITIONS
Just as quantitative guidelines are needed to help ensure adequacy of nutrient intake, guidelines are needed to help ensure that usual intake levels are not so high that they pose a risk of adverse health effects to an individual or group of individuals. The introduction of the Tolerable Upper Intake Level (UL) is a long overdue contribution to nutritional evaluation. Great effort has been taken in evaluating the published literature relevant to adverse health effects of overconsumption of specific nutrients. The UL is meant to inform the public of risk of excess nutrient intake—it is not a recommended intake level.
The UL is determined using a risk assessment model that was developed specifically for nutrients (IOM, 1998a). The model consists of a systematic series of scientific considerations and judgments made by experts knowledgeable in both the nutrients of interest and the practice of risk assessment. These ULs reflect the maximum daily intake levels at which no risk of adverse health effects is expected for almost all individuals in the general population—
including sensitive individuals—when the nutrient is consumed over long periods of time. In other words, the UL is the highest usual intake level of a nutrient that poses no risk of adverse effects. In some cases subpopulations with extreme and distinct vulnerabilities may be at risk with intakes at or even below the UL.1 The process used to set the UL considers the intakes from all sources: food, water, nutrient supplements, and pharmacological agents, although in some cases the UL may apply only to specific sources.
The dose-response assessment, which concludes with an estimate of the UL, is built upon three toxicological concepts commonly used in assessing the risk of exposures to chemical substances: no-observed-adverse-effect level (NOAEL), lowest-observed-adverse-effect level (LOAEL), and uncertainty factor (UF). These are defined as:
-
NOAEL is the highest continuing intake of a nutrient at which no adverse effects have been observed in the individuals or groups studied. In some cases it may be derived from experimental studies in animals. When the available data are not sufficient to reveal the NOAEL, it is necessary to rely on a LOAEL.
-
LOAEL is the lowest continuing intake at which an adverse effect has been identified. For some nutrients, it may be derived from experimental studies in animals.
-
UFs are applied to the NOAEL, and if necessary to the LOAEL, in an attempt to address both gaps in data and incomplete knowledge regarding the inferences required (e.g., the expected variability in response within the population, or extrapolation from experimental animal to human data).
Scientific judgments are used to assign UFs for each of the specific sources of uncertainty associated with the data available for a nutrient. A composite UF for that nutrient is derived by multiplying the assigned UFs. Larger UFs are applied when animal data are used rather than human data, and in instances where the consequence of overconsumption is serious disease. A UF used to estimate a UL from a LOAEL will be larger than one used if a NOAEL is available. UFs established when this document was written are presented in Table 6-1; they range from 1 (expressing great confidence in the NOAEL) to 36 (reflecting extrapolation from experimental animal to human data and from a LOAEL to a NOAEL and other limitations in the data).
|
1 |
In this case, the subpopulations are identified and discussed in the individual chapters of the DRI nutrient reports (IOM, 1997, 1998b, 2000). |
TABLE 6-1 Tolerable Upper Intake Levels, No-Observed-Adverse-Effect Levels, Lowest-Observed-Adverse-Effect Levels, Uncertainty Factors, and Critical Adverse Effects for Various Nutrients, by Life Stage Group
|
Nutrient |
ULa |
NOAELb |
LOAELc |
UFd |
Critical Adverse Effect |
|
Calcium (mg/d) |
Hypercalcemia and renal insufficiency (milk-alkali syndrome) |
||||
|
Infants (0–12 mo) |
NDe |
—f |
— |
— |
|
|
Toddlers (1–3 y) |
2,500g |
— |
— |
— |
|
|
Children (4–8 y) |
2,500g |
— |
— |
— |
|
|
Children (9–13 y) |
2,500g |
— |
— |
— |
|
|
Adolescents (14–18 y) |
2,500g |
— |
— |
— |
|
|
Adults (19–70 y) |
2,500 |
—h |
5,000 |
2 |
|
|
Pregnant women |
2,500 |
— |
— |
— |
|
|
Lactating women |
2,500 |
— |
— |
— |
|
|
Older adults (> 70 y) |
2,500 |
— |
— |
— |
|
|
Fluoride (mg/d) |
Moderate enamel fluorosisj |
||||
|
Infants (0–6 mo) |
0.7 |
— |
0.1i |
1 |
|
|
Infants (6–12 mo) |
0.9 |
— |
0.1i |
1 |
|
|
Children (1–3 y) |
1.3 |
— |
0.1i |
1 |
|
|
Children (4–8 y) |
2.2 |
— |
0.1i |
1 |
|
|
Children (9–13 y) |
10 |
10 |
— |
1 |
Skeletal fluorosis |
|
Adolescents (14–18 y) |
10 |
10 |
— |
1 |
|
|
Adults (19–70 y) |
10 |
10 |
— |
1 |
|
|
Pregnant women |
10 |
10 |
— |
1 |
|
|
Lactating women |
10 |
10 |
— |
1 |
|
|
Older adults (> 70 y) |
10 |
10 |
— |
1 |
|
|
Magnesiumk (mg/d) |
Diarrhea |
||||
|
Infants (0–12 mo) |
ND |
— |
— |
— |
|
|
Toddlers (1–3 y) |
65l |
— |
— |
— |
|
|
Children (4–8 y) |
110l |
— |
— |
— |
|
|
Children (9–13 y) |
350 |
— |
360 |
~1 |
|
|
Adolescents (14–18 y) |
350 |
— |
360 |
~1 |
|
|
Adults (19–70 y) |
350 |
— |
360 |
~1 |
|
|
Pregnant women |
350 |
— |
— |
— |
|
|
Lactating women |
350 |
— |
— |
— |
|
|
Older adults (> 70 y) |
350 |
— |
360 |
~1 |
|
TABLE 6-1 Continued
|
Nutrient |
ULa |
NOAELb |
LOAELc |
UFd |
Critical Adverse Effect |
|
Phosphorus (g/d) |
Hyperphosphatemia |
||||
|
Infants (0–12 mo) |
ND |
— |
— |
— |
|
|
Toddlers (1–3 y) |
3.0 |
10.2m |
— |
3.3 |
|
|
Children (4–8 y) |
3.0 |
10.2m |
— |
3.3 |
|
|
Children (9–13 y) |
4.0 |
10.2m |
— |
2.5 |
|
|
Adolescents (14–18 y) |
4.0 |
10.2m |
— |
2.5 |
|
|
Adults (19–70 y) |
4.0 |
10.2 |
— |
2.5 |
|
|
Pregnant women |
3.5 |
— |
— |
— |
|
|
Lactating women |
4.0 |
10.2 |
— |
2.5 |
|
|
Older adults (> 70 y) |
3.0 |
10.2 |
— |
3.3 |
|
|
Selenium (μg/d) |
Selenosis |
||||
|
Infants (0–6 mo) |
45n |
7 μg/kg |
— |
1 |
|
|
Infants (7–12 mo) |
60n |
— |
— |
— |
|
|
Children (1–3 y) |
— |
— |
— |
||
|
Children (4–8 y) |
— |
— |
— |
||
|
Children (9–13 y) |
— |
— |
— |
||
|
Adolescents (14–18 y) |
400 |
— |
— |
— |
|
|
Adults (19–70 y) |
400 |
800 |
2 |
||
|
Pregnant women |
400 |
— |
— |
— |
|
|
Lactating women |
400 |
— |
— |
— |
|
|
Older adults (> 70 y) |
4001 |
— |
— |
— |
|
|
Increased tendency to hemorrhage seen in rats |
|||||
|
Infants (0–12 mo) |
ND |
— |
— |
— |
|
|
Children (1–3 y) |
— |
— |
— |
||
|
Children (4–8 y) |
— |
— |
— |
||
|
Children (9–13 y) |
— |
— |
— |
||
|
Adolescents (14–18 y) |
— |
— |
— |
||
|
Adults (19–70 y) |
1,000n |
— |
500 mg/kg |
36 |
|
|
Pregnant women |
1,000n |
— |
— |
— |
|
|
Lactating women |
1,000n |
— |
— |
— |
|
|
Older adults (> 70 y) |
1,000n |
— |
— |
— |
|
|
Choline (g/d) |
Hypotension fishy body odor |
||||
|
Infants (0–12 mo) |
ND |
— |
— |
— |
|
|
Children (1–3 y) |
— |
— |
— |
||
|
Children (4–8 y) |
— |
— |
— |
||
|
Children (9–13 y) |
— |
— |
— |
||
|
Adolescents (14 –18 y) |
— |
— |
— |
||
TABLE 6-1 Continued
|
Nutrient |
ULa |
NOAELb |
LOAELc |
UFd |
Critical Adverse Effect |
|
Adults (19–70 y) |
3.5n |
— |
7.5 |
2 |
|
|
Pregnant women |
3.5n |
— |
— |
— |
|
|
Lactating women |
3.5n |
— |
— |
— |
|
|
Older adults (> 70 y) |
3.5n |
— |
— |
— |
|
|
Folatek (μg/d) |
Precipitation or exacerbation of neuropathy in vitamin B12 deficient- individuals |
||||
|
Infants (0–2 mo) |
ND |
— |
— |
— |
|
|
Toddlers (1–3 y) |
— |
— |
— |
||
|
Children (4–8 y) |
— |
— |
— |
||
|
Children (9–13 y) |
— |
— |
— |
||
|
Adolescents (14–18 y) |
— |
— |
— |
||
|
Adults (19–70 y) |
1,000 |
— |
5,000 |
5 |
|
|
Pregnant women |
1,000 |
— |
— |
— |
|
|
Lactating women |
1,000 |
— |
— |
— |
|
|
Older adults (> 70 y) |
1,000 |
— |
5,000 |
5 |
|
|
Niacink (mg/d) |
Vasodilation (flushing; can involve burning, tingling, and itching sensation, as well as reddened skin; occasionally accompanied by pain) |
||||
|
Infants (0–12 mo) |
ND |
— |
— |
— |
|
|
Toddlers (1–3 y) |
— |
— |
— |
||
|
Children (4–8 y) |
— |
— |
— |
||
|
Children (9–13 y) |
— |
— |
— |
||
|
Adolescents (14–18 y) |
— |
— |
— |
||
|
Adults (19–70 y) |
35 |
— |
50 |
1.5 |
|
|
Pregnant women |
35 |
— |
— |
— |
|
|
Lactating women |
35 |
— |
— |
— |
|
|
Older adults (> 70 y) |
35 |
— |
— |
— |
|
|
Vitamin B6 (mg/d) |
Sensory neuropathy |
||||
|
Infants (0–12 mo) |
ND |
— |
— |
— |
|
|
Toddlers (1–3 y) |
— |
— |
— |
||
|
Children (4–8 y) |
— |
— |
— |
||
|
Children (9–13 y) |
— |
— |
— |
||
|
Adolescents (14–18 y) |
— |
— |
— |
||
|
Adults (19–70 y) |
100 |
200 |
— |
2 |
|
|
Pregnant women |
100 |
— |
— |
— |
|
|
Lactating women |
100 |
— |
— |
— |
|
|
Older adults (> 70 y) |
100 |
— |
— |
— |
|
TABLE 6-1 Continued
|
Nutrient |
ULa |
NOAELb |
LOAELc |
UFd |
Critical Adverse Effect |
|
Vitamin C (mg/d) |
Osmotic diarrhea and Gastrointestinal disturbances |
||||
|
Infants (0–12 mo) |
ND |
— |
— |
— |
|
|
Children (1–3 y) |
— |
— |
— |
||
|
Children (4–8 y) |
— |
— |
— |
||
|
Children (9–13 y) |
— |
— |
— |
||
|
Adolescents (14–18 y) |
— |
— |
— |
||
|
Adults (19–70 y) |
2,000 |
— |
3,000 |
1.5 |
|
|
Pregnant women |
2,000 |
— |
— |
— |
|
|
Lactating women |
2,000 |
— |
— |
— |
|
|
Older adults (> 70 y) |
2,000 |
— |
— |
— |
|
|
Vitamin D (μg/d)p |
Hypercalcemia |
||||
|
Infants (0–12 mo) |
25 |
45 |
— |
1.8 |
|
|
Toddlers (1–3 y) |
50g |
— |
— |
— |
|
|
Children (4–8 y) |
50g |
— |
— |
— |
|
|
Children (9–13 y) |
50g |
— |
— |
— |
|
|
Adolescents (14–18 y) |
50g |
— |
— |
— |
|
|
Adults (19–70 y) |
50 |
— |
— |
— |
|
|
Pregnant women |
50 |
60 |
— |
1.2 |
|
|
Lactating women |
50 |
— |
— |
— |
|
|
Older Adults (> 70 y) |
50 |
— |
— |
— |
|
|
a UL = Tolerable Upper Intake Level: The highest level of daily nutrient intake that is likely to pose no risk of adverse health effects to almost all individuals in the general population. Unless otherwise specified, the UL represents total intake from food, water, and supplements. Because of lack of suitable data, ULs could not be established for thiamin, riboflavin, vitamin B12, pantothenic acid, biotin, or any carotenoids. This signifies a need for data. It does not necessarily signify that people can tolerate chronic intakes of these vitamins at levels exceeding the RDA or AI. b NOAEL = no-observed-adverse-effect level: the highest intake (or experimental oral dose) of a nutrient at which no adverse effects have been observed in the individuals studied. c LOAEL = lowest-observed-adverse-effect level: the lowest intake (or experimental oral dose) at which an adverse effect has been identified. |
|||||
|
d UF = uncertainty factor: a number that is applied to the NOAEL (or LOAEL) to obtain the UL. The UF incorporates uncertainties associated with extrapolating from the observed data to the general population. UFs established at the time this document was written, some of which are presented in this table, range from 1 (expressing great confidence in the NOAEL) to 36 (reflecting extrapolation from animal to human data and significant limitations in the data). e ND = not determined or identified. Except for vitamin D, selenium, and fluoride, ULs could not be established for infants. Because of the unique nutritional needs and toxicological sensitivity of infants (0–12 mo), the UL for adults was not adjusted on a body-weight basis to derive a UL for infants (as was done for children and adolescents). f No data available to identify NOAELs or LOAELs. g Increased rates of bone formation in toddlers, children, and adolescents suggest the adult UL is appropriate for these age groups. h A solid value for the NOAEL is not available; however, researchers have observed that daily calcium intakes of 1,500 to 2,400 mg did not result in hypercalcemic syndromes. i In mg/kg/day. j Moderate and severe forms of enamel fluorosis are characterized by esthetically objectionable changes in tooth color and surface irregularities. This is regarded as a cosmetic effect rather than a functional adverse effect. k UL represents intake from supplements, food fortificants, and pharmacological agents only and does not include intake from food and water. l The UL value for adults was adjusted on a body-weight basis to estimate the UL for children. m The NOAEL of 10.2 g/d for adults was used to set ULs for all other life stage groups except for pregnant women. The UL for pregnant women was set by decreasing the UL for adults by 15 percent. n UL values have been rounded. o The UL for α-tocopherol applies to any form of α-tocopherol. p As cholecalciferol. 1 μg cholecalciferol = 40 IU vitamin D. SOURCES: IOM (1997, 1998b, 2000). |
UFs greater than 100 may be required for some nutrients in future evaluations, particularly if data on humans are not available, great uncertainties are found in the dose-response curve, and the adverse effect is not reversible. At a UF of 1, the NOAEL equals the UL.
Information used to establish ULs is summarized in Table 6-1. Readers are referred to the report Dietary Reference Intakes: A Risk Assessment Model for Establishing Upper Intake Levels for Nutrients (IOM, 1998a) and the individual nutrient reports (IOM, 1997, 1998b, 2000) for additional information.
EVALUATING THE RISK OF ADVERSE EFFECTS USING THE UL
How to Use ULs
Because the actual risk curve (probability of adverse effect at each level of intake) is unknown, it is not possible to determine the actual risk (likelihood) of adverse health effects for each individual in the general population. Until more research is done in this area, the UL is meant to be used as a guidepost for potential adverse effects and to help ensure that individual intakes do not exceed a safe intake or do so only rarely.
The procedure for applying the UL in assessing the proportion of individuals in a group who are potentially at risk of adverse health effects from excess nutrient intake is similar to the EAR cut-point method described earlier (Chapter 4) for assessing nutrient inadequacy. In this case, one simply determines the proportion of the group with intakes above the UL. However, because the ULs for nutrients are based on different sources of intake, one must be careful to use the appropriate usual intake distribution in the assessment.
|
Box 6-1 Factors to consider when assessing the risk of high intakes:
|
For some nutrients (e.g., fluoride, phosphorus, vitamin C) the distribution of usual intake would need to include intake from all sources, while for others (e.g., magnesium, folate, niacin, vitamin E) only the distribution of usual supplement intake would be needed.
Figure 6-1 provides a hypothetical example of the relationship between population median intakes and the risk function for intakes at all levels. It can be seen that the percentage of the population at risk would differ depending on the steepness of the risk function. As noted above, however, the risk function (the dose-response curve) for all nutrients is unknown.
Figure 6-2 illustrates a distribution of usual nutrient intakes in a population; the proportion of the population with usual intakes above the UL represents the potential at-risk group. An evaluation of the public health significance of the risk to the population consuming a nutrient in excess of the UL would be required to determine if action was needed.
If no discernible portion of the population consumes the nutrient in excess of the UL, no public health risk should exist. However, if
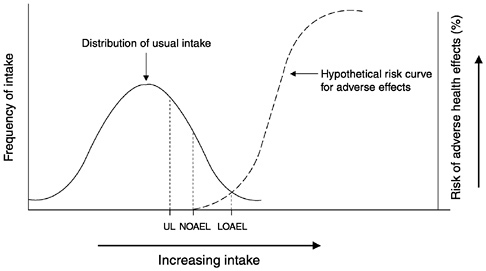
FIGURE 6-1 Hypothetical example of risk of adverse effects compared to population intake. The fraction of the population having usual nutrient intakes above the Tolerable Upper Intake Level (UL) is potentially at risk; the probability of adverse effects increases as nutrient intakes increase above the UL, although the true risk function is not known for most nutrients. NOAEL = no-observed-adverse-effect level, LOAEL = lowest-observed-adverse-effect level.
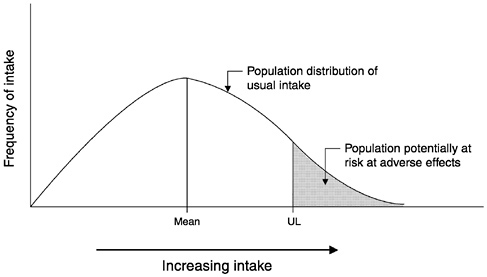
FIGURE 6-2 Population potentially at risk from excessive nutrient intakes. The fraction of the population consistently consuming a nutrient at intake levels in excess of the Tolerable Upper Intake Level (UL) is potentially at risk of adverse health effects. Additional information is necessary to judge the significance of the risk.
some portion of the population has intakes above the UL, a risk may exist and the need to take action to reduce population intakes should be evaluated. For example, the UL for niacin for adults is 35 mg/day. The LOAEL for niacin is 50 mg/day and the uncertainty factor is 1.5 (indicating a good level of confidence in the data). The adverse effect noted is a relatively benign vasodilation causing flushing of the skin that may be accompanied by a burning, itching, or tingling sensation; this effect is readily reversible by a reduction in intake. The UL for vitamin B6 is 100 mg/day for adults and the NOAEL is 200 mg/day with a UF of 2. The adverse effect observed—sensory neuropathy—is a serious and irreversible condition. Therefore, public health concern over a segment of the population routinely consuming niacin in excess of the UL would not be as great as if a segment of the population were routinely consuming vitamin B6 in excess of the UL.
Figure 6-3 illustrates a situation in which usual dietary intake from foods represents no discernible risk but the addition of intakes from supplement usage makes a fraction of the population potentially at risk. Figure 6-4 represents the type of analysis that would apply when
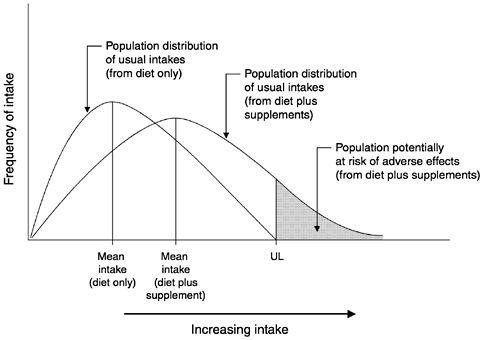
FIGURE 6-3 Effect of including supplement intakes on the population potentially at risk. In this case, nutrient intakes from diet alone are risk-free, but intakes from supplement plus diet put a fraction of the population at risk. The Tolerable Upper Intake Level (UL) here applies to all sources of intake. The significance of the risk is judged by consideration of additional factors.
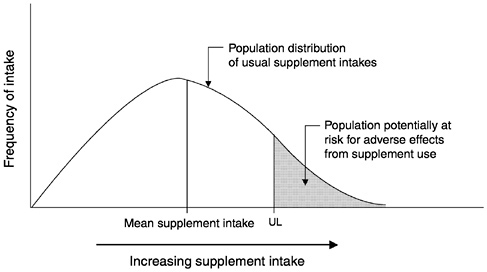
FIGURE 6-4 Risk analysis when the Tolerable Upper Intake Level (UL) applies only to supplements. The significance of the risk is judged by consideration of additional factors.
the data reveal that only supplement usage poses a risk (the UL applies only to the supplement); in this case only the supplement intake distribution requires analysis. For example, for nutrients such as magnesium, folate, niacin, and vitamin E no information exists on adverse effects occurring from the nutrient when consumption is from foods; adverse effects have been seen only when the nutrient was consumed as a supplement, as a fortificant added to food (e.g., folate), or in over-the-counter medications (e.g., magnesium in antacids). In each of these cases the significance of the risk requires consideration of more than the fraction of the population that exceeds the UL. Currently, population usual intake distributions can be estimated, but the shape of the UL risk curve is unknown. When this information is available, however, the probability approach, as described in Chapter 4, can be used to assess the proportion of the population potentially at risk of adverse effects. The underlying assumption is that there is a threshold below which there is negligible risk from overconsumption and above which dose-response curves for toxicological assessment can be linear, exponential, or some other shape.
Although members of the general population should be advised not to routinely exceed the UL, intake above the UL may be appropriate for investigation within well-controlled clinical trials. Clinical trials of doses above the UL should not be discouraged as long as subjects participating in these trials have signed informed consent documents regarding possible adverse effects, and as long as these trials employ appropriate safety monitoring of trial subjects. In addition, the UL is not meant to apply to individuals who are receiving a high dose of a nutrient under medical supervision.
The UL is typically derived to apply to the most sensitive members of the general population. For this reason, many members of the population may regularly consume nutrients at or even somewhat above the UL without experiencing adverse effects. However, because there is no way to establish which individuals are the most sensitive, it is necessary to interpret the UL as applying to all individuals.
Supplement Use
The need for ULs derives largely from regular, self-prescribed use of large amounts of highly fortified foods, regular consumption of a large number of moderately fortified foods, or nonfood sources such as nutritional supplements, or any combination of the three, by significant proportions of the population. Few nutrients are consumed through the food supply in amounts that could cause toxicity.
When this does occur it may be due to composition of the soil, extremely unusual food choices, or errors during food fortification.
The use of nutrient supplements is growing in the United States and Canada, with reports from the Third National Health and Nutrition Examination Survey (NHANES III) suggesting that half the population is using nutritional supplements. Although this information is not sufficiently quantitative for estimations of population intakes, it is known that in some population subgroups nutrient intakes exceed the UL. Supplements should not be treated casually even though excessive intakes appear to be harmless because they are excreted or do not incur a toxic response. It is important to remember that the ULs are based on chronic exposures. The amounts of a nutrient considered toxic upon acute exposure are generally considerably higher than the UL, but have not been established for many nutrients.
SOME FREQUENTLY ASKED QUESTIONS
|
How serious is the risk of adverse effects for individuals chronically consuming nutrients at levels greater than the Tolerable Upper Intake Level (UL)? The critical adverse effects used to set the UL are listed in Table 6-1. The dose, the seriousness of the adverse effects, and the extent to which the effects are reversible upon intake reduction should be considered in evaluating the risk of adverse effects. If the mean intake of a population equals the UL, is there no risk? A population mean intake at the UL suggests that a large proportion (as much as half) of the population is consuming levels above the UL. This would represent a very serious population risk of adverse effects. How different are the ULs from doses that would confer acute toxicity? The ULs are the maximum levels that can be consumed daily on a chronic basis without adverse effects. The ULs will generally be much lower than the levels that are necessary to produce adverse effects after a single exposure. Few evaluations of the acute toxic intake of nutrients have been made. |
|
How close are the Recommended Dietary Allowances (RDAs) and ULs? There is no standard or definable mathematical relationship between the RDA and the UL. For some nutrients, the two values are widely separated (for example, the RDA for vitamin B6 for adult women is 1.3 mg/day, whereas the UL is 100 mg/day). In some cases the two standards cannot be compared directly because the UL is to be applied only to sources of the nutrient that are not naturally in foods (e.g., the UL for magnesium is only for intake from supplements). Will we find out in a few years that the RDA and Adequate Intake (AI) are too low and that higher nutrient intakes are better to prevent specific diseases such as cancer? As our ability to study the chronic effects of various levels of nutrient intakes on humans improves, our knowledge of the relationships between single nutrients and disease prevention will improve. As a result, suggested desirable intake may increase or decrease. Higher nutrient intakes may not be found to be better. In some clinical intervention trials, high doses of β-carotene being studied for cancer prevention were reported to actually increase the risk of lung cancer in long-term current smokers. This demonstrates that it is difficult to speculate about even the direction of an effect when an individual consumes high doses of a nutrient (those that greatly exceed the amounts found in foods). |


