
D
Assessing the Performance of the EAR Cut-Point Method for Estimating Prevalence
This appendix presents the results of preliminary computer simulations evaluating the performance of the Estimated Average Requirement (EAR) cut-point method for estimating the prevalence of nutrient inadequacy. The simulations provide information on the performance of this model when its key assumptions are violated.
INTRODUCTION
In Chapter 4, an approach to estimating the prevalence of inadequate intakes in a group, called the Estimated Average Requirement (EAR) cut-point method, was introduced. This method is a short-cut of the probability approach for assessing nutrient inadequacy that was proposed by the National Research Council (NRC, 1986), and discussed in Appendix C of this report.
As stated in Chapter 4, the EAR cut-point method produces reliable estimates of the proportion of individuals in a group whose usual intakes do not meet their requirements, as long as the following assumptions hold:
-
intakes and requirements of the nutrient are independent;
-
the distribution of requirements in the group is symmetrical about the EAR; and
-
the variance of the distribution of requirements is smaller than the variance of the distribution of usual intakes.
A reliable estimate of the distribution of usual intakes in the group
is also needed in order to estimate the prevalence of inadequacy.
In addition, it was stated that the estimates of inadequacy would be essentially unbiased when the actual prevalence of inadequacy in the group is close to 50 percent. As the true prevalence approaches 0 or 100 percent, the performance of the EAR cut-point method declines, even if the conditions listed above are met.
To test the EAR cut-point method, some preliminary simulation studies were performed. The reliability of this method of estimating the prevalence of inadequacy was evaluated in cases where the assumptions above were met, and also in cases in which one or more of the assumptions were violated. For example, the EAR cut-point method was used to evaluate groups in which (1) intakes and requirements were correlated (for example, food energy), (2) the standard deviation of requirements (SDr) was larger than the standard deviation of usual intakes (SDi), and (3) the distribution of requirements was skewed (as is the case of iron in menstruating women).
This appendix does not test the performance of the probability approach. The probability approach, by construction, will perform well whenever intakes and requirements are independent, and whenever the form of the distribution of requirements is known. As in the EAR cut-point method, a reliable estimate of the distribution of usual intakes in the group must be available to ensure an unbiased estimate of the prevalence of inadequacy in the group.
Results of the simulation studies are reported in three sections. The first section examines the impact of violating the independence assumption on the estimates of prevalence. In the second section, the robustness of the EAR cut-point method to departures from the assumption of small SDr relative to SDi is tested. Finally, in the third section, the effects of departures from the assumption of a symmetrical requirement distribution are considered. In each section, a description of how the simulations were run is followed by a summary of the major findings. The simulation studies presented are preliminary and by no means definitive. They are intended to provide initial insight into the performance of this short-cut of the probability approach for estimating inadequacy. It is hoped that this report will encourage other researchers to proceed from the information presented here and conduct further research on this important topic.
INTAKES AND REQUIREMENTS ARE CORRELATED
The impact of violating the assumption of independence between intakes and requirements was evaluated by estimating prevalence of
inadequacy in a group in which the correlation varied from 0 through 1. The intakes and requirements for the group were generated from a bivariate normal distribution in which the mean and standard deviation of usual intake were fixed at 90 and 30 units, respectively. Several cases were considered for the distribution of requirements. The Estimated Average Requirement (EAR) was fixed at three values: 55, 70, and 90 units, and the SDr was also set at three values: 7.5, 15, and 30 units. Thus, the effect of increasing the correlation between intake and requirement for nine different scenarios for the joint distribution of intakes and requirements was investigated. It is important to point out that neither the probability approach nor its shortcut, the EAR cut-point method require that the distribution of usual intakes in the group be normal. The performance of either method does not depend in any way on the shape of the distribution of usual intakes in the group. Intakes from a normal distribution were generated only for convenience.
In each case, the true prevalence was obtained as the proportion of individuals whose usual intakes were below their requirements for the nutrient in a population of 50,000. From this population, smaller groups of 2,000 were sampled 200 times. The estimated prevalence was obtained as the proportion of individuals whose usual intakes were below the corresponding EAR (i.e., by application of the EAR cut-point method) in each of the 200 groups. The estimates of prevalence presented here are the means, over the 200 replicates, of the estimates of prevalence in each of the groups.
In Figure D-1, Figure D-2, Figure D-3, Figure D-4, Figure D-5, Figure D-6, Figure D-7, Figure D-8 through Figure D-9, the solid lines and dots represent the true prevalence at each value of the correlation between intakes and requirements. The dashed lines and squares represent the average estimates of prevalence (over the 200 replicates) at each correlation value between intakes and requirements.
|
Box D-1 Major findings—Intakes and requirements are correlated
|
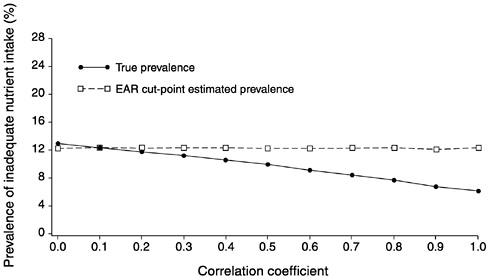
FIGURE D-1 The effect of correlation between usual intake and requirement on the prevalence of inadequate intakes estimated using the Estimated Average Requirement (EAR) cut-point method for 10 values of the correlation. For all correlations, mean intake = 90, standard deviation (SD) of intake = 30, EAR = 55, and SD of requirement = 7.5 units.
NOTE: When the SD of requirement is small relative to the SD of intake, there is no serious bias of the EAR cut-point method until correlation reaches 0.5 to 0.6.
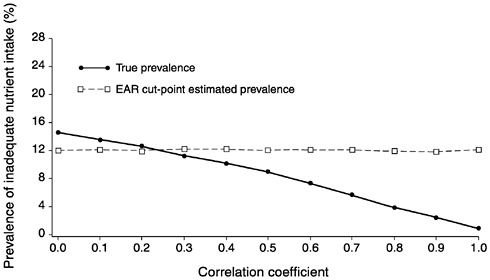
FIGURE D-2 The effect of correlation between usual intake and requirement on the prevalence of inadequate intakes estimated using the Estimated Average Requirement (EAR) cut-point method for 10 values of the correlation. For all correlations, mean intake = 90, standard deviation (SD) of intake = 30, EAR = 55, and SD of requirement = 15 units.
NOTE: When the SD of requirement increases relative to the SD of intake, increasing the correlation between intake and requirements can result in noticeable bias of the EAR cut-point method even when the correlation is as low as 0.4.
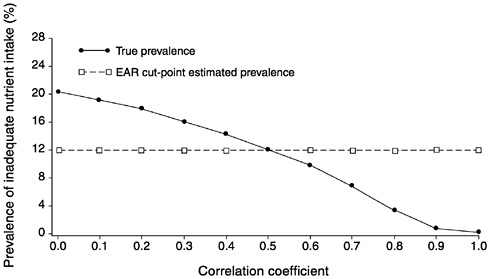
FIGURE D-3 The effect of correlation between usual intake and requirement on the prevalence of inadequate intakes estimated using the Estimated Average Requirement (EAR) cut-point method for 10 values of the correlation. For all correlations, mean intake = 90, standard deviation (SD) of intake = 30, EAR = 55, and SD of requirement = 30 units.
NOTE: When the SD of requirement is as large as the SD of intake, the estimate of prevalence of inadequate intakes using the EAR cut-point method shows significant bias even when the correlation between intake and requirement is zero.
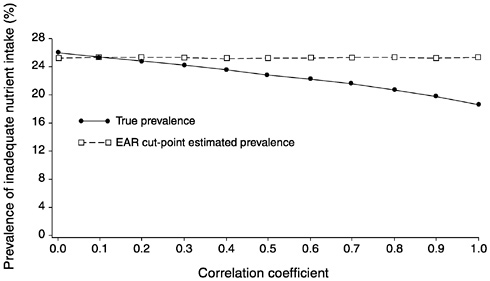
FIGURE D-4 The effect of correlation between usual intake and requirement on the prevalence of inadequate intakes estimated using the Estimated Average Requirement (EAR) cut-point method for 10 values of the correlation. For all correlations, mean intake = 90, standard deviation (SD) of intake = 30, EAR = 70, and SD of requirement = 7.5 units.
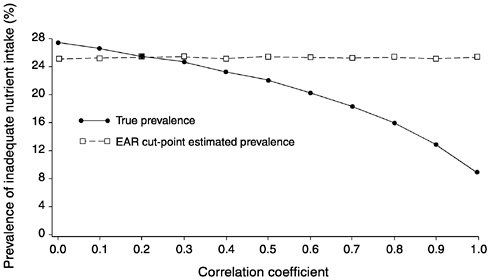
FIGURE D-5 The effect of correlation between usual intake and requirement on the prevalence of inadequate intakes estimated using the Estimated Average Requirement (EAR) cut-point method for 10 values of the correlation. For all correlations, mean intake = 90, standard deviation (SD) of intake = 30, EAR = 70, and SD of requirement = 15 units.
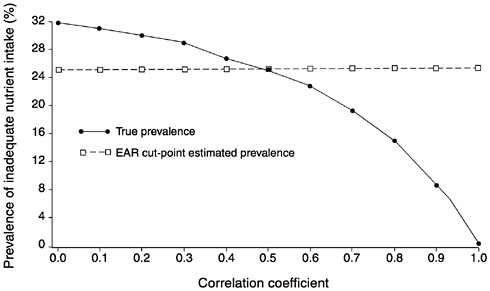
FIGURE D-6 The effect of correlation between usual intake and requirement on the prevalence of inadequate intakes estimated using the Estimated Average Requirement (EAR) cut-point method for 10 values of the correlation. For all correlations, mean intake = 90, standard deviation (SD) of intake = 30, EAR = 70, and SD of requirement = 30 units.

FIGURE D-7 The effect of correlation between usual intake and requirement on the prevalence of inadequate intakes estimated using the Estimated Average Requirement (EAR) cut-point method for 10 values of the correlation. For all correlations, mean intake = 90, standard deviation (SD) of intake = 30, EAR = 90, and SD of requirement = 7.5 units.
NOTE: When mean intake is equal to the EAR (prevalence of inadequate intakes is 50 percent), increasing the correlation between intake and requirement introduces no bias in the prevalence estimate using the EAR cut-point method.
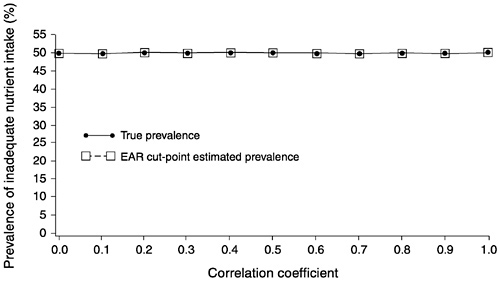
FIGURE D-8 The effect of correlation between usual intake and requirement on the prevalence of inadequate intakes estimated using the Estimated Average Requirement (EAR) cut-point method for 10 values of the correlation. For all correlations, mean intake = 90, standard deviation (SD) of intake = 30, EAR = 90, and SD of requirement = 15 units.

FIGURE D-9 The effect of correlation between usual intake and requirement on the prevalence of inadequate intakes estimated using the Estimated Average Requirement (EAR) cut-point method for 10 values of the correlation. For all correlations, mean intake = 90, standard deviation (SD) of intake = 30, EAR = 90, and SD of requirement = 30 units.
NOTE: When mean intake is equal to the EAR (prevalence of inadequate intakes is 50 percent), a variance of requirement as large as the variance of intake introduces no bias in the prevalence estimate using the EAR cut-point method.
Figure D-10, Figure D-11, and Figure D-12 show the bias of the prevalence estimates obtained from application of the EAR cut-point method relative to the true prevalence. The bias is calculated as the difference between the average prevalence estimate over the 200 replicates, and the true prevalence in the group. These three figures summarize the results presented in Figure D-1, Figure D-2, Figure D-3, Figure D-4, Figure D-5, Figure D-6, Figure D-7, Figure D-8 through Figure D-9.
In Figure D-10 the solid line and dots represents the bias in the estimated prevalence at various levels of the correlation between intakes and requirements for the case where the EAR is 55 units and the SDr is 7.5. The dotted line and squares represents the bias of the EAR cut-point prevalence estimate when the SDr is increased to 15 units. Finally, the dashed line and stars shows the amount of bias in the EAR cut-point prevalence estimates when the SDr is equal to the SDi of 30 units. Notice that when SDr is small, the bias in the prevalence estimate is small, even at very high values of the correlation
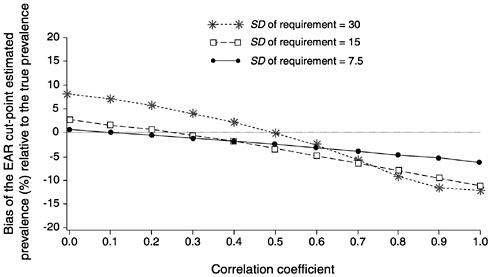
FIGURE D-10 The effect of correlation between intake and requirements for 10 values of the correlation on the bias of the estimated prevalence using the Estimated Average Requirement (EAR) cut-point method. For all correlations, mean intake = 90, standared deviation (SD) of intake = 30, and EAR = 55. The SD of requirement was set to 7.5 units (solid line with dots), 15 units (dashed lines with squares), and 30 units (dotted line with starts).
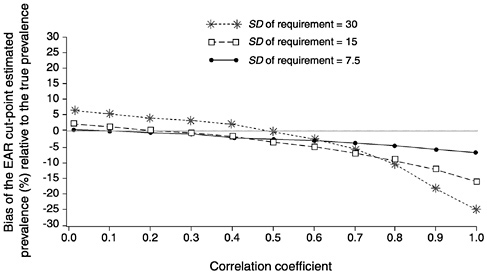
FIGURE D-11 The effect of correlation between intakes and requirements on the bias of the estimated prevalence using the Estimated Average Requirement (EAR) cut-point method for 10 values of the correlation. For all correlations, mean intake = 90, standared deviation (SD) of intake = 30, and EAR = 70. The SD of requirement was set to 7.5 units (solid line with dots), 15 units (dashed lines with squares), and 30 units (dotted line with starts).
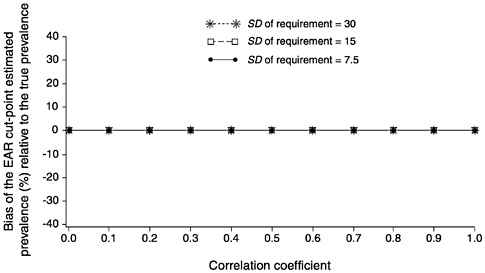
FIGURE D-12 The effect of correlation between intakes and requirements on the bias of the estimated prevalence using the Estimated Average Requirement (EAR) cut-point method for 10 values of the correlation. For all correlations, mean intake = 90, standard deviation (SD) of intake = 30, and EAR = 90. The SD of requirement was set to 7.5 units (solid line with dots), 15 units (dashed lines with squares), and 30 units (dotted line with stars).
NOTE: When the true prevalence of inadequacy is 50 percent (mean intake equals the EAR) neither increasing the correlation between intake and requirement or increasing the SD of requirement relative to the SD of intake introduces any bias of the prevalence estimate.
coefficient. The bias at any level of correlation increases as the SDr becomes larger relative to the SDi.
Figure D-11 shows the effect of increasing the correlation between intakes and requirements, and at the same time changing the relative size of the SDr when the EAR is equal to 70. In these cases, the true prevalence of inadequacy in the population is higher, as the EAR is now closer to the mean intake. Again, increasing SDr appears to have a stronger effect on the bias of the prevalence estimator than does increasing the correlation between intakes and requirements.
Finally, Figure D-12 shows that when true prevalence is equal to 50 percent, neither increasing the correlation between intake and requirement nor increasing the relative size of SDr has any effect on the bias of the prevalence estimate. The EAR cut-point method produces a correct prevalence estimate at any correlation level and for any value of the SDr relative to the SDi.
In summary, violating the independence assumption (i.e., a non-zero correlation) is likely to produce relatively minor biases on the estimates of prevalence obtained from applying the EAR cut-point method as long as the correlation between intakes and requirements does not exceed 0.5 or 0.6; the SDr is substantially smaller than the SDi; and the true prevalence is neither very small nor very large. The use of the EAR cut-point method (or the probability approach) is not recommended for investigating the adequacy of energy intakes in any group because for food energy the correlation between intakes and requirements is known to be very high.
VARIANCE OF REQUIREMENTS IS LARGE RELATIVE TO VARIANCE OF INTAKES
To test the effect of violating the assumption that variance of requirements must be substantially smaller than variance of intakes for good performance of the Estimated Average Requirement (EAR) cut-point method, various scenarios were considered. Mean intake was fixed at 90 units and SDi at 30 units, as before, and 0.01 and 0.7 were chosen for the correlation between intakes and requirements. The EAR was fixed at three different values: 55, 70, and 90 units. For each of the six different scenarios, the SDr varied from a low value of 0 to a high value of 40 units, in 5 unit increments.
Again, for each case, a large population was generated, and groups of 2,000 individuals were sampled 200 times. The prevalence estimates shown in each case are obtained as the average over the 200 replicates.
|
Box D-2 Major findings—Variance of requirement relative to variance of intake
|
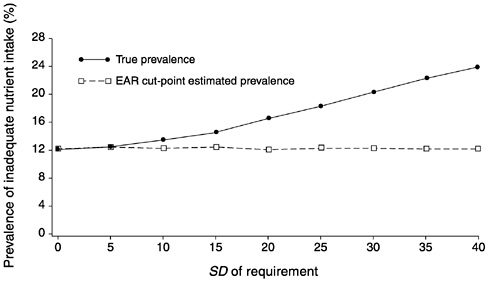
FIGURE D-13 Effect of the standard deviation of requirement (SDr) on the estimated prevalence of inadequate intakes using the Estimated Average Requirement (EAR) cut-point method for 10 values of the SDr. For all values of the SDr, mean intake = 90, SD of intake = 30, EAR = 55, and correlation between intake and requirement = 0.01.
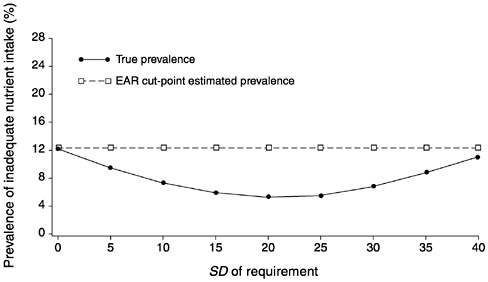
FIGURE D-14 Effect of the standard deviation of requirement (SDr) on the estimated prevalence of inadequate intakes using the Estimated Average Requirement (EAR) cut-point method for 10 values of the SDr. For all values of the SDr, mean intake = 90, SD of intake = 30, EAR = 55, and correlation between intake and requirement = 0.7.
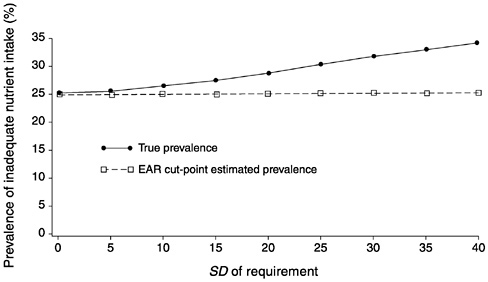
FIGURE D-15 Effect of the standard deviation of requirement (SDr) on the estimated prevalence of inadequate intakes using the Estimated Average Requirement (EAR) cut-point method for 10 values of the SDr. For all values of the SDr, mean intake = 90, SD of intake = 30, EAR = 70, and correlation between intake and requirement = 0.01.
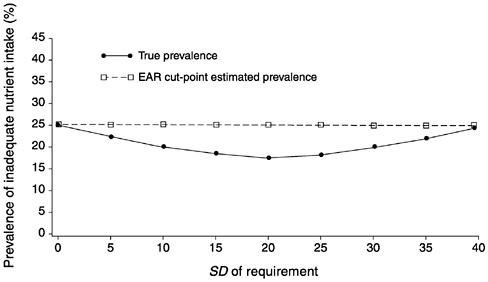
FIGURE D-16 Effect of the standard deviation of requirement (SDr) on the estimated prevalence of inadequate intakes using the Estimated Average Requirement (EAR) cut-point method for 10 values of the SDr. For all values of the SDr, mean intake = 90, SD of intake = 30, EAR = 70, and correlation between intake and requirement = 0.7.
Figure D-17 and Figure D-18 summarize the information presented in Figure D-13, Figure D-14, Figure D-15 through Figure D-16. In Figure D-17, the three curves represent the bias of the prevalence estimate relative to the true prevalence for three values of the EAR and when the correlation between intakes and requirements is close to 0. The solid line with dots shows the expected bias when the EAR is 55 units for varying values of the SDr. The dotted line with stars corresponds to the bias at varying values of SDr when the EAR is 70. Finally, the dashed line with squares indicates the expected bias when the EAR is equal to the mean intake and the true prevalence is 50 percent. Notice that when SDr is high relative to SDi, the bias in the estimated prevalence can be substantial. Consider for example, the case where the EAR is 55 and the SDr is 40. The bias in the estimated prevalence is approximately 11 percent. This might not seem significant until one recalls that for an SDr of 30 and an EAR of 55, the true prevalence in the group is approximately 20 percent (see Figure D-l). Thus, the bias in the estimate of prevalence corresponds to a full 50 percent of the true prevalence in the population.
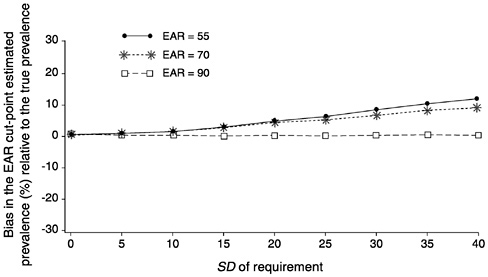
FIGURE D-17 Effect of the standard deviation of requirement (SDr) on bias of the estimated prevalence of inadequate intakes using the Estimated Average Requirement (EAR) cut-point method for 10 values of the SDr For all values of the SDr, mean intake = 90, SD of intake = 30, and correlation between intake and requirement = 0.01. The EAR was set at 55 units (solid line with dots), 70 units (dotted line with stars) and 90 units (dashed line with squares).
In Figure D-18, again the three curves represent the three different values of the EAR, but now the correlation between intakes and requirements was fixed at 0.7. Referring back to Figure D-14 and Figure D-16, one can see that as the value of SDr increases, the true prevalence first decreases and then increases. This is a result of the pattern of overlapping the requirements and intake distributions. The biases in the estimates of prevalence shown in Figure D-18 follow the same pattern. It is important to notice that the EAR cut-point estimate of prevalence does not track the changes in true prevalence as the SDr varies, and thus produces biased estimates.
In summary, violating the assumption requiring that the variance of requirements be smaller than the variance of intakes is likely to have a noticeable impact on the reliability of the prevalence estimate. To date, suggested estimates of the variance of requirements for most nutrients are smaller than those calculated for intakes. In principle, therefore, one need not worry about potential violations of this assumption. A situation in which the variance of intake may become small relative to the variance of requirements is for institutionalized
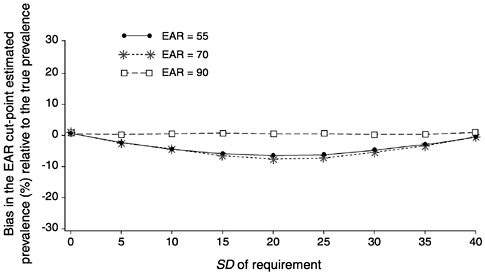
FIGURE D-18 Effect of the standard deviation of requirement (SDr) on bias of the estimated prevalence of inadequate intakes using the Estimated Average Requirement (EAR) cut-point method for 10 values of the SDr. For all values of the SDr, mean intake = 90, SD of intake = 30, and correlation between intake and requirement = 0.7. The EAR was set at 55 units (solid line with dots), 70 units (dotted line with stars) and 90 units (dashed line with squares).
populations, in which feeding is controlled and about the same for all individuals in the group (e.g., nursing homes). In these special instances it may be possible that the variance of intakes in the group could become small enough to create a problem. In this case, it might be better to assess adequacy using the probability approach rather than its short cut.
THE DISTRIBUTION OF REQUIREMENTS IS NOT SYMMETRICAL AROUND THE EAR
The assumption of symmetry of the requirement distribution is inappropriate for at least one important nutrient: iron requirements in menstruating women. As will be evident by inspection of the simulation results, when this assumption does not hold the performance of the Estimated Average Requirement (EAR) cut-point method for estimating the prevalence of nutrient inadequacy leaves much to be desired. In cases where it is known that the distribution of requirements is skewed, use of the probability approach is recommended to assess adequacy of nutrient intake for the group. In the case of iron, for example, the estimate of prevalence that would result from applying the probability approach and using a log-normal model for the requirement distribution will be less biased than that resulting from application of the EAR cut-point method. This is likely to be true even if the log-normal model is not the correct model for requirements.
The model used for simulating intakes and requirements in this section differs from the ones described in previous sections. Here, the simulation model was based on one proposed by the Food and Agriculture Organization/World Health Organization (FAO/WHO, 1988) to describe iron requirements. It has been established that daily losses of iron are 0.77 mg, and menstrual losses of iron are modeled as log-normal random variables with a mean (in natural log units) of −0.734 and standard deviation of 0.777. The specification of the model also assumes high iron availability in the diet (a bioavailability of 15 percent). For the simulation, the skewness of the requirement distribution was varied, and five values considered: 0.6, 1.3, 2.5, 3.2, and 5.7. Recall that for a symmetrical distribution, the value of the skewness coefficient is equal to zero; thus, increasing skewness reflects increasing departures from symmetry. Intakes were simulated independently as normal random variables with a mean intake of 12 mg, and standard deviation of 3 mg resulting in a CV of intake of 25 percent.
Rather than repeatedly sampling groups of 2,000 from the population
|
Box D-3 Major findings—Distribution of requirements not symmetrical
|
of 50,000, prevalence of inadequacy was estimated from the population itself. Therefore, the values shown in Table D-1 and in Figure D-19 represent the actual proportion of individuals with intakes below requirements (true prevalence) and the estimate obtained from application of the EAR cut-point method.
The only nutrient for which there is strong evidence indicating a skewed requirement distribution (at the time this report was published) is iron in menstruating women (FAO/WHO, 1988). In recent Institute of Medicine reports on Dietary Reference Intakes (DRIs)
TABLE D-1 True Prevalence of Inadequacy and Estimated Prevalence of Inadequacy of Iron Obtained Using the EAR Cut-point Method
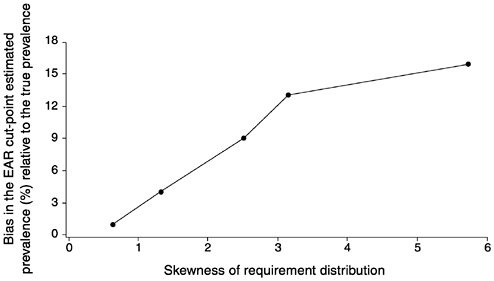
FIGURE D-19 The effect of the skewness of the requirement distribution on bias of the estimated prevalence of inadequate intakes using the Estimated Average Requirement (EAR) cut-point method for five values of skewness. For all levels of skewness, mean intake = 12 mg, standard deviation (SD) of intake = 3 mg, and correlation between intake and requirement = 0. The SD of requirement varied with the skewness of the requirement distribution.
no information was available to indicate nonsymmetrical distributions of requirements, so symmetry was assumed for the nutrients studied (IOM, 1997, 1998b, 2000).
When requirements are not symmetrically distributed around the EAR, the probability approach should be used to assess prevalence of inadequacy. To implement the probability approach it is necessary to specify a probability model for the requirement distribution. The probability approach should result in essentially unbiased estimates of prevalence if a skewed requirement distribution is accurately specified. If the requirement distribution is incorrectly specified (for example, a log-normal model is chosen for estimation, but gamma or Weibull would be more correct), then the prevalence estimates obtained via the probability approach will also be biased. The effect of incorrect model specification on the bias of the probability approach has not been studied, but the bias resulting in this case would likely still be smaller than that resulting from the application of the EAR cut-point method to estimate prevalence.


