
3
Using Dietary Reference Intakes for Nutrient Assessment of Individuals
This chapter provides a statistical approach to those wishing to quantitatively assess an individual's diet relative to the Dietary Reference Intakes (DRIs). The information presented in this chapter should be kept in context. Those who actually conduct individual assessments typically have access to a variety of information sources, including: (1) types of foods in the diet and information on usual dietary patterns; (2) lifestyle practices (e.g., smoking, alcohol consumption, exercise patterns); (3) anthropometric data; (4) clinical diagnosis (e.g., diabetes, cholesteremia, hypertension, cardiovascular disease); and (5) information on nutrient intakes from analysis of food records or recalls. Although the information presented in this chapter focuses on nutrient intake data, it should always be considered in combination with other information in dietary assessment of individuals.
Throughout the chapter, the fact that an individual's observed mean intake over a few days may not be an accurate estimate of that individual's usual intake is emphasized. When comparing mean observed intake to a DRI, it is important to take into account the day-to-day variability in intake. In addition, an individual's requirement of a nutrient is almost always unknown, and this uncertainty must also be accounted for in individual assessment. Specifically, this chapter demonstrates how to compare an individual's intake to the appropriate DRI of a nutrient to decide, with a predetermined level of confidence, whether an individual's intake of a nutrient is adequate or excessive.
The statistical approaches proposed in this chapter are not appli-
cable to all nutrients because they assume normal distributions of daily intakes and requirements. A different methodology needs to be developed for nutrients for which the requirement distribution in the population is skewed (such as the iron requirements of menstruating women) or for which the distribution of daily intakes is skewed (as in the case of vitamin A, vitamin B12, vitamin C, vitamin E, and perhaps several others). Until these new methods are available, individual assessment for these nutrients should continue to place emphasis on the types of information mentioned above for a qualitative assessment.
INTRODUCTION
When an Estimated Average Requirement (EAR) for a nutrient is available, it is possible to make a quantitative assessment of the adequacy of the individual's usual intake of the nutrient. When an Adequate Intake (AI) is all that is available, it is still possible to determine whether the individual's usual intake is above the AI with a predetermined level of confidence. No conclusions can be drawn, however, when usual intake is below the AI. In this chapter, guidance is provided on how to determine whether an individual's usual intake of a nutrient exceeds the Tolerable Upper Intake Level (UL), suggesting that the usual intake is excessive. Note that use of the Recommended Dietary Allowance (RDA) is not recommended for individual assessment.
Whether one is interested in assessing the adequacy of the individual 's usual intake or in deciding whether usual intake exceeds the UL, the relevant information must include both the observed mean intake and the standard deviation (SD) of daily intakes for the individual. In the next section it is emphasized that usual intake is unobservable in practice, but for the purposes of assessment, it suffices to observe the individual 's daily intake over a few days and to have a reliable estimate of the SD of daily intake.
PROPOSED NEW METHOD FOR INDIVIDUAL ASSESSMENT
Is an individual's diet meeting nutrient needs? This question is fundamental to individual nutrition counseling and education. Answering this question is not an exact science, and the answer is considerably less precise than might be anticipated, especially because of the appearance of accuracy in computer printouts providing nutrient analysis of dietary intake data.
The Dietary Reference Intakes (DRIs) can be used to assess the
apparent adequacy of an individual's intake to maintain the state of nutriture used to define a requirement. However, DRIs can neither provide precise quantitative assessments of the adequacy of diets of individuals nor be used to exactly assess nutritional status. Diet software programs based on the DRIs cannot do so either.
Assessing dietary adequacy by comparing an individual's intake and requirement for a nutrient is problematic for two reasons: first, the individual's requirement for a given nutrient must be known, and second, the individual's usual intake of the nutrient must be known. As described in Chapter 1, requirement is defined as the lowest continuing intake level of a nutrient that will maintain a defined level of nutriture in an individual for a given criterion of nutritional adequacy. Usual intake is defined as the individual's average intake over a long period of time. As is evident from these definitions, determining an individual's exact requirement would involve a controlled clinical setting in which the individual would be fed graded levels of a particular nutrient over a period of time, while undergoing numerous physiological and biochemical measurements. Determining usual intake requires a prohibitively large number of accurate diet records or recalls assessed using accurate food composition information (see Chapter 8 for further discussion of the importance of accurate intake and food composition data). Because neither type of information is usually available, it is simply not possible to exactly determine whether an individual's diet meets his or her individual requirement.
For some nutrients, however, it is possible to approximately assess whether an individual's nutrient intake meets his or her requirement. The remainder of this chapter and Appendix B provide specific guidance to help professionals assess individual dietary intake data relative to the DRIs. To do so, it is necessary to obtain information on an individual's usual intake, choose the appropriate reference standard, and then interpret the intake data.
Whenever possible, the assessment of apparent dietary adequacy should consider biological parameters such as anthropometry (e.g., weight for height), biochemical indices (e.g., serum albumin, blood urea nitrogen, creatinine, retinol binding protein, hemoglobin), diagnoses (e.g., renal disease, malabsorption), clinical status, and other factors as well as diet. Dietary adequacy should be assessed and diet plans formulated based on the totality of the evidence, not on dietary intake data alone.
Obtain Information on the Individual's Usual Intake
The first step in individual assessment is to obtain the most accurate information possible on total dietary intake (food and supplements), recognizing that this is always a challenge because of the documented high incidence of underreporting (Johnson et al., 1998; Lichtman et al., 1992; Mertz et al., 1991), and the large day-to-day variation in intake (Beaton et al., 1979, 1983; Gibson, 1990; Sempos et al., 1985; Tarasuk and Beaton, 1991b, 1992; Van Staveren et al., 1982). Intake on one or even several days may give very inaccurate estimates of usual intake, especially if the individual's food choices vary greatly from one day to the next, which is a common occurrence. Following are some issues to consider when determining the magnitude of day-to-day variation:
-
Factors that affect day-to-day variation in nutrient intake include:
-
variety versus monotony in an individual's food choices (Basiotis et al., 1987; Sempos et al., 1985; Tarasuk and Beaton, 1991b, 1992)
-
day of the week (Beaton et al., 1979; Tarasuk and Beaton, 1992; Van Staveren et al., 1982)
-
season
-
holidays and special occasions
-
appetite (which may be related to changes in physical activity, the menstrual cycle, etc. [Barr et al., 1995; Tarasuk and Beaton, 1991a])
-
-
The number of days needed to estimate usual intake also varies according to the desired precision of the estimate (see examples in Box 3-1). Obtaining an estimate within ± 10 percent of the usual intake requires more days of intake data than obtaining an estimate within ± 20 percent of the usual intake (Basiotis et al., 1987).
|
BOX 3-1 The Number of Days Needed to Estimate Usual Intake Varies with the Specific Nutrient and the Desired Precision Consider trying to estimate an individual's usual intake of niacin and vitamin C. In a study of 13 men over 1 year, it was estimated that determining mean niacin intake within ± 10 percent of their true usual intake required 53 days of intake data, whereas 249 days of intake data were needed to estimate usual vitamin C intake with the same precision. In a study of 16 adult women over 1 year, an average of 222 days of intake data was needed to estimate their vitamin C intake within ± 10 percent of true usual intake, while an estimate within ± 20 percent of true usual intake required only 55 days (Basiotis et al., 1987). |
-
Special attention must be given to nutrients that are highly concentrated in a few foods that are consumed only occasionally (see vitamin A example in Box 3-2). It takes fewer days to estimate usual intake of nutrients found in lower concentrations in many foods, especially if those foods are dietary staples (Gibson et al., 1985).
Nutrient intakes of individuals are estimated using instruments (e.g., diet records, recalls, diet histories, or food-frequency questionnaires) that are seldom capable of capturing long-term usual intake. With careful attention to technique (i.e., instruments that capture total nutrient intake such as food records and dietary recalls), and access to complete food composition databases, these instruments may provide an accurate reflection of the individual's intake during a specified time period (e.g., a 3-day record). Suggestions for improving the accuracy of dietary intake data collection are discussed further in Chapter 8. See Box 8-1 for a list of issues to consider when estimating dietary intake.
However, because of day-to-day variation in intake (within-person variation), this observed intake is probably not the same as long-term usual intake. In all likelihood, an individual's observed intake during one 3-day period will differ from observed intake in another 3-day period, and both 3-day observed intakes will differ from true usual intake. There is also error due to within-person variation with instruments such as food-frequency questionnaires, and some authors have estimated this error to be similar to that seen with 3-day records and recalls (Beaton, 1991; Liu, 1988). Diet histories may have less
|
BOX 3-2 The Challenge of Estimating Usual Vitamin A Intake Consider trying to estimate an individual's usual intake of vitamin A. On four consecutive days, a person might consume 600, 750, 250, and 400 retinol equivalents (RE). Does the average of these four values (500 RE) represent usual intake over a longer time, such as 1 year? In most cases it would not, because vitamin A intake is often extremely variable. The intake on the next day might be 100 or 4,000 RE, changing the estimated usual intake to 420 or to 1,200 RE, respectively. Very different conclusions would be drawn about the likely adequacy of this individual's diet from these different estimates, but would any of these estimates be correct? Probably not. Estimating usual vitamin A intake requires months, if not years, of records. |
error from within-person variation, but the size of this error has not been quantified.
It is clear that estimating an individual's usual intake for a nutrient from the individual's observed intake alone may lead to an under- or overestimation of that individual's usual intake of the nutrient. However, it is still possible to evaluate the potential error if something is known about the magnitude of the within-person variation in intakes for that nutrient. The individual's observed mean intake is the best estimate available of the individual's usual intake of the nutrient. A pooled estimate of the within-person variability in intakes has been computed for a number of nutrients from nationwide food consumption surveys (see Appendix Table B-2, Table B-3, Table B-4 through Table B-5). The magnitude of the day-to-day variation in intakes of a nutrient will indicate whether the observed mean intake calculated from a few daily records or recalls is a more or less precise estimator of the individual's usual intake of that nutrient. The observed mean intake and the pooled estimate of day-to-day variability in intakes will be used subsequently to guide individual dietary assessments.
Choose the Appropriate Reference Standard
The second step in individual assessment is to choose the appropriate DRI to use as a reference standard. In assessing the apparent adequacy of an individual's intake, interest is in whether the individual's nutrient requirement is met. Unfortunately, information on an individual's requirement is seldom, if ever, available. Therefore, the best estimate for an individual's unobservable requirement is the Estimated Average Requirement (EAR), defined as the median requirement of a nutrient for a given life stage and gender group. Obviously there is variation in requirements among individuals, and assumptions have been made about the shape of the requirement distribution. A coefficient of variation (CV) (standard deviation of the requirement divided by the mean requirement × 100) of 10 percent has been assumed for most of the nutrients for which EARs have been established (IOM, 1997, 1998b, 2000). If requirements are normally distributed, a CV of 10 percent means that about 95 percent of individuals would have requirements between 80 and 120 percent of the EAR (± 2 standard deviations). With a CV of 15 percent, as has been estimated for niacin (IOM, 1998b), the corresponding range would be between 70 and 130 percent of the EAR. For some nutrients the CV of the requirement distribution may be even higher, and for other nutrients (e.g., iron requirements of
menstruating women) the requirement distribution is known to be skewed rather than normal. For nutrients with skewed requirement distributions, the approach to assess individual intakes proposed in this chapter is not appropriate.
The larger the CV (and thus the standard deviation), the larger the range of possible values for an individual's requirement for that nutrient, and the greater the uncertainty about what the individual's requirement for that nutrient might be. Even in the hypothetical case in which the individual's usual nutrient intake is known, uncertainty remains about whether the usual intake is adequate, because that individual 's requirement is not known.
Recommended Dietary Allowances (RDAs) have been established as a target or goal for intake by an individual, and it can be assumed that individuals whose usual intakes are above the RDA are likely to be meeting their individual requirements and thus have adequate intakes. However, the converse is not true. For this reason the RDA is not a useful reference standard for assessing an individual's intake. Intakes below the RDA cannot be assumed to indicate that an individual's intake is inadequate. The RDA, by definition, exceeds the actual requirements of all but 2 to 3 percent of the population, so many of those with usual intakes below the RDA may be meeting their individual requirements. The likelihood of nutrient inadequacy, however, increases as the usual intake falls further below the RDA.
As discussed in the previous section, however, usual intakes are unobservable in practice. Thus, one is limited to comparing the observed mean intake to the DRIs in order to assess adequacy. Subsequently in this chapter it will be demonstrated that due to the typically high day-to-day variability in intakes for most nutrients, one may not be able to conclude that an individual's usual intake is adequate even if the observed mean intake is larger than the RDA. Thus, comparing an individual's observed mean intake to the RDA is not recommended as a means for determining nutrient adequacy for the individual.
If an Adequate Intake (AI) rather than an EAR was set for a nutrient (e.g., calcium, vitamin D), it may be used in a more limited way as described in the next section.
Interpret Individual Dietary Intake Data
The third step in individual assessment is to assess the data to answer the question, On the basis of an individual's observed intake over a small number of days, is that individual's usual intake of the nutrient adequate and at low risk of adverse effects?
Using the Estimated Average Requirement
As described earlier in this chapter, trying to compare an individual 's intake to his or her requirement for a nutrient is difficult for two main reasons: (1) one needs to know an individual's requirement; and (2) one needs to know an individual's long-term usual intake of the nutrient. Neither the individual's requirement nor the usual intake of an individual is known.
Appendix B presents in detail a proposed approach, summarized below, to address this issue, recognizing that nutrient requirement and usual intake are not observable for a given individual. This approach is based on the following assumptions:
-
The EAR is the best estimate of an individual's requirement.
-
There is person-to-person variation in requirements. The standard deviation of the requirement is an indicator of how much the individual 's requirement for a nutrient can deviate from the median requirement (EAR) in the population.
-
Mean observed intake of an individual is the best estimate of an individual's usual intake.
-
There is day-to-day variation in intake for an individual. The within-person standard deviation of intakes is an indicator of how much observed intake may deviate from usual intake.
Inferences about the adequacy of an individual's diet can be made by looking at the difference between observed intake and the median requirement. That is, D is the difference between the mean observed intake for an individual ![]() and the median requirement (EAR, called r for simplicity) for the life stage and gender group to which the individual belongs,
and the median requirement (EAR, called r for simplicity) for the life stage and gender group to which the individual belongs,
D = ![]() − r.
− r.
If the difference D is large and positive, that is, if observed intake is much greater than the median requirement, then it is likely that an individual 's intake is adequate. Conversely, if the difference D is large and negative, that is, observed intake is much less than the median requirement, then it is likely that an individual's intake is not adequate. In between, there is considerable uncertainty about the adequacy of the individual's intake.
The obvious question then, concerns how large D would have to be before it could be concluded with some degree of assurance that the individual's unobservable usual intake exceeds the individual's
unobservable actual requirement. To answer this question, it is necessary to know the standard deviation of D (SDD). The SDD depends on the number of days of intake available for the individual, the standard deviation of the requirement (estimated as 10 to 15 percent of the EAR for most nutrients), and the within-person standard deviation of intake. The latter can be estimated from large surveys of similar groups of people (such as the Continuing Survey of Food Intakes by Individuals [CSFII] data presented in Appendix Table B-2, Table B-3, Table B-4 through Table B-5). Once D and SDD have been estimated, the probability that intake is above (or below) the requirement can be determined by examining the ratio of D to SDD.
To illustrate this approach, suppose a 40-year-old woman had a magnesium intake of 320 mg/day, based on three days of dietary records. The question is whether this observed mean intake of 320 mg/day of magnesium over three days indicates that her usual magnesium intake is adequate. The following information is used in conducting this assessment:
-
The EAR for magnesium for women 31 to 50 years of age is 265 mg/day, with an SD of requirement of 26.5 mg/day.
-
The day-to-day SD in magnesium intake for women this age is 85.9 mg/day based on data from the CSFII (see Appendix Table B-2).
The following steps can now be used to determine whether an intake of 320 mg/day is likely to be adequate for this woman.
-
Calculate the difference D between intake and the EAR as 320 − 265 = 55 mg.
-
Use the formula for the SDD1 and determine that the SDD is 56 mg. The value of SDD is computed as follows: (a) from Appendix Table B-2, the pooled SD of daily intake for magnesium in women aged 19 to 50 years is 86 mg/day, and therefore the variance of daily intake is the square of the SD or 7,379 mg; (b) divide 7,379 by the number of days of observed intake data (3) to obtain 2,460;
1
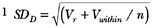 , where Vr denotes the variance of the distribution of requirements in the group, and Vwithin denotes the average variance in day-to-day intakes of the nutrient. Both variances are computed as the square of the corresponding standard deviations. Intuitively, as the number n of intake days available on the individual increases, the variance of the observed mean intake should decrease (i.e., the accuracy of the estimate for y increases). Thus, the dividing Vwithin by n when computing the standard deviation of the difference D.
-
(c) add this to the square of the SD of requirements ([26.5 mg/ day]2 = 702 mg/day), resulting in a value of 3,162; and (d) the SDD is then obtained as the square root of 3,162, which is 56.
-
Therefore, D (55) divided by SDD (56) is just slightly less than 1. As shown in Appendix Table B-1, a value of about 1 implies an 85 percent probability of correctly concluding that this intake is adequate for a woman in this age category. (Details and further explanation are given in Appendix B.)
It is important to note that this woman's intake was exactly equal to the RDA of 320 mg/day, yet since there are only three days of dietary records, there is only 85 percent confidence that this intake is adequate. Only if true long-term intake had been measured for this woman (which is seldom feasible) could there be 97.5 percent confidence that intake at the RDA is adequate. With only three days of dietary recalls, it would be necessary for her magnesium intake to be 377 mg/day (which is well above the RDA) in order to have 97.5 percent confidence that intake was adequate (see Table 3-1).
Note that the SD of daily intake for the woman is not estimated from her own 3-day records. Instead, the estimated SD of daily intake of magnesium obtained from the CSFII is used. This estimate is a pooled (across all sampled individuals of the same life stage and gender group) SD of daily intake.
Why not use the woman's three days of intake records to estimate her SD of daily intake? As discussed earlier in this chapter, daily intakes may vary considerably from one day to the next. Unless the three days of intake recorded for the woman represent her entire range of intakes of magnesium, the SD that is estimated from her own records is likely to be severely biased. Thus, it is recommended that the pooled SD of daily intake obtained from the CSFII (or from other similar large-scale dietary surveys) be used for individual assessment. This has one serious drawback, however, as it is well known that the SD of daily intake also varies from individual to individual. In particular, it has been suggested that the within-person SD of intake is larger in those individuals with higher consumption of the nutrient (Tarasuk and Beaton, 1991a). Nusser et al. (1996) suggested that for some nutrients the association between mean intake and SD of intake for the individual is approximately linear. At this time, however, no extensive studies have been conducted to allow reliable estimation of the within-person SD of intakes from the individual's intake records. Therefore, even though the pooled SD obtained from CSFII (or other large-scale dietary surveys)
TABLE 3-1 Illustration of Observed Mean Intakes of Magnesium That Would Be Necessary to Have 85 Percent or 97.5 Percent Confidence That Usual Intake Is Greater Than the Requirement for a Woman 40 Years of Age
|
Using SD of Intake from CSFIIa |
Assuming the SD is 25 Percent Larger |
Assuming the SD is 50 Percent Larger |
||||
|
mg |
% RDAb |
mg |
% RDA |
mg |
% RDA |
|
|
Magnesium EARc |
265 |
265 |
265 |
|||
|
SD of requirement |
26.5 |
26.5 |
26.5 |
|||
|
Magnesium RDA |
320 |
320 |
320 |
|||
|
Assumed SD of intaked |
86 |
107 |
129 |
|||
|
Observed mean intake with 85 % confidence of adequacy of usual intake |
||||||
|
1 d of intake |
355 |
111 |
376 |
117 |
397 |
124 |
|
3 d of intake |
321 |
100 |
332 |
104 |
344 |
107 |
|
7 d of intake |
307 |
96 |
313 |
98 |
320 |
100 |
|
Observed mean intake with 97.5 % confidence of adequacy of usual intake |
||||||
|
1 d of intake |
445 |
139 |
486 |
152 |
528 |
165 |
|
3 d of intake |
377 |
118 |
400 |
125 |
423 |
132 |
|
7 d of intake |
349 |
109 |
362 |
113 |
376 |
117 |
|
NOTE: Observed mean intake with xx percent confidence of adequacy = observed mean intake necessary to have approximately xx percent confidence that the woman's intake is greater than her requirement. aSD = standard deviation; CSFII = Continuing Survey of Food Intake by Individuals. b RDA = Recommended Dietary Allowance for women 31 through 50 years of age c EAR = Estimated Average Requirement for women 31 through 50 years of age. dSD of magnesium intake for women 19 through 50 years of age taken from CSFII (Appendix Table B-2). |
||||||
is not the best estimate of the individual's SD of daily intake, the Subcommittee still recommends its use in individual assessment.
Table 3-1 expands this example to further illustrate the effect of day-to-day variation on the evaluation of magnesium intake for a woman in the 31–50 years age group.
-
For a given confidence level, the number of days of intake data affects the level of nutrient intake judged to be adequate. Based on the SD in intake of 85.9 mg/day for an individual (again using the information in Appendix Table B-2), observed intake would need
-
to be 445 mg/day (139 percent of the RDA) to have a 97.5 percent confidence that intake was adequate with only one day of observed intake. However, a mean observed intake of only 349 mg/day (109 percent of the RDA) would be needed with 7 days of observed intake.
-
For a given confidence level, the larger the SD of daily intake, the greater the intake level needed for intake to be assessed as adequate. If the SD of magnesium intake were 25 percent larger, then intake would need to be 486 mg/day (152 percent of the RDA) to have a 97.5 percent confidence of adequacy with one day of observed intake, and 362 mg/day (113 percent of the RDA) with 7 days. If the SD were 50 percent larger, then the intakes would need to be still higher to have 97.5 percent confidence of adequacy.
To simplify this approach for nutrition professionals, institutions, and agencies may wish to establish levels of intake that they consider adequate for a given nutrient. For the example shown here, a level of 377 mg/day might be chosen as the level of adequacy of magnesium intake for women 31 to 50 years of age, by an institution that typically collects three days of dietary data for its patients, and wanted a high level of confidence (97.5 percent) that intake was adequate.
To summarize, despite the fact that neither individual requirement nor usual individual intake is available for dietary assessments of individuals, some inferences about individual adequacy can be made by looking at the difference between observed intake and the median requirement. Shortcomings of this approach are described in Appendix B. For example, the approach cannot be used when observed daily intakes are not normally (or symmetrically) distributed around the individual 's usual intake. An indication that the within-person intake distribution is not normal (or symmetrical) is the size of the within-person standard deviation in intake relative to the mean intake. When the SD of daily intake is high enough so that the CV of daily intake is larger than approximately 60 to 70 percent, then the approach proposed here is not appropriate. Appendix Table B-2 and Table B-3 indicate that for vitamin A, carotenoids, vitamin C, and vitamin E, among others, the CV of daily intake is very large, above 70 percent. For those nutrients, it would be incorrect to apply the method described in this section to assess adequacy of an individual's diet. At this time, no alternative can be offered, as much research is needed in this area.
It is also possible to calculate observed nutrient intake levels with an 85 or 97.5 percent confidence of inadequacy. Intakes with a high probability of inadequacy are below the EAR. For confidence (at
97.5 percent) that an observed intake is below an individual's requirement, it is necessary to have either a large number of days of intake or for the intake to be substantially below the EAR. Taking magnesium for women 19 through 50 years of age as an example, with 7 days of observed intake, an intake of about 180 mg/day (compared with the EAR of 265 mg/day) would have a high probability (97.5 percent) of being below an individual's requirement. However, it is often the case that a nutrition professional wants to have a high level of confidence when concluding that intakes are adequate but will find a much lower level of confidence acceptable when concluding that intake is inadequate. For example, even if the probability of inadequacy was only 50 percent, most professionals would urge a client to try to increase intake of that nutrient. One would want to be much more certain before concluding that a client's intake was adequate and that no action to improve intake was needed.
Thus, for practical purposes, many users of the DRIs may find it useful to consider that observed intakes below the EAR very likely need to be improved (because the probability of adequacy is 50 percent or less), and those between the EAR and the RDA probably need to be improved (because the probability of adequacy is less than 97.5 percent). Only if intakes have been observed for a large number of days and are at or above the RDA, or observed intakes for fewer days are well above the RDA, should one have a high level of confidence that the intake is adequate. It is hoped that computer software will be developed that will compute these probabilities (as described in Appendix B), thus offering more objective alternatives when individual intakes are evaluated.
In summary, for nutrients for which an EAR has been established, it is possible to assess the adequacy of an individual's usual intake for a nutrient. The approach described above takes into account the uncertainty about the true value of the individual's usual intake, and also the uncertainty about the individual's requirement for the nutrient. The method cannot be employed when the distribution of requirements for the nutrient is skewed (as in the case of iron requirements for menstruating women), or when the distribution of daily intakes for an individual is not normal (as is the case with nutrients for which the CV of intake has been calculated to be above 60 to 70 percent, see Appendix Table B-2, Table B-3, Table B-4 through Table B-5). There are three additional sources of potentially large error when using this approach to assessing an individual's intake:
-
The assumed 10 percent CV estimate applied to many nutrients to date (IOM, 1997, 1998b, 2000) may not be a reliable estimator of
-
the SD of requirement. Since the SD of requirement is an important component of the SDD, an inaccurate value for the SD of requirement will result in an inaccurate value for SDD and hence the ratio of D/SDD.
-
The SD of daily intake for the individual is considerably larger (or smaller) than the pooled SD of daily intake obtained from CSFII (or from the National Health and Nutrition Examination Survey).
-
The individual's intake is underreported, so that the mean observed intake is a biased estimator of the individual's usual intake.
The described approach should not be used in isolation from other information available to nutrition professionals. Most professionals combine the nutrient intake data with other sources of information such as food guides and answers to questions about whether intake was typical or atypical.
This statistical approach to individual assessment is based on quantitative dietary records and recalls, where the method for deriving the error term (the within-person standard deviation of intakes) is known and easy to apply. Many researchers and health professionals use other methods of estimating usual intakes, such as food frequencies or diet histories, or a combination of various methods. With alternative assessment methodologies, the overall objective of the assessment remains the same—to determine whether usual intake by the individual exceeds the individual's requirement—and professionals must rely on estimates of both usual intake and requirement. The important consideration is that different methodologies for determining dietary intake have different sources and magnitudes of random error in estimating usual intake—the equivalent of the within-person standard deviation of intake discussed above—and may not provide adequate quantitative estimates of total nutrient intake over the period of observation. Additional discussion of dietary intake measurement instruments is provided in Chapter 8. However, a detailed discussion of these methods is beyond the scope of this report, and users will need to turn to other sources to find estimates of the error associated with alternative methods for estimating usual intake.
Using the AI
If an AI must be used to interpret dietary intake data because an EAR has not been set, the process described above cannot be used in the same way. Before discussing a statistical approach to individual assessment for nutrients with an AI, it is critical to emphasize the
difference between these two DRIs. The EAR represents the median nutrient requirement of a given life stage and gender group, and by definition, an intake at the level of the EAR will be inadequate for half the group. In contrast, the AI represents an intake (not a requirement) that is likely to exceed the actual (but unknown) requirements of almost all healthy individuals in a life stage and gender group. In this respect it is analogous to the RDA; however, because of the nature of the data used to establish AIs, they may often be higher than the RDA would be if appropriate data were available to calculate one.
The approach discussed previously to assess nutrient adequacy compares an individual's observed intake to the EAR, and considers variability in both intakes and requirements when determining how confident one can be in concluding that an individual's intake is adequate. In other words, intakes are compared to the median requirement. In the case of the AI, however, intakes are compared to an intake value in excess of the median requirement, perhaps by a very large margin. Thus, when intakes are compared to the AI, all one can truly conclude is whether intake is above the AI or not. Although an intake that is significantly above the AI is certainly adequate, intakes below the AI are also likely to be adequate for a considerable proportion of individuals. Thus, great caution must be exercised when interpreting intakes relative to AIs.
|
What conclusions can be drawn about individual intakes for nutrients with AIs? First, if an individual's usual intake exceeds the AI, it can be concluded that their diet was almost certainly adequate. However, if their usual intake falls below the AI, no quantitative estimate can be provided of the likelihood of nutrient inadequacy. |
Risk of inadequacy increases at some point below the AI. If the usual nutrient intake from all sources was zero, the risk of inadequacy would be virtually 100 percent. However, because the point where risk increases cannot be determined, quantitative estimates of risk cannot be made.
Even if the observed intake is above the AI, it should not be assumed that usual intake is above the AI unless a large number of days of intake data were collected. As discussed in the previous sec-
tion on the EAR, it is difficult to collect dietary intake data that truly reflect usual intake.
Can an approach similar to the one described earlier be developed to assess whether an individual's usual intake is above the AI? The answer to this question is yes, but with some reservations. When the EAR is not available, there is no information about the distribution of requirements in the population. One can, nonetheless, test whether an individual's usual intake exceeds the AI, and if so, conelude that the individual's usual intake is likely to be adequate. A test similar to the one presented in the preceding section incorporates the day-to-day variability in intakes in order to determine whether usual intake for the individual is above the AI.
As an example, consider a nutrient for which the AI has been determined to be 500 units/day, the individual being assessed is a woman 40 years of age, with three dietary recalls, and a mean observed intake of 560 units/day. The SD of daily intake for this nutrient is 50 units (as might be listed in Appendix Table B-2). To decide whether the woman's usual intake is above the AI, one would follow these steps:
-
Compute the difference between the woman's observed mean intake and the AI. In this example, the difference is 560 − 500 = 60 units.
-
Divide the difference by the SD of daily intake over the square root of the number of days of intake available for the woman. In this example, 50/
 = 29, and 60/29 = 2.07.
 -
Compare 2.07 to the tabulated values shown in Appendix Table B-6, and find the confidence level with which one could conclude that the woman's usual intake was above the AI. In this case, 2.07 corresponds to a high confidence level of about 98 percent.
For this woman, it can be confidently concluded that her usual intake of the nutrient is at or above the AI and thus adequate. This procedure, therefore, can be used to determine whether usual intake is larger than the AI given the observed intake for a few days.
Given an observed mean intake for the individual the confidence with which one can determine usual intake to be above the AI depends on: (1) the number of days of observed intake available for the individual, and (2) the SD of daily intake for the nutrient. An example using calcium intake is provided in Table 3-2. In this example, observed mean intake of calcium relative to the AI for calcium is assessed for a woman 40 years of age. Different numbers of daily
TABLE 3-2 Illustration of the Computations Necessary to Test Whether Usual Intake Is Above the Adequate Intake (AI) for Different Numbers of Days of Observed Intake for a Woman 40 Years of Age
|
Using SD from CSFIIa |
If SD is 25 Percent Larger |
If SD is 50 Percent Larger |
|
|
Mean intake |
1,200 mg |
1,200 mg |
1,200 mg |
|
SD of intakeb |
325 mg |
406 mg |
488 mg |
|
AI for calciumc |
1,000 mg |
1,000 mg |
1,000 mg |
|
z-Values = (mean intake – AI)/(SD/square root [n]) |
|||
|
1 d of intake |
0.61 |
0.49 |
0.41 |
|
3 d of intake |
1.07 |
0.85 |
0.71 |
|
7 d of intake |
1.69 |
1.30 |
1.08 |
|
Percentage confidence that the woman's usual intake exceeds the AId |
|||
|
1 d of intake |
73 |
69 |
66 |
|
3 d of intake |
86 |
80 |
76 |
|
7 d of intake |
95 |
90 |
86 |
|
NOTE: The confidence with which one can conclude that usual intake is greater than the AI decreases when the number of days of daily intake records for the individual decreases, or when the SD of daily intake increases. aSD = standard deviation; CSFII = Continuing Survey of Food Intake by Individuals, bSD of calcium intake for women 19 through 50 years of age taken from CSFII (Appendix Table B-2). c Adequate Intake for women 31 through 50 years of age. d Confidence values were taken from a standard z-table (Snedecor and Cochran, 1980). The z-table is used because the SD of daily intake is assumed to be known (e.g., from CSFII), and is not computed from the woman's daily observations. |
|||
intake records and different SDs of daily intake for calcium were assumed. For each case, the confidence with which one would conclude that her usual intake is above the AI was calculated and is shown in the table.
If one can conclude that in fact usual intake appears to be larger than the AI with desired accuracy, then there is considerable assurance that the individual's intake is adequate. However, if the test does not result in the conclusion that usual intake is larger than the AI with the desired precision, then it cannot be inferred that intake is inadequate.
As discussed earlier, this approach is not appropriate when daily intakes for an individual are not approximately normally distributed.
TABLE 3-3 Qualitative Interpretation of Intakes Relative to the Adequate Intake (AI)
|
Intake Relative to AI |
Suggested Qualitative Interpretation |
|
Greater than or equal to the AI |
Mean intake is likely adequate if observed over a large number of days |
|
Less than the AI |
Adequacy of intake cannot be determined |
Any nutrient for which the CV of daily intakes exceeds about 60 to 70 percent has a skewed daily intake distribution and therefore the test described here cannot be applied. In those cases, a qualitative interpretation of the observed mean intake may be all that is available. Table 3-3 gives some guidance on to how to interpret mean observed intake relative to the AI qualitatively.
Using the UL
If a nutrient has a UL, that value can be used to assess the likelihood that an individual may be at risk of adverse affects from high intake of the nutrient. Doing so requires a good understanding of the definition of the UL and the type of intake (e.g., foods, fortified foods, and/or supplements) that should be considered during the assessment.
The UL is a level of chronic daily nutrient intake that is likely to pose no risk of adverse health effects for almost all individuals in the general population, including sensitive individuals. For many nutrients, the UL reflects intake from all sources, including food, water, nutrient supplements, and pharmacological agents. However, in some cases the UL applies only to intakes from fortified foods and supplements or intakes from supplements only. As stated previously (see Chapter 1), ULs do not represent optimal or desirable intakes but instead are intakes that should generally not be exceeded by healthy individuals. An occasional intake above the UL by a small margin is not a reason for major concern. However, because it is not possible to know who is most susceptible to adverse effects of intakes above the UL, such intakes should be avoided.
|
What if an individual has an intake above the UL on a chronic basis? For example, what if a person's magnesium intake from a nonprescribed antacid is 500 mg per day and the UL for magnesium (based on supplemental intake only) is 350 mg? The most prudent advice in this situation would be to recommend that the individual reduce intake to below the UL. In this example, choosing a different type of antacid might be appropriate. |
The consequences associated with nutrient excess—severity and reversibility of the adverse effect—vary for different nutrients. Moreover, little is known about nutrient-nutrient interactions at high doses. Without good evidence for an expected benefit, or unless under the supervision of a physician, there is no justification for intake above the UL.
|
If an individual decides to take a supplement for nontherapeutic purposes, should a supplement that contains the UL of a nutrient be selected? No, supplements should not be chosen on this basis. |
Use of a supplement containing the UL for a nutrient, when combined with intakes from foods, would place the individual at potential risk of adverse effects. Accordingly, a supplement which contains nutrients at levels below, or approximating the RDA or AI would be a more appropriate choice.
A test similar to the one described in the preceding section for the AI can be implemented to decide whether usual intake is below the UL given the observed mean intake. The test is constructed in exactly the same manner, but now the UL is subtracted from the mean observed intake for the individual. Again, this test cannot be used for nutrients with a large CV of daily intake such as vitamin A, vitamin B12, vitamin C, and vitamin E (see Appendix Table B-2 and Table B-3).
An example similar to the one presented in Table 3-2 is presented in Table 3-4. In the example, again the assessment is for a woman who is 40 years old. This woman has a normal activity pattern, energy intake not exceeding 2,500 kcal/day, and a mean phosphorous intake of 3.8 g (see IOM [1998b] for discussion of high phos-
TABLE 3-4 Illustration of the Computations Necessary to Test Whether an Individual 's Usual Intake of Phosphorus Is Below the Tolerable Upper Intake Level (UL) for Different Numbers of Days of Observed Intake for a Woman 40 Years of Age
|
Using SD from CSFIIa |
If SD is 25 Percent Larger |
If SD is 50 Percent Larger |
|
|
Mean intake |
3.8 g |
3.8 g |
3.8 g |
|
SD of intakeb |
0.4 g |
0.5 g |
0.6 g |
|
UL for phosphorusc |
4.0 g |
4.0 g |
4.0 g |
|
z-Values = (mean intake − UL)/(SD/square root [n]) |
|||
|
1 d of intake |
−0.49 |
−0.39 |
−0.32 |
|
3 d of intake |
−0.84 |
−0.68 |
−0.56 |
|
7 d of intake |
−1.29 |
−1.03 |
−0.85 |
|
Percentage confidence that the woman's usual intake is below the ULd |
|||
|
1 d of intake |
69 |
65 |
63 |
|
3 d of intake |
80 |
75 |
71 |
|
7 d of intake |
90 |
85 |
80 |
|
NOTE: The confidence with which one can conclude that usual intake is below the UL decreases when the number of days of daily intake records for the individual decreases or when the SD of daily intakes increases. aSD = standard deviation; CSFII = Continuing Survey of Food Intake by Individuals. bSD of phosphorus intake for women 19 through 50 years of age taken from CSFII (Appendix Table B-2). c Tolerable Upper Intake Level for women 31 through 50 years of age. d Confidence values were taken from a standard z-table (Snedecor and Cochran, 1980). The z-table is used because the SD of daily intake is assumed to be known (e.g., from CSFII), and is not computed from the woman's daily observations. |
|||
phorous intakes associated with high energy expenditure). The UL for phosphorus has been determined to be 4.0 g/day, and the SD of phosphorous intake, from CSFII, is 0.41 g. Given that her observed mean intake is below the UL, can we conclude with desired assurance that her usual intake of phosphorus is below the UL and that she is not at potential risk of adverse health effects? Again, situations are shown with 1, 3, and 7 days of intake data.
From the example in Table 3-4, it can be seen that even when observed mean intake is less than the UL, sometimes it cannot be concluded with desired accuracy that usual intake is also below the UL. When only one day of intake data is available for the individual, one would have only between 63 and 69 percent (depending on the SD of daily intake) confidence in concluding that her intake of 3.8 g
reflects a usual intake below the UL. In this example, only the 7 days of intake data provide levels of confidence of 85 to 90 percent for concluding that this woman's usual intake is below the UL given her observed mean intake.
Since this test would be conducted only in cases where the observed mean intake for the individual is high enough to suggest a problem, the SD of daily intake as calculated in CSFII or the National Health and Nutrition Examination Survey may underestimate the individual's true SD of daily intake. This is because there is some evidence that the SD of daily intake increases as the mean intake increases (Nusser et al., 1996). Using a SD of daily intake that is too small may lead to the conclusion that usual intake is below the UL when in reality it is not (at a given level of assurance).
As described previously, this test can be performed when daily intakes can be assumed to approximate a normal distribution. An indication that daily intakes are not normally distributed is a high CV of intake. From Appendix Table B-2, Table B-3, Table B-4 through Table B-5, it can be seen that for several nutrients the CV of daily intake is above 60 to 70 percent. In those cases, this test approach is not recommended, and one should make a qualitative assessment of the individual's intake. Table 3-5 presents qualitative interpretations of an individual's intake in relation to the UL. The impact of within-person variation at high intake levels (e.g., levels approaching the UL) has not been studied extensively.
When using the proposed method it is important to note that the pooled estimates of the within-person standard deviation of intakes in Table B-2, Table B-3, Table B-4 to Table B-5 are based on data on nutrients from food only, not food plus supplements. This suggests the need for caution in using these estimates in assessing individual intakes relative to the UL. For some nutrients, ULs are defined on the basis of total intake (food plus supplements), and the estimates of the within-person
TABLE 3-5 Qualitative Interpretation of Intakes Relative to the Tolerable Upper Intake Level (UL)
|
Intake relative to the UL |
Suggested Qualitative Interpretation |
|
Greater than or equal to the UL |
Potential risk of adverse effects if observed over a large number of days |
|
Less than the UL |
Intake is likely safe if observed over a large number of days |
standard deviation of intakes based on food alone may not be the same as those based on food plus supplements. For other nutrients, ULs refer only to nutrient intake from food fortificants, supplements, and pharmacological products. In these cases, the proposed methods are even less reliable, as currently there are no estimates of the within-person standard deviation of intakes from supplement use alone.
APPLICATIONS
The following examples show how the Dietary Reference Intakes (DRIs) might be used as part of an assessment of an individual's diet. Note that information other than intake relative to the DRIs is also considered, and in many instances may provide data that are more useful in the assessment than are the nutrient intakes.
Application 1. Assessing the Diet of an Older Individual in an Assisted Living Setting
Background and Data
Mr. G is a 78-year-old man who lives in an assisted-living institution where he eats most of his meals in the dining room. He does not currently take supplements. By observing what he eats, it is possible to obtain direct estimates of his dietary intake, rather than rely on his reports alone, and this is done for several days. Anthropometric data (weight changes), physical activity level, and other information on his health status are available.
Question
The nutritionist who is a consultant to the assisted living facility wants to determine whether Mr. G's food intake is sufficient to meet his nutrient needs.
Assessment
Because it is difficult to determine energy balance, even from several days of intake, the nutritionist determines whether Mr. G is maintaining weight. This is a much more direct method of assessing the adequacy of his energy intake than estimating his caloric intake. In addition to such non-dietary evaluations, the nutritionist obtains
an indication of the adequacy of his intake of other nutrients by comparing them to the appropriate DRIs. The assessments that might be made are shown in Table 3-6 for several nutrients from Mr. G's dietary record analysis.
Application 2: Assessing the Diet of a Young Woman Planning a Pregnancy
Background
Ms. T, who is a health-conscious 30-year-old woman, consults a nutritionist in private practice. Before her visit, she keeps a 7-day record of her food and supplement intake, which has been analyzed using a computer program.
Question
Before she becomes pregnant, Ms. T wants to know whether her diet is optimal.
Assessment
With the caveat that 7 days is not long enough to provide accurate information on her usual nutrient intake, her mean observed intake can be evaluated relative to the DRIs. For nutrients with an Estimated Average Requirement (EAR), the nutritionist should calculate the confidence of adequacy using the algorithms described in Appendix B and summarized in this chapter. For nutrients with an Adequate Intake (AI), her intake was adequate if it was likely to exceed the AI (as concluded from the test described in this chapter), whereas no conclusive assessment can be made if her intake was below the AI. Finally, if her intake was not below the Tolerable Upper Intake Level (UL) (as concluded from the test described in this chapter), one would conclude that her usual intake is excessive and she is potentially at risk of adverse effects. This assessment is not appropriate for nutrients with highly skewed requirement distributions (e.g., iron) or large coefficients of variation (CVs) of intake (e.g., vitamin A, vitamin B12, vitamin C, and vitamin E).
Note that data on nutrient intake in relation to the DRIs are only one component of the assessment, and would be interpreted in conjunction with other types of information before counseling was offered. For example, additional information could include: her recent weight history (as an indicator of the likely adequacy of her
TABLE 3-6 Example of Assessing Dietary Adequacy of an Individual
|
Thiamin (mg) |
Riboflavin (mg) |
Folate (μg)a |
Calcium (mg) |
Phosphorus (mg) |
Vitamin D(μg) |
|
|
Mr. G's Mean Intakeb |
1.3 |
1.1 |
200 |
600c |
1,000 |
3 |
|
RDAd |
1.2 |
1.3 |
400 |
700 |
||
|
EARe |
1.0 |
1.1 |
320 |
580 |
||
|
D = Intake − EAR |
0.3 |
0.0 |
−120 |
420 |
||
|
SD Requirementf |
0.1 |
0.11 |
32 |
58 |
||
|
SD withing |
0.69 |
0.81 |
150 |
339 |
408 |
|
|
SD of Difference (D)h |
0.28 |
0.33 |
65.1 |
165 |
||
|
D/SDD |
1.07 |
0.0 |
−1.6 |
2.5 |
||
|
AIi |
1,200 |
15 |
||||
|
Intake − AI |
−600 |
−12 |
||||
|
Assessment (confidence of adequacy)j |
About 85% |
About 50% |
About 5% |
Over 98% |
||
|
Assessment (qualitative) |
Likely to be adequate |
Intake should be improved |
Intake should be improved |
No assessmentk |
Very likely to be adequate |
No assessmentk |
|
a Folate is based on μg of folate rather than Dietary Folate Equivalents for this example. b Average of 7 days of intake. c If Mr. G's mean calcium intake had been 1,300 mg instead of 600, one could determine whether intake was adequate after calculating the z-statistic (1,300 − 1,200)/128, where 128 is obtained as 339/7 days. In this case, the resulting z-statistic would have been 0.78, and one would be unable, at any reasonable level of assurance, to conclude that Mr. G's calcium intake is adequate. d RDA = Recommended Dietary Allowance. e EAR = Estimated Average Requirement. f Estimated as EAR × CV. g See Appendix Table B-2. h The standard deviation (SD) of the difference i AI = Adequate Intake. j Estimated using the algorithms described in Appendix B; see the Appendix for details of these calculations. k One should use clinical judgment to obtain additional information if intake appears to be extremely low relative to the AI. |
||||||
energy balance); other information about her diet (to determine how typical her intake was during the 7-day period); whether Ms. T was consuming fortified foods or supplements containing 400 μg of folate (as recommended for women capable of becoming pregnant), a recommendation distinct from the Recommended Dietary Allowance (RDA) and intended to minimize the risk of neural tube defects; and additional information about her lifestyle (e.g., physical activity, use of alcohol).
SUMMARY
The Dietary Reference Intakes (DRIs) can be used in assessment of the apparent adequacy or excess of an individual's dietary intake. Such an assessment requires using the individual's observed mean intake as an estimate of long-term usual intake and using the Estimated Average Requirement (EAR) of the appropriate life stage and gender group as an estimate of the individual's requirement.
For nutrients with an EAR and Recommended Dietary Allowance (RDA), the individual's observed intake in conjunction with measures of variability of intakes and requirements can be used to assess the likelihood of inadequacy. For nutrients with an Adequate Intake (AI), the z-test described above for the AI can be applied to determine if usual intakes are at or above the AI and can thus be assessed as adequate. For nutrients with a Tolerable Upper Intake Level (UL), the method described above for the UL can be used to determine with a given degree of confidence whether an individual's usual intake is truly below the UL, and therefore is not at risk of adverse health effects.
Remember that in all cases, the individual assessments should be interpreted cautiously, in combination with other types of information.


