
4
Using the Estimated Average Requirement for Nutrient Assessment of Groups
This chapter describes the use of Estimated Average Requirements (EARs) for assessing the nutrient intakes of groups. It begins with a basic discussion of how to assess conceptually the prevalence of inadequate nutrient intakes and then develops statistical approaches for estimating this prevalence. For some nutrients (those with Adequate Intakes [AIs] rather than EARs such as calcium, vitamin D, fluoride, pantothenic acid, biotin, and choline), the amount and quality of data currently available for both nutrient intakes and requirements may not be sufficient to apply these statistical models in their entirety for purposes of research and policy. Moreover, in addition to assessing nutrient intakes, assessment of health and nutritional status of groups or individuals must include biochemical, clinical, and anthropometric data.
INTRODUCTION
Individuals in a group vary both in the average amounts of a nutrient they consume and in their requirements for the nutrient.
To accurately determine the proportion of a group that has a usual intake of a nutrient less than the requirement, information on both usual intakes and nutrient requirements for each individual in the group is needed. With this information, assessing how many individuals have intakes that do not meet their individual requirements is straightforward. They can just be counted. That is, determine whether each person 's usual intake is below his or her require-
ment, and then count the number of people in the group who do not meet their requirement.
|
What proportion of individuals in a group has a usual intake of a nutrient that is less than the requirement for that nutrient? This is one of the most basic questions that can be asked about nutrient intakes, and is critically important from a public health perspective. Clearly, the implications would differ if 30 versus 3 percent of individuals in the population had usual intakes that were inadequate to meet estimated needs. Presented in this chapter is an abbreviated description of a statistical approach to estimating the prevalence of inadequate intakes—the probability approach and a shortcut to the probability approach referred to as the EAR cut-point method. Both of these require the use of the EAR. |
Consider a purely hypothetical example of a group comprised of 24 individuals, whose intakes of and requirements for a nutrient are known. The data for these individuals are plotted in Figure 4-1.
In this figure, the 45° line represents the points at which intake equals requirement. The individual labeled “A” in the plot has an intake of the nutrient of 7 units and a requirement for the nutrient of 11 units. Points that fall below (or to the right of) the 45° line are for individuals whose usual intakes are greater than their requirements, whereas points above (or to the left of) the line (the shaded area) are for individuals whose usual intakes are less than their requirements. Six individuals have inadequate intakes, corresponding to the six points above the line. Thus, for this group, the prevalence of inadequate intakes is (6/24) × 100, or 25 percent.
A second example illustrates the same approach with a larger sample. Figure 4-2 shows hypothetical intakes and requirements for a nutrient in a group of 3,000 people. Both the requirement distribution and the intake distribution are assumed to be normal, and not correlated. That is, people who have high requirements do not have a tendency to consume more and thus have greater intakes. The average requirement for the nutrient is 1,200 units and the standard deviation of the requirement is 180 units. The mean of the usual intakes of 3,000 people is 1,600 units and the standard deviation for intake for this group is 450 units. Note that the average usual intake (1,600) is greater than the average requirement (1,200) and that there is more variability (spread) in intakes than there is in requirements. This is the usual situation for most nutrient intakes and requirement distributions.
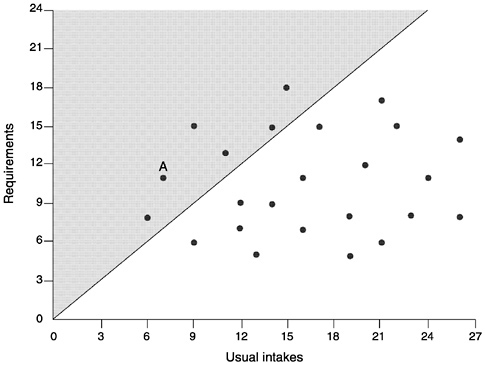
FIGURE 4-1 Plot of usual intakes and requirements of 24 hypothetical individuals in a group. The 45° line represents the points where nutrient intake equals nutrient requirement. Thus, the points to the right of the line are those individuals whose intakes are greater than their requirements. The points to the left of the line (the shaded area) are those individuals whose intakes are less than their requirements.
As before, the 45° line in Figure 4-2 denotes those individuals whose usual intake equals their own requirement. Determining the proportion of individuals in the population with inadequate intakes is simply done by counting how many points fall above the line (the shaded area).
|
Note from this example: Even though the average usual intake is 25 percent higher than the average requirement (1,600 vs. 1,200 units), some people in the population still have intakes below their requirements. Simply comparing the average intake to the average requirement does not answer the question about how many in a group have inadequate intakes. |
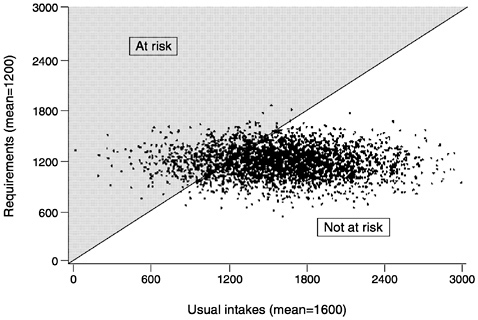
FIGURE 4-2 Plot of usual intakes and requirements of 3,000 hypothetical individuals in a population. By counting the points that fall to the left of the 45° line where intakes equal requirements (the shaded area), the proportion of the population with inadequate intakes can be determined.
Unfortunately, collecting data on the joint distribution of usual intake and requirements, such as those presented in Figure 4-1 and Figure 4-2, is impractical because rarely is an individual's requirement known (if it were, it could be used to answer the question). Therefore, rather than observing the prevalence of inadequate intakes in the group, the prevalence can only be approximated by using other methods. The next two sections describe statistical approaches to estimating the prevalence of inadequate intakes—the probability approach (NRC, 1986) and a shortcut to the probability approach called the EAR cut-point method (Beaton, 1994; Carriquiry, 1999).
THE PROBABILITY APPROACH
The data typically available for nutrient assessment include estimated univariate distributions of usual intakes for a group of individuals and information from estimated univariate distributions of nutrient requirements of other groups that are similar to the group
of interest. These univariate distributions can be combined and the prevalence of inadequate nutrient intakes can be estimated statistically by using the probability approach (NRC, 1986).
The probability approach relates individual intakes to the distribution of requirements. The probability approach applies a continuous risk-probability function to each individual's estimated intake and then averages the individual probabilities across the population or group. The first step in applying the probability approach is to construct a risk curve using the information on the requirement distribution of the group (median and variance). The risk curve specifies the probability that any given intake is inadequate for the individual consuming that intake. Figure 4-3 shows an example of a risk curve. An intake at the level of the average requirement has a probability of inadequacy of approximately 50 percent for all nutrients whose requirements follow a normal distribution.
The risk curve in Figure 4-3 is from a hypothetical nutrient requirement distribution. For simplicity, the requirements are normally distributed and the mean requirement is 100 units. Intake less than 50 units is associated with 100 percent risk of inadequacy whereas
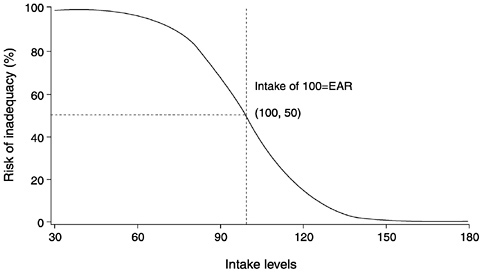
FIGURE 4-3 Risk curve from a normal requirement distribution having a mean of 100 units. Intakes less than 50 units are associated with 100 percent risk of inadequacy while intakes above 150 units have 0 percent risk of inadequacy. Intake equal to the mean requirement of 100 units has a 50 percent risk of inadequacy (the definition of the Estimated Average Requirement [EAR]).
intake greater than 150 is associated with 0 percent risk. As usual intake increases from 50 to 150 units, the risk of inadequacy associated with a specific intake declines.
The next step in the probability approach is to compare the risk curve to the distribution of usual intakes for the population to determine what proportion of the population has an inadequate intake. Figure 4-4, Figure 4-5 through Figure 4-6 illustrate the relationship between the risk curve and the distribution of usual intakes in situations representing populations with high, medium, and low probabilities of inadequate intakes.
The example in Figure 4-4 shows what would happen when the usual intake distribution has a mean of about 50, and consists almost entirely of values less than 90. Because an intake of 90 units is associated with a risk of inadequacy of about 75 percent, almost all individuals in the population have intakes that reflect high risk of inadequacy. For a population with this distribution of intakes, the probability of inadequacy is—from visual inspection of the figure—very high. The average risk of inadequacy in this population is well above 75 percent as indicated in Figure 4-4 because the vast majority of intakes are below 90.
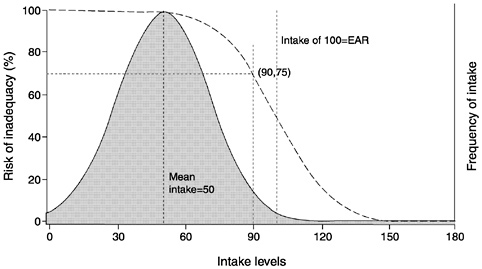
FIGURE 4-4 Risk curve combined with a usual intake distribution where the mean intake is less than the Estimated Average Requirement (EAR). The mean of the usual intake distribution is 50 units and the majority of the intake values are less than 90 units. At 90 units, the risk of inadequacy is about 75 percent. Therefore, in this population, the probability of inadequacy is high.
A second scenario shown in Figure 4-5 illustrates a different usual intake distribution with a mean of about 150 units and most of the values above 100. Most intakes fall to the right of the risk curve which translates to a lower population risk. Only individuals with intakes below 130 units (shaded area) have a risk of inadequacy above 5 percent.
More commonly though, a greater degree of overlap exists between the risk curve and the usual intake distribution. A more realistic example is provided in Figure 4-6. In this example, the usual intake distribution is for a population with a mean intake of 115 units and a standard deviation of 20 units. As expected, when the mean intake is 115 units and mean requirement is 100 units, some individuals are at risk of inadequacy (shaded area) and some are not. For example, about half of the population has a usual intake that exceeds 115 units, which is associated with a risk of 25 percent or less. An intake of 110 has about a 35 percent probability of inadequacy, an intake of 100 units (the median requirement) has about a 50 percent probability of inadequacy, and an intake of 80 units has about an 85 percent probability of inadequacy.
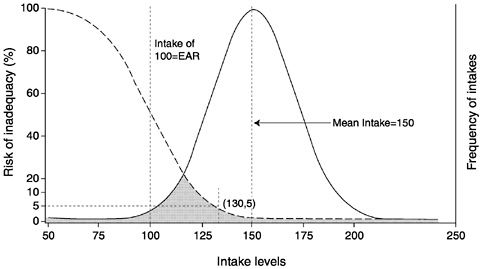
FIGURE 4-5 Risk curve combined with a usual intake distribution where the mean intake is much higher than the Estimated Average Requirement (EAR). Nearly the entire intake distribution falls to the right of the risk curve. Only those individuals in the population with intakes below 130 units have a risk of inadequate intake (shaded area).
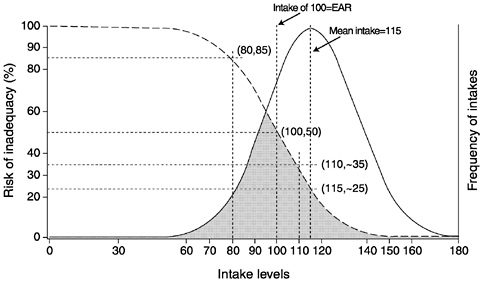
FIGURE 4-6 Risk curve combined with a usual intake distribution where mean intake (115 units) is slightly higher than the Estimated Average Requirement (EAR) (100 units). The risk curve and usual intake distribution have significant overlap. The proportion of individuals at risk of inadequacy (shaded area) at the mean intake is about 25 percent. The risk of inadequacy increases as intake becomes closer to the EAR.
Determining the prevalence of inadequate intakes for the population will depend on how many people have each particular value of intake and what the distribution of intakes looks like. Appendix C demonstrates how to carry out the necessary calculations to obtain a prevalence estimate for the group. Statistical programs (such as SAS or similar software) can be used to carry out these procedures.
Two key assumptions underlie the probability approach: (1) intakes and requirements are independent, and (2) the distribution of requirements is known. Frequently, it is assumed that the distribution of requirements is normal; however for some nutrients, such as iron for menstruating women, this assumption is not warranted (some women have very large menstrual losses of iron, which leads to a distribution that is positively skewed—i.e., more women have higher requirements than indicated by a normal distribution). For other nutrients the numbers of people for whom requirements have been experimentally determined is so small that it is just not possible to determine whether the assumption of normality is warranted (IOM, 1997, 1998b, 2000; NRC, 1986, 1989).
THE EAR CUT-POINT METHOD
The Estimated Average Requirement (EAR) cut-point method, proposed by Beaton (1994), is a shortcut derived from the probability approach described above. In contrast to the probability approach, the EAR cut-point method simply requires the distribution of requirements to be symmetrical. It is not necessary to know the actual variance of the requirement distribution, only its size relative to the intake variance. Like the probability approach, the EAR cut-point method requires knowledge of the median requirement (the EAR) for the nutrient and the distribution of usual intakes in the population.
Table 4-1 summarizes whether nutrients for which Dietary Reference Intakes (DRIs) have been established as of this writing (IOM, 1997, 1998b, 2000) meet the assumptions necessary to apply the EAR cut-point method for assessing the prevalence of inadequacy for groups.
The cut-point method is very simple. The population prevalence of inadequate intakes is computed as the proportion of the group
|
Box 4-1 The EAR cut-point method—what it is, and why it works This method is very straightforward, and surprisingly, can sometimes be as accurate as the probability approach. With this method, the population prevalence of inadequate intakes is simply the proportion of the population with intakes below the median requirement (EAR). Modest departures from any of the assumptions listed below are likely to have only a small effect on the performance of the EAR cut-point method. However, the method does not work with nutrients such as energy where it is known that intakes and requirements are highly correlated, or with iron requirements in menstruating women where the requirement distribution is known to be highly skewed rather than symmetrical. This method works well when:
|
TABLE 4-1 Summary of Nutrients to Date with Dietary Reference Intakes (DRIs), and Whether They Meet the Assumptions Necessary to Apply the Estimated Average Requirement (EAR) Cut-Point Method for Assessing the Prevalence of Inadequacy for Groups
|
Established DRIsa |
||||
|
Nutrient |
EAR |
RDA |
AI |
UL |
|
Magnesium |
+ |
+ |
+ |
|
|
Phosphorus |
+ |
+ |
+ |
|
|
Selenium |
+ |
+ |
+ |
|
|
Thiamin |
+ |
+ |
||
|
Riboflavin |
+ |
+ |
||
|
Niacin |
+ |
+ |
+ |
|
|
Vitamin B6 |
+ |
+ |
+ |
|
|
Folate |
+ |
+ |
+ |
|
|
Vitamin B12 |
+ |
+ |
||
|
Vitamin C |
+ |
+ |
+ |
|
|
Vitamin E |
+ |
+ |
+ |
|
|
Calcium |
+ |
+ |
||
|
Fluoride |
+ |
+ |
||
|
Biotin |
+ |
|||
|
Choline |
+ |
+ |
||
|
Vitamin D |
+ |
+ |
||
|
Pantothenic Acid |
+ |
|||
|
a RDA = Recommended Dietary Allowance; AI = Adequate Intake—the AI cannot be used with the EAR cut-point method; UL = Tolerable Upper Intake Level. b Although there is little information on the variance of requirements, DRIs published to date have assumed a coefficient of variation ( CV) of 10 or 15 percent. Variance of intake as calculated from the Continuing Survey of Food Intakes by Individuals 1994– 1996 indicates that for all nutrients, intake variance is well above the assumed requirement variance. |
||||
with intakes below the median requirement (EAR). In the example used when discussing the probability approach, population prevalence according to the EAR cut-point method would be the proportion of individuals with usual intakes below 100 units, the EAR.
Figure 4-7 illustrates the EAR cut-point method. The shaded area corresponds to the proportion of individuals in the group whose intakes are less than the EAR and the unshaded area corresponds to the proportion with usual intakes greater than the EAR. A discussion of why this approach works follows.
|
Meets the Assumptions of the Cut-Point Method |
|||
|
Variance of Intake is Greater than Variance of Requirementb |
Requirement Distribution Symmetricalc |
Intake and Requirement Independent or Have Low Correlation |
CV of the Requirementd (%) |
|
Yes |
Assumed |
Yes |
10 |
|
Yes |
Assumed |
Yes |
10 |
|
Yes |
Assumed |
Yes |
10 |
|
Yes |
Assumed |
Yes |
10 |
|
Yes |
Assumed |
Yes |
10 |
|
Yes |
Assumed |
Yes |
15 |
|
Yes |
Assumed |
Yes |
10 |
|
Yes |
Assumed |
Yes |
10 |
|
Yes |
Assumed |
Yes |
10 |
|
Yes |
Assumed |
Yes |
10 |
|
Yes |
Assumed |
Yes |
10 |
|
c Data to determine the shape of requirement distributions are lacking for most nutrients; therefore, symmetry is assumed unless there are data adequate to indicate otherwise. dCV of the requirement is needed for the probability approach. |
|||
Figure 4-8 shows the same hypothetical (simulated) joint distribution of intakes and requirements for the group of individuals presented in Figure 4-2. The figure includes joint intake and requirement data from 3,000 people, with a mean intake of 1,600 units and a mean requirement of 1,200 units. As before, intakes and requirements are independent (i.e., individuals with higher intakes are not more likely to have higher requirements).
As discussed earlier, the proportion of the population with inadequate intakes could be obtained simply by counting the people who
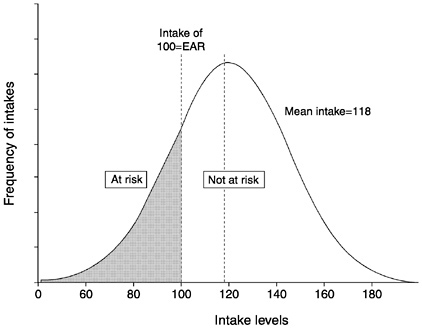
FIGURE 4-7 The Estimated Average Requirement (EAR) cut-point method. The shaded area represents the proportion of individuals in the group whose intakes are below the EAR, while the unshaded area represents the proportion with usual intakes above the EAR.
were above the 45° line. Most of the people who do not meet their requirements have intakes below 1,200 units—the median requirement, denoted in Figure 4-8 by the vertical line labeled intake = EAR. However, some individuals who have intakes greater than the EAR are still below their own individual requirements. The points for these individuals fall within the triangle-shaped area (referred to here as a triangle) A in Figure 4-8, bounded by the intake = EAR line and the 45° line to the right of the intake = EAR line. Conversely, some of the people who have intakes less than the EAR do not have inadequate intakes—even though their intakes are below the median requirement of the group, they are still exceeding their individual requirements. The points for these people fall within triangle B in Figure 4-8, bounded by the intake = EAR line and the 45° line to the left of the intake = EAR line.
Unfortunately, it is very difficult to identify individuals represented by points in triangle A (intake greater than the EAR but less than the individual requirement), because information would be needed
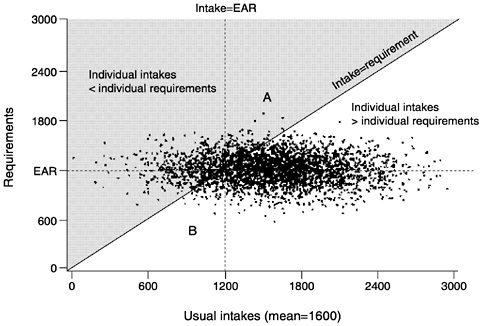
FIGURE 4-8 Joint distribution of intakes and requirements from a hypothetical population of 3,000 individuals. Intakes are independent of requirements. The mean intake is 1,600 units and the median requirement (Estimated Average Requirement [EAR]) is 1,200 units. The triangle labeled A is bounded by the intake = EAR line and the 45° line where intake = requirement. Points above the 45° line (shaded area), represent those individuals whose intakes are above the EAR, but below their own individual requirement. Individuals in triangle B have intakes below the EAR, yet above their own requirement. The number of people in triangle A is approximately equal to the number in triangle B.
on both their usual intake and their requirement and such information is rarely available. A similar number of individuals are represented by points in triangle A and in triangle B, and therefore the number above the 45° line (where intake = requirement) can be approximated by counting the number to the left of the intake = EAR line. Essentially, the EAR cut-point method substitutes the individuals in B for the individuals in A. It is easier to count the number of individuals to the left of the intake = EAR line than those above the 45° line because this only requires information on each individual's intake. Therefore, to use this method, the only information required is each individual's usual intake of the nutrient and the EAR of the group; individual requirements are not needed.
Because the number of people in triangle A is approximately equal to the number in triangle B, these two groups cancel each other out, and the proportion of the population above the 45° line (inadequate intakes, shaded area of graph) is approximately equal to the proportion of the population to the left of the intake = EAR line. In other words, the proportion of the population with intakes below their requirements (from the joint distribution approach) is about the same as the proportion of the population with intakes less than the EAR, even though some of the individuals in these two groups are not the same.
|
Box 4-2 The EAR cut-point method—when it works The EAR cut-point method works best (produces an almost unbiased estimate of prevalence of nutrient inadequacy) when:
If the true prevalence in the group is about 50 percent—so that the mean intake is approximately equal to the EAR—then the EAR cut-point method results in almost unbiased estimates of prevalence of inadequacy even if conditions 1 and 3 are not met (see Appendix D).1 The EAR cut-point method—when it does not work What happens when the assumptions required for the cut-point method are not met? In the following section, examples are provided of situations in which the assumptions do not hold. The cut-point method can either underestimate or overestimate the population prevalence of inadequacy under such circumstances.
|
The results of some preliminary simulation studies conducted to assess the performance of the EAR cut-point method in different situations are presented in Appendix D.
What Happens if Intakes and Requirements Are Not Independent?
Intakes for certain nutrients—energy for example—increase with increased needs. This leads to a situation in which individuals with higher requirements usually have higher intakes. In other words, requirements and intakes are correlated rather than independent.
The implications of this correlation for estimating the proportion of a population with inadequate intakes can be observed in Figure 4-9, which shows the scatter plot of usual intakes and requirements sloping upward, reflecting a positive correlation between intake and requirement. Note the number of data points in triangle A, which
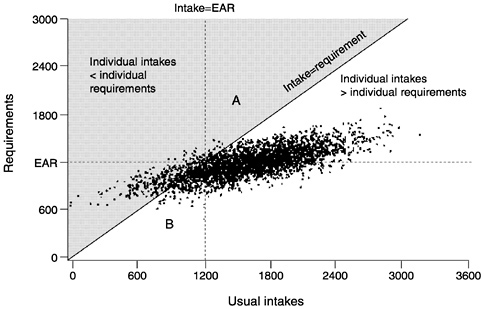
FIGURE 4-9 Intakes and requirements are positively correlated. In this scenario, the number of individuals in triangle A is less than the number in triangle B. Using the Estimated Average Requirement (EAR) cut-point method would overestimate the number of people with inadequate intakes.
represent individuals with intakes greater than the EAR, who still do not meet their requirements (they are to the right of the intake = EAR line in the shaded area above the 45° line where intake equals requirement). Next, note the number of data points in triangle B which represent individuals with intakes below the EAR but whose intakes are adequate. The EAR cut-point method works when intakes and requirements are independent (see Figure 4-8) and the number of points in triangles A and B are virtually identical. In Figure 4-9 there are more points in triangle B than in triangle A. Accordingly, when usual intake and requirement are correlated, using the EAR cut-point method (i.e., determining the number of individuals to the left of the intake = EAR line) would overestimate the number of people with inadequate intakes (those in the shaded area above the 45° line where intake = requirement).
This example is illustrative, but does not indicate what the expected bias resulting from using the cut-point method might be. The bias of the cut-point method will be severe for energy because the correlation between usual energy intakes and requirements (expenditure) is high. How severe a bias is expected if the association between intakes and requirements is not as extreme? This question is difficult to answer because usual intakes and requirements cannot be observed for a sufficiently large sample of individuals. However, limited empirical evidence suggests that the expected bias is likely to be low as long as the correlation between intakes and requirements is moderate—no larger than 0.25 or 0.30 (Carriquiry, 1999). Furthermore, when the mean intake of a group and the EAR are approximately the same, the effect of the correlation on the bias of the cut-point method is likely to be very low even at correlations greater than 0.30. An exception to this rule is the extreme case in which the correlation between intakes and requirements of the nutrient is equal to 1. In this unlikely event, the prevalence estimates obtained from the EAR cut-point method will be severely biased, even if mean intake and the EAR are identical. This purely hypothetical case is used in an illustrative example in the next section.
|
Do the probability approach and the EAR cut-point method work for food energy? No, because empirical evidence indicates a strong correlation between energy intake and energy requirements. This correlation most likely reflects either the regulation of energy intake to meet needs or the adjustment of energy expenditures to be consistent with intakes (FAO/WHO/UNU, 1985). Because of this strong correlation, neither the EAR cut-point method nor the probability approach can be used to assess the probability of inadequacy of food energy intake. |
The problem with using the EAR cut-point method for food energy can best be illustrated by considering an admittedly extreme example of both a perfect correlation between individual intakes and requirements and mean intake equal to the average requirement. Because each individual in the group has a usual intake equal to his or her requirement, the prevalence of inadequacy is zero. However, because one-half of the group has usual intakes less than the average requirement and one-half has usual intakes exceeding the average requirement, the cut-point method would estimate that 50 percent of the group is at risk of inadequate intakes when, in fact, the prevalence of inadequacy is zero.
Therefore, to assess energy adequacy, information other than intakes could be used, such as body weight for height, body mass index, or other anthropometric measures.
Situations in which nutrient intakes and requirements may be related to a third variable (e.g., energy and thiamin, body weight and protein) have not been well studied.
What Happens if the Requirement Distribution Is Not Symmetrical?
A good example of an asymmetrical requirement distribution is iron requirements in menstruating women. The iron requirement includes the need to replace urine, fecal, and dermal iron losses, and this aspect of the requirement does appear to be symmetrically distributed in the population (FAO/WHO, 1988). For menstruating women, iron lost in menstrual flow varies considerably—the mean loss averaged over 1 month has been estimated at 0.5 mg/day but about 5 percent of women have losses averaging more than 1.4 mg/day (FAO/WHO, 1988; Hallberg et al., 1966). This means that the distribution of iron requirements in women is skewed—there are more women with needs 25 percent or more above the mean, for example, than with needs 25 percent or more below the mean. In this case, the mean requirement is different from the median requirement (or EAR) in the group.
Figure 4-10 illustrates this situation, which is modeled after the information about iron requirements in women given in the FAO/ WHO report of 1988. The median requirement (EAR) is 10 mg but the distribution of requirements is not symmetrical around the
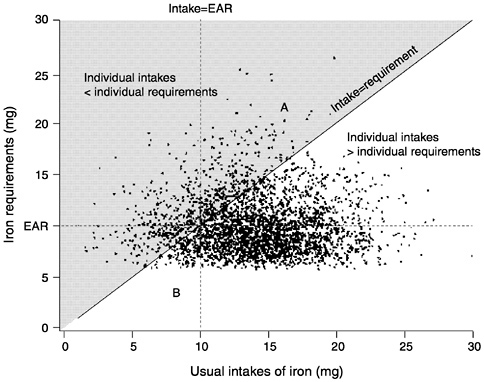
FIGURE 4-10 The distribution of requirements is not symmetrical. In this example, the number of individuals in triangle A is greater than the number in triangle B. The Estimated Average Requirement (EAR) cut-point method would result in an underestimate of the true prevalence of inadequacy. The shaded area represents individuals with usual intakes less than their requirements. The unshaded area represents individuals with usual intakes greater than their requirements.
10 mg median horizontal line; virtually no one has a requirement below about 6 mg but many have requirements above 14 mg (a similar distance from the median requirement of 10 mg). Put another way, there is a greater spread of requirements above than below the median.
In this example, more individuals are represented by points that fall in the shaded area above the 45° line where intake = requirement (and hence have inadequate intakes) than fall to the left of the intake = EAR line, where they would be estimated as being at risk by the EAR cut-point method. To continue using the triangle approach, the number of points in triangle A (greater than the EAR but still inadequate [shaded area]) is considerably greater than the number in triangle B (less than the EAR but adequate). Thus,
when the distribution of requirement is skewed, the EAR cut-point method results in a biased estimate (in this case, an underestimate) of the true prevalence of inadequacy.
|
For which nutrients are the requirement distribution not symmetrical? One nutrient for which it is known that requirements are not symmetrical about the EAR is iron in menstruating women. Because requirement data are so scarce, it is often difficult to investigate the shape of the distribution of requirements for every nutrient in every life stage and gender group. Indeed, there is virtually no information on the actual characteristics of any requirement distributions except perhaps protein in adult men and iron in adult women (FAO/WHO, 1988; FAO/WHO/UNU, 1985). |
In the absence of additional information about the shape of the requirement distribution of a nutrient, it is implicitly assumed in this report (and the DRI nutrient reports) that the unknown distribution is symmetrical around the median requirement (the EAR).
When it is known that the distribution of requirements is skewed, the full probability approach can be used by computing a risk curve that reflects the skewed requirements. The FAO/WHO (1988) adopted a log normal distribution to model iron requirements in women and applied the probability approach under the log normal assumption.
The effect of skewness on the bias of the EAR cut-point method is likely to be significant. Even moderate amounts of skewness in the distribution of requirements may result in noticeable biases in prevalence estimates with the cut-point method. Therefore, when the distribution of requirements is known to be asymmetrical, as for iron in menstruating women, the probability approach, not the EAR cut-point method, is recommended for assessing the prevalence of nutrient inadequacy.
What Happens if the Variance of Requirement Is Greater Than the Variance of Intake?
At least in North America, the situation where variation in individual requirements is greater than variation in individual usual intakes is most likely to arise for institutionalized subpopulations—for example, prison inmates or residents of a long-term care facility —who are all fed similar diets. Figure 4-11 illustrates this scenario:
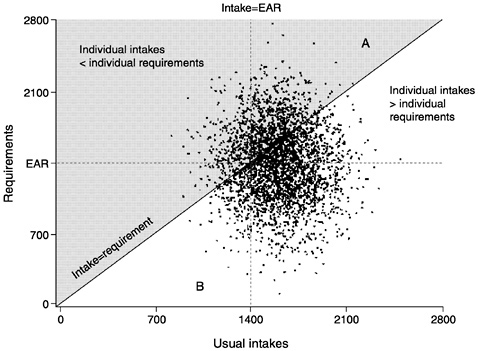
FIGURE 4-11 The variance of requirements is greater than the variance of intakes. In this case, the number of individuals in triangle A is greater than the number in B. The Estimated Average Requirement (EAR) cut-point method would underestimate the true prevalence of inadequacy. Points in the shaded area represent individuals with usual intakes below their requirements while points in the unshaded area represent individuals with usual intake above their requirements.
the median requirement (EAR) has been set at 1,400 units and the mean of the usual intake distribution has been set at 1,600 units. Note that although the mean intake exceeds the median requirement, there is much more spread in requirements than there is in intake.
The proportion of the population with inadequate intake (i.e., points in the shaded area above the 45° line where intake = requirement) is not the same as the proportion whose intake falls to the left of the intake = EAR line (estimated as being at risk using the cut-point method). The number of points in triangles A and B is different, with more points in triangle A than in triangle B. This means that the cut-point method, in this example, would underestimate the proportion of the population with inadequate intakes.
The bias resulting from the use of the cut-point method here is rather noticeable; thus, caution needs to be exercised when using the EAR cut-point method in situations in which requirements for a nutrient may be more variable than intakes of the nutrient.
The extent and direction of the bias that occurs when requirements are more variable than intakes will differ depending on whether the mean intake is above (as in Figure 4-11), equal to, or below the mean requirement. Carriquiry (1999) assessed the expected bias in several of these scenarios using a limited simulation study in which the relative sizes and standard deviations of the mean intake and the mean requirement were varied. The results suggest that in situations where the variance of requirement exceeds the variance of usual intake, the following cases arise:
-
When mean intake equals median requirement, use of the EAR cut-point method accurately estimates the proportion of the population with inadequate intakes.
-
When mean intake exceeds median requirement, use of the EAR cut-point method underestimates the proportion with inadequate nutrient intake.
-
When mean intake is less than median requirement, use of the EAR cut-point method overestimates the proportion with inadequate nutrient intake.
-
In the last two cases, the bias in the prevalence estimate can be significant even when the standard deviation of requirements is only slightly larger than the variation of usual intakes. The over- or underestimation of true prevalence is more pronounced when the true prevalence in the group is either very low or very high.
ADJUSTING INTAKE DISTRIBUTIONS
Regardless of the method chosen to assess prevalence of inadequate nutrient intakes in a group of individuals, information is required about the distribution of intakes of the nutrient in the group. Because the chronic effect of diet on an individual's well being is often of interest, the estimation of the distribution of long-term average intakes—that is, usual intakes—for the group is a concern. The usual intake distribution of a dietary component should have a spread (or variance) that reflects the individual-to-individual variation of intakes of that nutrient within the group.
Usual intake distributions can be estimated by adjusting the distribution of the mean of a few days of intake of each individual in the group. This general method was proposed by the National Research
Council (NRC, 1986) and was further developed by Nusser et al. (1996). As described below, to apply these methods of adjusting intake distributions it is necessary to have at least two independent 24-hour recalls or diet records for at least some individuals in the group (or at least three days when data are collected over consecutive days). Independent observations are obtained by collecting intake data over nonconsecutive days.
Reasons for Adjusting Intake Distributions
Several characteristics of dietary intake data make estimating the distribution of usual intakes for a group a challenging problem. This section focuses on the need for adjustment of distributions, illustrates the use of two of the most widely used approaches, and discusses the consequences of poorly estimating usual intake distributions.
Dietary intake data have characteristics that need to be taken into account when estimating the usual intake distribution of a nutrient for a group of individuals. If intake distributions are not properly adjusted, the prevalence of nutrient inadequacy will either be overestimated or underestimated, regardless of whether the probability approach or the cut-point method is chosen.
|
Should the distribution of observed intakes be used as an estimate of the usual intake distribution? No. Although the mean of the distribution of observed intakes in the group is an unbiased estimate of the mean usual intake in that group (assuming that intakes have been accurately measured), the variance of the distribution of observed intakes is almost always too large (NRC, 1986; Nusser et al., 1996). This is because it includes both the within-person (day-to-day) variation and the individual-to-individual variation, thus leading to estimates of prevalence of inadequacy or excess that are likely to be higher than the true prevalence. In order to get accurate prevalence estimates, the distribution of observed intakes must be adjusted to more closely reflect only the individual-to-individual variability in intakes. |
Large Within-Person Variation in Intakes
Individuals usually vary the types and amounts of the foods they consume from day to day. This translates into a large variability in
the within-person intake of nutrients. For some nutrients, more within-person (or day-to-day) variation than between-person variation may occur. Vitamin A is a good example of this. Intake can be 5,000 retinol equivalents (RE) on a day when the individual snacked on carrots, and close to 0 RE on another day when few fruits, vegetables, and dairy products were consumed. Thus, for some nutrients, the day-to-day variability in intakes for an individual may be larger than the between-person variability in the group. For vitamin A, the within-person variability in intakes may be as much as six times larger than the between-person variability in intakes in typical North American dietary data (Basiotis et al., 1987). For other dietary components such as energy, the day-to-day variability in intakes is about as large as the between-person variability in intakes in the group (Basiotis et al., 1987; Beaton et al., 1983; Guenther et al., 1997; Liu et al., 1978; Looker et al., 1990; NRC, 1986; Nusser et al., 1996; Sempos et al., 1985). This means that if the aim is to estimate the usual intake distribution of a nutrient in a group and have its spread reflect only the between-person variation in intakes, then statistical methods that help reduce this nuisance variance must be used.
Heterogeneous Within-Person Variation in Intakes
Not only do individual intakes differ from day to day, as discussed above, but also how much they differ varies from one person to another. In addition, this variability is not completely random. Individuals with higher average intakes also tend to have more variable intakes than do individuals with lower average intakes (Nusser et al., 1996).
Skewed Intake Distributions
For most nutrients, the distribution of observed mean intakes (and presumably, the usual intake distribution as well) is skewed to the high end rather than being symmetrical. This is particularly true when intakes from supplements are included in the diet. Consider calcium as an example. Mean intake in a group might be 600 mg/day. Very few people would have intakes 500 mg or more below the mean (and it would be impossible to have an intake more than 600 mg below the mean), but there could easily be people in the group consuming intakes 500, 1,000, or even 1,500 mg above the mean. Therefore, the intake of this nutrient has a skewed, asymmetrical distribution. Because most nutrients have skewed, asymmetrical
intake distributions, statistical procedures that assume that nutrient intake data are normally distributed cannot be applied to these data.
Day-to-Day Correlation in Intake Data Collected over Consecutive Days
When intake data are collected over consecutive days, observations for an individual cannot be assumed to be independent because what is consumed on one day often affects what is consumed on the next. This effect can work several ways—the same meal may be repeated the next day (as with leftovers) or the same food may be avoided two days in a row (as with liver). In either case, the assumption of independence for within-person observations does not hold unless dietary intake data are collected several days apart. The length of time needed between observations so that independence can be assumed depends on the dietary component. For energy, for example, it suffices to space daily observations one or two days apart, but for vitamin A, which is not present in all foods, a three- to four-day gap between 24-hour recalls for the same individual might be necessary to guarantee independence among observations.
Other Survey-Related or Nuisance Effects
Dietary intake data are often collected in nationwide food consumption surveys that have a complex design and response rates under 100 percent. In these cases, each respondent carries a sampling weight that corrects that individual's importance in the sample. These weights must be carried throughout the procedure for estimating usual intake distributions if this estimated distribution is to be used to make inferences about the wider population from which the group was drawn.
Overview of Methods to Adjust Mean Intake Distributions
Because of the above attributes of dietary intake data, obtaining reliable estimates of usual intake distributions is not straightforward. The NRC, in its 1986 report, set forth the concept of a usual intake distribution, and proposed a statistical approach to adjust observed mean intake distributions to partially remove the day-to-day variability in intakes. The resulting estimated usual intake distribution has a spread that approximately reflects the between-individual variability in intakes (NRC, 1986). Aickin and Ritenbaugh (1991) pro-
posed an algorithm—called the unmixing algorithm—for adjusting vitamin A intake distributions. Nusser and colleagues (1996), Stefanski and Bay (1996), Eckert and coworkers (1997), and more recently Chen (1999) started from the method proposed by the NRC (1986) and suggested methods for estimating usual intake distributions that address different sets of characteristics of dietary intake data. Brief descriptions of two approaches, the NRC (1986) method and the method developed at Iowa State University (ISU method, Nusser et al., 1996) are provided because they are most used today (Beaton, 1994; Carriquiry et al., 1997).
Suppose that daily intake data for a group of individuals are available. These data may have been collected via 24-hour recall methods or perhaps from multiple-day diet records. For each of the individuals, multiple days of dietary intake data were recorded. Even though it is assumed here that each individual in the group has the same number of independent daily intake observations, neither of the methods described below require that each individual in the group have the same number of observations. It is possible to adjust intake distributions as long as some individuals in the group have two or more daily intake observations, even if for many of the individuals only one observation is available.
For multiple daily intake observations for each individual in the sample, it is possible to obtain, for each individual, the mean intake over the multiple days of recording. As is discussed in Chapter 3, observed mean intakes can be used as estimates of individual usual intake, albeit imprecise ones. Estimating the usual intake distribution in the group as the distribution of the observed mean intakes, however intuitively appealing, is incorrect. The individual daily intakes must be used, rather than the mean intake, in order to adjust the usual intake distribution.
The National Research Council Method to Adjust Intake Distributions
In recognizing that daily intakes for an individual vary from day to day, and that daily intake data are not normally distributed, the NRC (1986) proposed that day-to-day variability in intakes be partially removed by fitting a measurement error model to daily intake data which had been power transformed. Power transformation refers to a family of mathematical conversions that includes, for example, the square root, the cube root, and log transformations (Fuller, 1987). The power transformation reduces the skewness typically observed in the distribution of daily intakes. The measure-
ment error model establishes that, in the transformed scale, the nutrient intake observed for an individual on a day is a deviation from that individual's usual intake of the nutrient. That is,
(transformed) observed intake = usual intake + deviation from usual intake.
The simple model above is called a measurement error model (Fuller, 1987), because it states that observed intakes measure usual intakes with error. Measurement error, in a statistical sense, denotes a (random) deviation from a variable of interest—in this case the usual intake. The error is modeled as a random variable with zero mean and with a variance that reflects the day-to-day variability in intakes.
The adjustment described by the NRC method is relatively straightforward to implement, once the magnitude of the day-to-day variation in intake has been determined for the group. After any necessary transformations to ensure normality, the difference between each person's intake and the mean intake of the group is multiplied by the ratio of day-to-day variation to the total variation, and then added back to the mean intake for the group. These adjusted intakes can then be transformed back to the original scale, as appropriate, and used for further analyses.
In the NRC method the variance of the measurement error was assumed to be constant across individuals. This means that the NRC method establishes that the day-to-day variability in intakes is constant across individuals. A more general version of this basic method developed at ISU by Nusser and colleagues (1996) does not require the measurement error variance to be constant across individuals.
The Iowa State University Method to Adjust Intake Distributions
In general, the statistical method developed at ISU (Nusser et al., 1996) elaborates on the NRC method and produces estimates of usual intake distributions with good statistical properties. Details about the procedure can be found elsewhere (Guenther et al., 1997; Nusser et al., 1996). The following example illustrates how its use can affect the conclusions drawn when a dietary survey is used to assess intakes for a group.
How large a sample size, and what proportion of replicate observations are needed for the ISU method of estimating usual nutrient intake distributions? An exact answer to this question is difficult to provide. Regarding actual sample size, the performance of the ISU method improves as sample size increases; small sample sizes of
fewer than about 50 or 60 individuals result in unreliable estimates of usual intake distributions (Nusser et al., 1996). Because only the replicate observations in the sample contain information about the day-to-day variability in intakes, it is important to have a moderately large number of individuals in the replicate sample, perhaps not fewer than 30 or 40, and these individuals should be representative of the full group. Each person in this sample must have at least two independent daily intake measurements or three daily intake measurements if data are collected on consecutive days.
Carriquiry and colleagues (1997) successfully applied the ISU method to adjust intake distributions and distributions of blood biochemical measurements using data collected in the Third National Health and Nutrition Examination Survey (NHANES III), even though sample sizes for some life stage and gender groups were moderately small (fewer than 70 to 80 individuals) and the proportion of replicate observations was low (approximately 6 percent). In general however, having a minimum number of replicate records in the sample is more important than having a minimum proportion of replicate observations.
The following example is based on estimated usual intake distributions for two dietary components—phosphorus and vitamin B6—for women aged 19 through 50 years who were neither pregnant nor lactating at the time the data were collected. Only intakes from food were considered (i.e., intake from supplements is not included in these examples). The dietary intake data were collected in NHANES III, so only a small proportion of individuals in the sample had a replicate observation collected several weeks after the first. Estimated Average Requirements (EARs) have been established for the two nutrients in this example (IOM, 1997, 1998b). Using the EAR cut-point method, the proportion of women at risk of nutrient inadequacy can be estimated by computing the percentage of individuals in the group with usual intakes below the corresponding EAR.
For purposes of illustration, the usual intake distributions of phosphorus and vitamin B6 were estimated by two different approaches: (1) using only the first day of intake data for each individual in the sample; and (2) using replicate intake data (whenever available) and applying the ISU method to adjust the distribution. It is anticipated that the estimate of the usual intake distribution obtained using one day of intake data will have the incorrect variance; the variance of the estimated distribution will contain an unwanted day-to-day variability component. Therefore, estimates of the prevalence of nutrient inadequacy will be biased. The two estimates of the usual
intake distribution are shown in Figure 4-12 for vitamin B6 and Figure 4-13 for phosphorus.
The adjusted estimate of the usual intake distribution has a smaller variance than does the estimate obtained using one day of intake data. This is to be expected because one of the features of the method (and also of the method proposed by NRC) is that it partially removes the day-to-day variability in intakes. Thus, the estimated usual intake distribution obtained by applying the adjustment has a variance that reflects only the between-person variability in intakes, whereas the estimate obtained using one-day data has a variance that is inflated by day-to-day variability.
The shapes of the two distributions in Figure 4-12 are quite different. More importantly, the conclusions drawn about the proportion of individuals in the group whose intakes of vitamin B6 are inadequate also differ, depending on which estimate of the usual intake
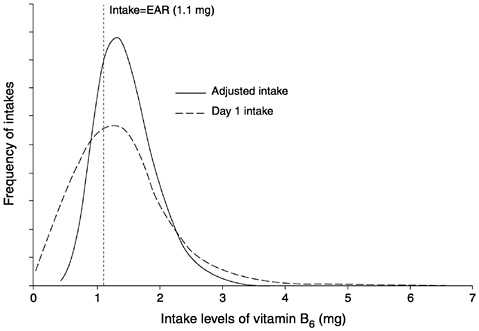
FIGURE 4-12 Estimates of a usual intake distribution of vitamin B6 obtained from one day of intake data and adjusted using replicate intake data via the Iowa State University method. The y-axis shows the likelihood of each level of intake in the population.
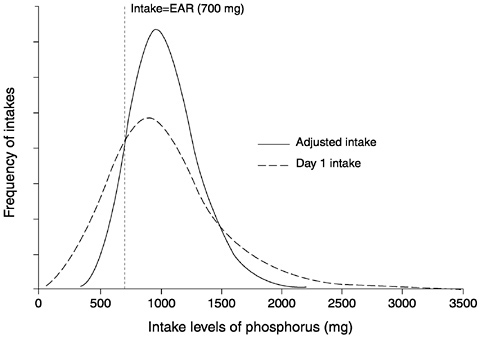
FIGURE 4-13 Estimates of a usual intake distribution of phosphorus obtained from one day of intake data and adjusted using replicate intake data via the Iowa State University method. The y-axis shows the likelihood of each level of intake in the population.
distribution is used. As was discussed previously, the prevalence of nutrient inadequacy in a group is estimated as the proportion of individuals in the group whose usual intakes are below the EAR established for the nutrient. The vertical line in Figure 4-12 represents the intake level that is equal to the EAR for vitamin B6 for women ages 19 through 50 years; this value is 1.1 mg/day (IOM, 1998b).
If only one day of intake data is available for each individual in the sample and therefore adjusting the intake distribution to remove day-to-day variability in intakes is not possible, the estimate of prevalence of inadequacy in this group of women is 37 percent. If, instead, the prevalence estimate is based on the adjusted distribution, the conclusion is that 23 percent of women are not consuming an adequate amount of vitamin B6. The 14 percent difference between the two estimates is due exclusively to the method used to estimate the usual intake distribution. Using a single day of intake
data for each individual in the sample is indefensible from a statistical viewpoint if the objective is to estimate prevalence of inadequacy.
Results from the same analyses applied to phosphorus intakes are shown in Figure 4-13. For phosphorus, prevalence of inadequacy estimates computed from the one-day and the adjusted intake distributions are 25 and 11 percent, respectively.
In these two cases (where the means of the intake distributions are greater than the EAR), the bias in the prevalence estimate that results from not removing the day-to-day variability in intakes leads to an overestimation of the proportion of individuals in the group whose intakes are inadequate. This is not always so; if the mean of the usual intake distribution is less than the EAR, using the one-day distribution to estimate prevalence may result in underestimation.
INAPPROPRIATE APPROACHES FOR GROUP-LEVEL ASSESSMENT USING THE RDA
|
Should the Recommended Dietary Allowance (RDA) be used to assess the proportion of individuals in a group who are at risk of nutrient inadequacy? No. Estimating prevalence of nutrient inadequacy in a group by computing the proportion in the group with intakes below the RDA always leads to an overestimation of the true prevalence of inadequacy. |
By definition, the RDA is the intake level that exceeds the requirements of a large proportion of individuals in the group. In fact, when requirements in the population are distributed as normal random variables, the RDA exceeds the requirement of more than 97 percent of all individuals in the group.
As indicated previously in this chapter, the proportion of individuals in a group with nutrient intakes below their requirements can be estimated by using the Estimated Average Requirement (EAR) cut-point method (calculating the proportion of individuals in the group with intakes below the EAR). Examples were presented in which the cut-point method was shown to perform well. That is, when populations were simulated for which both nutrient intakes and requirements were known, approximately the same prevalence estimates resulted either by counting the actual number of individuals with nutrient intakes below their requirements or the number of individuals with intakes less than the EAR.
It is evident, then, that comparing usual nutrient intakes with the RDA, which by construction is always larger than the EAR (i.e., RDA = EAR + 2 standard deviations of requirements), will lead to estimates of inadequacy that are too large.
Comparing Group Mean Intakes with a Percentage of a Reference Value
Some of the most common mistakes in evaluating dietary data arise from comparisons of mean intakes with RDAs. In particular, when studies find group mean intakes equal to or exceeding the RDA, the conclusion has often been that group diets are adequate and conform to recognized nutritional standards. Sometimes, group-mean intake is even compared with some percentage of the RDA. However, these comparisons are inappropriate and may result in very misleading conclusions.
For most nutrients (except food energy), group mean intake must exceed the RDA for there to be an acceptably low prevalence of inadequate intakes. To achieve a low prevalence of inadequate intakes (e.g., such that almost all individuals would meet their requirements), the group-mean intake would need to be equal to the EAR plus two standard deviations of intake (when intakes are normally distributed). Recall that the variability of intakes usually exceeds the variability in requirements and that the RDA is equal to the EAR plus two standard deviations of requirement. Thus the group mean intake needed for there to be a low prevalence of inadequate intake must exceed the RDA. The greater the variability in usual intakes relative to variability in requirements, the greater the mean intake must be relative to the RDA to ensure that only a small proportion of the group has inadequate intakes.
It follows from the above discussion that if the group mean intake equals the RDA, a substantial proportion of the group will have intakes less than their own requirements. Even if mean intake exceeds the RDA, there may be a substantial proportion of a group with intakes less than requirements.
An even stronger caution is needed when comparing group mean intakes with the EAR. If mean intake equals the average requirement (EAR), a very high proportion of the population will have inadequate usual intake. In fact, roughly half the population is expected to have intake less than requirement (except for energy).
In summary, except for food energy, group-mean intakes must exceed the RDA to have a relatively low prevalence of inadequate intakes. In general, however, group mean intakes should not be
used to assess the prevalence of inadequate dietary intakes. It is far preferable to use the EAR cut-point method and the adjusted distribution of usual intakes to estimate the proportion of a group with inadequate intakes.
UNITS OF OBSERVATION OTHER THAN THE INDIVIDUAL
In the preceding discussion, the unit of observation implicitly assumed in the dietary assessment is the individual. What if the unit of observation is either the household or the population? Consumption data are frequently gathered for households rather than for individuals. Disappearance data (or food balance sheets) may be collected for a group or an entire population such as a country. However, published requirement estimates usually are related to individuals. For dietary assessment applications, however, estimates of nutrient requirements and nutrient intakes must be at the same level of aggregation: individual, household, or population. Appendix E suggests approaches for evaluating dietary adequacy when the unit of observation is not the individual.
SUMMARY
Assessing the proportion of a group or population that is at risk of nutrient inadequacy is an important public health and policy concern. The Dietary Reference Intake (DRI) that is relevant to this type of assessment is the Estimated Average Requirement (EAR). The probability approach, described by the National Research Council (NRC) in 1986, permits an estimation of the prevalence of inadequacy within a group by comparing intakes with the distribution of requirements. This method assumes that the correlation between intake and requirement is low and that the distribution of requirements is known. A shortcut to the probability approach—the EAR cut-point method—allows determination of the prevalence of inadequacy in a group by determining the number of individuals with intakes below the EAR. Like the probability approach, the cut-point method assumes that the correlation between intake and requirement is low and that the variability in intakes is greater than the variability of requirements. However, unlike the probability approach, the cut-point method does not require that the actual shape of the requirement distribution be known, but does require that the distribution be symmetrical. Examples demonstrated the biases that occur when the assumptions of the cut-point method are violated. Assessing the prevalence of inadequacy of iron intake in
women requires use of the probability approach because of the highly skewed nature of the requirement distribution. Because of the very high correlation between intakes and requirements, energy is the one nutrient for which neither the probability approach nor the cut-point method can be used to assess adequacy. The prevalence of nutrient inadequacy for a group will usually be overestimated by either method if dietary intake data are not adjusted for day-to-day within-person variation. Thus, a minimum of two nonconsecutive or three consecutive days of intake data on at least a representative sample of the group is needed for dietary assessment of groups.


