
This paper was presented at a colloquium entitled “Vision: From Photon to Perception,” organized by John Dowling, Lubert Stryer (chair), and Torsten Wiesel, held May 20–22, 1995, at the National Academy of Sciences in Irvine, CA.
Gain and kinetics of activation in the G-protein cascade of phototransduction
(photoreceptors/electrical response/amplification/lateral diffusion)
T. D. LAMB
Physiological Laboratory, University of Cambridge, Downing Street, Cambridge CB2 3EG, United Kingdom
ABSTRACT The guanine nucleotide binding protein (G protein) cascade underlying phototransduction is one of the best understood of all signaling pathways. The diffusional interactions of the proteins underlying the cascade have been analyzed, both at a macroscopic level and also in terms of the stochastic nature of the molecular contacts. In response to a single activated rhodopsin (R*) formed as a result of a single photon hit, it can be shown that molecules of the G-protein transducin will be activated approximately linearly with time. This, in turn, will cause the number of activated molecules of the effector protein (the phosphodiesterase) also to increase linearly with time. These kinetics of protein activation provide an accurate description of the time course of the rising phase of the photoreceptor's electrical response over a wide range of flash intensities. Recent estimates indicate that at room temperature each R* triggers activation of the phosphodiesterase at a rate of 1000 –2000 subunits·s−1. Now that a quantitative description of the activation steps in transduction has been obtained, perhaps the greatest challenge for the future is to provide a comprehensive description of the shutoff reactions, so that a complete account of the photoreceptor's response to light can be achieved.
The transduction of light into a neural signal in rod and cone photoreceptors provides an excellent example of signaling by a guanine nucleotide binding protein (G protein) cascade of reactions (1–5). First, the participating proteins are present in the outer segment at extraordinarily high concentration. Second, these proteins have been well characterized at a molecular and a biochemical level ( 2,3). Third, the molecular mechanism of activation in the cascade is known in considerable detail (1–4). Fourth, the cell's electrical response to illumination has been studied thoroughly (5), thereby providing an assay for the time course of changes in concentration of the cytoplasmic messenger cGMP (6). As a result it is now possible to model the molecular interactions underlying activation of the cascade (7). Such modeling is most appropriately performed by stochastic simulations (8) because, for any flash intensity up to several thousand photoisomerizations per rod, each disc membrane surface receives at most only one or a few photon hits. The results of the simulations (described below) agree extremely closely with macroscopic analytical approximations, and together the two approaches provide an accurate description of the rising phase of the photoreceptor's electrical response in quantitative molecular terms (7,8).
The G-Protein Cascade: Activation
The G-protein cascade of the retinal photoreceptor, and the steps contributing to its activation, are illustrated schematically in Fig. 1. The outer segment disc membranes contain the three principal proteins of the cascade: the photopigment molecule rhodopsin (R), the G-protein transducin (G), and the effector protein [E, which in the vertebrate photoreceptor is the cGMP phosphodiesterase (PDE)]. Activation of rhodopsin to R* catalyzes activation of the G-protein transducin to G*, which in turn activates the effector to E*. The activated effector E* hydrolyzes cGMP in the cytoplasm, causing closure of cGMPgated ion channels in the plasma membrane, thereby eliciting the reduction in circulating electrical current that comprises the cell's electrical response to light.
Rhodopsin is a prototypical member of the extensive family of 7-transmembrane segment receptor proteins that couple to G proteins. Rather than being activated by binding of a chemical ligand though, the excitation of rhodopsin is caused by absorption of a photon, which isomerizes a chemical ligand (11-cis-retinal) that already occupies the binding site. Within a few milliseconds of photon absorption, rhodopsin is converted to its activated form, R*, corresponding to the spectroscopic intermediate metarhodopsin II.
Mechanism of Cascade Activation. The mechanism by which R* activates the cascade is closely similar to that in other G-protein systems. The protein molecules exhibit Brownian motion, jostling around randomly in the plane of the membrane, and thereby undergoing lateral diffusion. Upon contact between an R* and a G, the G protein can be activated to G* by a ubiquitous mechanism involving the release of bound GDP and the uptake of a molecule of GTP from the cytoplasm. Having activated one molecule of G to G*, the R* is released unaltered and is free to continue diffusing laterally in the membrane. In this way, a single R* is able sequentially (or catalytically) to activate numerous molecules of G to G*, providing the first stage of amplification in the cascade.
No amplification occurs in the next step, because a single G* binds to and activates only a single molecule of effector, E. In fact, in the photoreceptor (in contrast to other G-protein cascades) the effector molecule comprises a pair of enzymatic subunits, α and β, each bearing a small γ subunit with a binding site for G* (see Fig. 1). Surprisingly, this duality appears to have no significant effect on the activation kinetics, since the two PDE subunits seem to act independently.
A second stage of amplification is provided by the activated effector E*. In the photoreceptor, as in most G-protein cascades, the effector is an enzyme (the PDE), which in this case catalyzes hydrolysis of cGMP in the cytoplasm. Phototransduction therefore comprises two cascaded stages of en-
The publication costs of this article were defrayed in part by page charge payment. This article must therfore be hereby marked “advertisement” in accordance with 18 U.S.C. §1734 solely to indicate this fact.
Abbreviations: G protein, guanine nucleotide binding protein; PDE, phosphodiesterase.
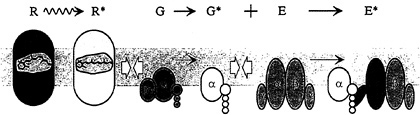
FIG. 1. Schematic diagram of activation in the G-protein cascade of phototransduction in the vertebrate photoreceptor. Receptor protein rhodopsin (R; gray) is an integral membrane protein with characteristic 7-transmembrane segment structure; it is activated to R* (metarhodopsin II; white) within a few milliseconds of photon absorption. The G-protein transducin (G; green) is a heterotrimer, which in the quiescent state has a molecule of GDP bound to its α subunit. Upon diffusional contact between R* and G (open arrows) the two proteins bind, and the Gα is enabled to release the bound GDP. Provided that GTP is present in the cytoplasm, a molecule of GTP binds to the vacant nucleotide binding site, creating the activated G·GTP. The two protein molecules then separate, with the R* unaltered; by analogy with other cascades, the G protein is thought to split, with the a-subunit Gα·GTP representing the active form G* (yellow). The PDE effector protein E (blue) is tetrameric, comprising two closely similar hydrolytic α and β subunits each with an attached inhibitory γ subunit. Upon contact between G* and E, the G* binds to the γ subunit and relieves its inhibitory influence, thereby activating E to E* (red). Because of its double-unit structure, the PDE can bind two G*s, but the two units appear to act independently. The activated PDE, E*, hydrolyzes cGMP in the cytoplasm, reducing the concentration of cGMP and thereby causing closure of cGMP-gated channels in the plasma membrane.
zymatic gain, permitting the attainment of very high overall amplification.
Inactivation. The subsequent steps involved in response inactivation and recovery are less well understood than the activation steps outlined above. Although qualitative information is available on rhodopsin phosphorylation, on the Gprotein's GTPase activity, on the decline in cytoplasmic Ca2+ concentration, and on calcium's role in activating guanylyl cyclase, there is not as yet a quantitative understanding of the way in which all these factors fit together. For this reason, the following analysis is restricted to the activation steps in phototransduction, and it therefore provides a description only of the onset phase of the response to light.
Simulation of the Diffusional Interactions Underlying Activation
The diffusional interactions of the proteins have been simulated by Monte-Carlo techniques (8), and an example is presented in Fig. 2. The molecular species are identified (Inset), and the four panels depict areas of membrane at successive times after activation of a single molecule of R*. Initially, the molecules were distributed randomly (Fig. 2A), with the G protein (green) and the effector protein (blue) present at mean concentrations of 2500 and 250 molecules per µm2, respectively, and with a single R* (white) at the center of the region.
For t > 0, the molecules underwent two-dimensional diffusion, according to the estimated lateral diffusion coefficients of the respective molecular species (see Fig. 2 legend). After 0.2 ms (Fig. 2B), the R* had contacted and activated three molecules of G protein to the excited form, G* (yellow); of these three G*s, one had contacted and bound to an effector molecule, to produce an E* (red). Subsequently, at 0.4 ms (Fig. 2C), five G*s had been activated, of which four had contacted effectors to produce E*s. Finally, after 1 ms, a total of 10 G*s and 5 E*s had been generated (Fig. 2D, illustrating the whole area of the simulation).
Although the stochastic nature of the activation reactions is evident in Fig. 2, this randomness may be appreciated more intuitively by viewing a dynamic simulation. A computer program (WALK) that provides such a simulation is available on the Internet (for details, see ref. 8 or legend to Fig. 2).
Predicted Gain and Kinetics
The simulation in Fig. 2 suffers a significant limitation due to the small number of molecules present, and already at 1 ms the activated molecules have traversed a significant fraction of the area under consideration. To extend the maximum time to 100
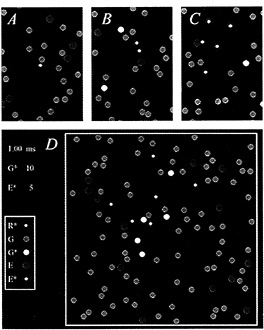
FIG. 2. Simulation of the activation of G* and E* in the G-protein cascade of phototransduction. Each panel depicts an area of membrane at successive times after activation of a single molecule of R*. (A) Time zero. (B) 0.2 ms. (C) 0.4 ms. (D) 1.0 ms. (Inset) Molecular species are identified. Single white R* was initially placed at the center of the region, and the green Gs and blue Es were randomly distributed, with mean concentrations 2500 and 250 µm−2. At time 0, the molecules began undergoing lateral diffusion, simulated by Monte-Carlo methods (8), using the estimated lateral diffusion coefficients for R*, G, G*, and E of 0.7, 1.2, 1.5, and 0.8 µm−2·s−1, respectively (4,7–8). Scale: region of simulation was ≈200 nm2, with nonabsorbing boundaries, and diameters of the R*, G, and E molecules were 3, 6, and 7 nm; pixel size, 0.4 nm; simulation time increment, 0.02 µs. Simulation was performed on an i486 machine using the program WALK (8), which is available on the Internet by anonymous FTP from the Biophysics server at molbio.cbs.umn.edu; for instructions, begin with the file “ReadMe.1st” in the directory pub/biophysics/Computer_Programs/ WALK. A Windows version (95 or 3.x) is now available on the World Wide Web, from the site http://classic.physiol.cam.ac.uk/.
ms, it is necessary to expand the area of the simulation > 100-fold to include in excess of 10,000 molecules; in practice, the computation time increases in proportion to the square of the time simulated.
The simulated time course of activation of G* and E* is shown in Fig. 3 for diffusion-limited conditions with a standard set of parameters for an amphibian rod outer segment (7,8). Fig. 3A superimposes the traces obtained for 20 simulations and demonstrates the large amount of variability obtained in successive trials due to the stochastic nature of the reactions. Fig. 3B plots the average behavior determined from 100 such simulations. For G*, the average simulated time course (solid trace) is very similar to the prediction (dashed trace) obtained from a macroscopic model based on analogy with the diffusion of heat in two dimensions (7–9). Unfortunately, no analytical model is yet available to describe the time course of activation of E* or indeed the time course of G* when activation occurs at less than the diffusion limit (see below).
Linear Time Course of E* Activation. An important feature of the simulated curves in Fig. 3 is that the numbers of activated molecules of G* and E* increase approximately linearly with time after photon arrival. Although there is slight curvature in the trace for the diffusion-limited activation of G* (which is accounted for by a logarithmic term in the analytical description), the curvature becomes less pronounced if the rate of activation drops below the diffusion limit. Thus, if there is a low probability of reaction upon each contact between R* and G, or if there is some finite delay time involved in the binding of GTP, then the activation of G* will proceed more slowly than for the upper traces illustrated in Fig. 3B; in addition, the time course will more nearly approximate a straight line.
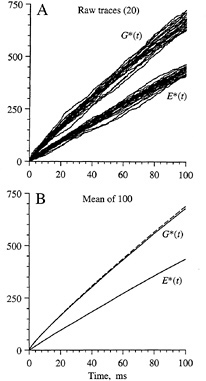
FIG. 3. Simulations obtained for a larger area of disc membrane. (A) Raw traces. Individual responses for G* and E* from the first 20 simulations are plotted. (B) Mean responses. Averages from 100 simulations are plotted as solid traces. Broken trace plots the theoretical prediction for G*, from the analytical solution to a corresponding problem for the diffusion of heat in two dimensions (7–9). The simulated area of membrane was 2 µm square, with 400 × 400 pixels at 5 nm spacing, and contained 10,000 molecules of G and 2000 molecules of E, represented as single pixels; simulation time increment, 0.5 µs. Diffusion parameters were as in Fig. 2.
For the activation of E*, it may be seen that even in the diffusion-limited case (Fig. 3) the time course is very nearly linear. This finding permits the derivation of a simple expression for the initial phase of the electrical response.
Predicted Electrical Response. The qualitative form of the activation kinetics for the proteins, and also for cGMP and the electrical response, is sketched in Fig. 4. Upon absorption of a photon, a single molecule of rhodopsin is activated to R* after a delay of a few milliseconds. Since inactivation reactions are being ignored, this R* is assumed to remain active; in reality, it will be inactivated with a time constant of a couple of seconds at room temperature (10). In the diffusion limit, molecules of G* and E* will be produced at a mean rate of about 6000 and 4000 s−1. As the quantity of activated PDE increases, the soluble cytoplasmic messenger cGMP will be hydrolyzed more rapidly, and the free cGMP concentration will decline (Fig. 4C), leading to closure of cGMP-gated ion channels and to a reduction in the fractional circulating current F(t)
To put this description on a quantitative basis, it is necessary to incorporate the linear temporal increase of E* into the differential equation for the synthesis and hydrolysis of cGMP. For the PDE, we have
E*(t) = ΦνRE(t − td) for t > td, [1]
where Φ is the number of photoisomerizations delivered at t = 0, νRE is the rate of activation of E*s by a single R*, and td is
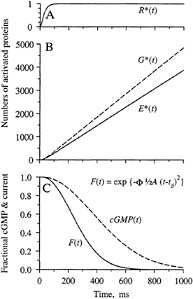
FIG. 4. Predicted time course of protein activation, cGMP concentration, and electrical response. Inactivation reactions are ignored. (A) Following photoisomerization, a single R* is activated with a delay of a few milliseconds. (B) G* and E* increase linearly with time after R* activation; the ratio of their slopes can be defined as the coupling efficiency of the reaction step G* + E → E*. (C) cGMP concentration declines as E* is activated, and consequently cGMP-gated channels close so that the fractional circulating current F(t) declines according to Eq. 4. Responses in C are shown for a flash delivering Φ = 300 photoisomerizations, with A = 0.08 s−2.
a small delay that includes the time taken for R* to be activated.
For cGMP synthesis and hydrolysis, the differential equations
[2]
where α is the rate of cGMP synthesis by the cyclase. The rate constant of cGMP hydrolysis, β, should increase in direct proportion to the number of activated molecules of PDE and may be written as
β(t) = β0 + βsubE*(t), [3]
where β0 is the residual dark activity, and βsub is the hydrolytic rate constant per activated PDE subunit.
These equations may be solved analytically, subject to two restrictions. First, it is assumed that all the parameters are constant. In practice, this restricts consideration to sufficiently early times that the cytoplasmic Ca2+ concentration is unaltered, so that the cyclase rate α remains constant at α0. Second, the flash intensity Φ must be sufficiently high (i) that longitudinal concentration gradients of cGMP can be neglected, and (ii) that the term β(t)cGMP(t) dominates in comparison with α0 − β0cGMP(t) (which is initially 0). Under these conditions, the solution for the cGMP concentration is found to have a Gaussian time course (sketched in Fig. 4).
For cGMP concentrations at or below the dark resting level, the opening of plasma membrane ion channels follows a power-law dependence on cGMP, with exponent n ≈ 2–3 (6). Application of this transformation makes no change to the underlying Gaussian time course and gives the fractional circulating current F(t) as
F(t) = exp {−ΦA(t−td)2/2} for t>td. [4]
This equation provides a single-parameter description of the rising phase of the electrical response to a flash of Φ photoisomerizations, since it transpires that all the physical parameters of the model coalesce into just one factor. This parameter, A, specifies the amplification constant of transduction and is given by
[5]
where kcat and Km are the turnover number and Michaelis constant for the fully activated PDE, Vcyto is the cytoplasmic volume of the outer segment, NAV is Avogadro's number, and BP is the cytoplasm's buffering power for cGMP (7).
Comparison with Experiment
Amphibian Rods. The predictions of Eq. 4 are compared with the experiment in Fig. 5A in suction pipette recordings from a salamander rod. In this cell, the cytoplasmic Ca2+ concentration had been buffered by incorporation of chelator, so as to minimize the influence of calcium-dependent inactivation reactions (11). Under these conditions the electrical response is well described using the single parameter A = 0.077 s−2, in conjunction with the measured flash intensities Φ. Eq. 4 has also been shown to provide a good description of the rising phase of the flash response of rod and cone photoreceptors from a variety of lower vertebrate species under control conditions (i.e., in the absence of calcium chelator) (4,7). In addition, the response–intensity relation at fixed times (not shown) is well described by a simple exponential saturation (12); this result is predicted by Eq. 4, which exhibits the form F = exp(−kΦ) at any fixed time.
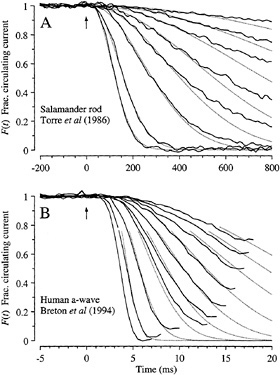
FIG. 5. Comparison of experiment and theory for onset of electrical response to light. Solid traces show the experimentally measured signal, normalized to its level in darkness, and dotted traces plot F(t) predicted by Eq. 4. (A) Suction pipette recordings of the circulating current of a salamander rod (from the experiments of ref.11). To minimize light-induced changes in calcium concentration, the calcium buffer 1,2-bis(o-aminophenoxy)ethane-N,N,N′,N′-tetraacetic acid had been incorporated into the cytoplasm via a whole-cell patch pipette. Flashes, presented at time 0, delivered from 10 to 2000 photoisomerizations. Dark current, 29 pA. Amplification constant, A = 0.077 s−2; delay time, td = 20 ms. (B) a-wave of the electroretinogram recorded from a human subject using a contact lens electrode (from the experiments of ref.12). Ganzfeld (full-field) stimulation with very brief white flashes, delivering from 400 to 128,000 photoisomerizations. Saturating a-wave amplitude, 520 µV. Amplification constant, A = 8.7 s−2; delay time, td = 2.7 ms.
Human Rod a-Wave. In Fig. 5B recordings of the rod a-wave of the human electroretinogram (12) are compared with the predictions of Eq. 4. The a-wave recordings have been truncated in time at the point where the subsequent b-wave began intruding, and they have been normalized to the maximal response, so as to provide a measure of the fractional circulating current F(t) of the rod photoreceptors that should be directly comparable with theory. Except at the very earliest times the correspondence between theoretical and experimental traces is again close, using a single parameter (A = 8.7 s−2) together with the measured flash intensities. The discrepancy at early times can be eliminated by incorporating a more realistic description of several brief delays that have been lumped together here into td (13).
For six normal observers, the a-wave families were well described by Eq. 4, for flash intensities ranging from 200 to at least 20,000 photoisomerizations per rod per flash, with a mean amplification constant of A = 7.5 s−2 (12). To illustrate the potential clinical use of the approach as a means of estimating the locus of dysfunction within living human photoreceptors, the fitting procedure was applied to the a-waves of
two patients with retinal disease (12). For a patient with retinal dystrophy, the magnitude of the circulating current was normal but the amplification constant of phototransduction was significantly reduced, while for a patient with sector retinitis pigmentosa the amplification constant was normal but the magnitude of the circulating current was reduced.
Comparison of Estimates of νRE. The rate νRE of activation of E* in response to a single R* may be estimated by substituting the measured amplification constant into Eq. 5, provided that the values of the constants are known. For amphibian rods at room temperature, recent estimates of the physical parameters are kcat = 4400 s−1 and Km = 95 µM (14), n = 2 (15), Vcyto = 1 pl, and BP = 1–2 (7), so that the term in square brackets in Eq. 5 becomes 3.8−7.6 × 10⁻⁵ s−1νRE. Adopting this factor, the mean experimental value of A = 0.076 s−2 yields a PDE activation rate of νRE = 1000–2000 E* s−1 per R* for salamander rods at 22°C.
This estimate for the rate of E* activation is within a factor of 2 of previous estimates of the rate of G-protein activation from light-scattering methods, which have given 800–1100 G* s−1 per R* at room temperature (16,17). The value is, however, considerably higher than earlier estimates obtained from PDE assays (based on the release of protons during cGMP hydrolysis), which yielded values in the region of 100–200 E* s−1 per R* at room temperature, but it seems likely that those in vitro measurements significantly underestimated the true rate. However, irrespective of the precise rate of protein activation, the form of the onset phase of the electrical response is predicted accurately by the model based on twodimensional lateral diffusion of proteins at the membrane.
The Future. Now that activation of the electrical response can be described quantitatively, a major challenge for the future will be to provide a comprehensive description of the shutoff reactions. Once the inactivation steps can be described quantitatively at a molecular level, it should be straightforward to incorporate them into the stochastic model WALK. This will enable us to paint a complete picture of the photoreceptor 's light response that includes not only the onset phase but also its recovery and the important phenomenon of light adaptation. When a comparable level of quantitative information is available for other G-protein cascades (such as the β-adrenergic and olfactory receptor mechanisms), it should similarly be possible to describe the gain and kinetics of their responses to stimulation.
I gratefully acknowledge the continued encouragement of Professor E. N. Pugh, Jr. This work was supported by grants from the Wellcome Trust (034792), the European Commission (SSS 6961), and the Human Frontiers Science Program (RG-62/94).
1. Stryer, L. ( 1991) J. Biol. Chem. 266, 10711–10714.
2. Hargrave, P. A., Hofmann, K. P. & Kaupp, U. B., eds. ( 1991) Signal Transduction in Photoreceptor Cells (Springer, Berlin).
3. Hofmann, K. P. & Heck, M. ( 1995) in Biomembranes II, ed. Lee, A. G. (JAI Press, Greenwich, CT), in press.
4. Pugh, E. N., Jr., & Lamb, T. D. ( 1993) Biochim. Biophys. Acta 1141, 111–149.
5. Baylor, D. A. ( 1996) Proc. Natl. Acad. Sci. USA 93, 560–565.
6. Yau, K.-W. & Baylor, D. A. ( 1989) Annu. Rev. Neurosci. 12, 289–327.
7. Lamb, T. D. & Pugh, E. N., Jr. ( 1992) J. Physiol. 449, 719–757.
8. Lamb, T. D. ( 1994) Biophys. J. 67, 1439–1454.
9. Jaeger, J. C. ( 1942) Proc. R. Soc. Edinburgh 61A, 223–228.
10. Pepperberg, D. R., Cornwall, M. C., Kahlert, M., Hofmann, K. P., Jin, J., Jones, G. J. & Ripps, H. ( 1992) Visual Neurosci. 8, 9–18.
11. Torre, V., Matthews, H. R. & Lamb, T. D. ( 1986) Proc. Natl. Acad. Sci. USA 83, 7109–7113.
12. Breton, M. E., Schueller, A. W., Lamb, T. D. & Pugh, E. N., Jr. ( 1994) Invest. Ophthalmol Visual Sci. 35, 295–309.
13. Cideciyan, A. & Jacobson, S. G. ( 1996) Vision Res., in press.
14. Dumke, C. L., Arshavsky, V. Y., Calvert, P. D., Bownds, M. D. & Pugh, E. N., Jr. ( 1994) J. Gen. Physiol. 103, 1071–1098.
15. Koutalos, Y., Nakatani, K. & Yau, K. W. ( 1995) Biophys. J. 68, 373–382.
16. Vuong, T. M., Chabre, M. & Stryer, L. ( 1984) Nature (London) 311, 659–661.
17. Hofmann, K. P. & Kahlert, M. ( 1992) in Signal Transduction in Photoreceptor Cells, eds. Hargrave, P. A., Hofmann, K. P. & Kaupp, U. B. (Springer, Berlin).


