
This paper was presented at a colloquium entitled “Vision: From Photon to Perception,” organized by John Dowling, Lubert Stryer (chair), and Torsten Wiesel, held May 20–22, 1995, at the National Academy of Sciences, in Irvine, CA.
Circuitry for color coding in the primate retina
(color opponent/cone photoreceptors/ganglion cells/horizontal cells/bipolar cells)
DENNIS M. DACEY*
Department of Biological Structure, University of Washington, Box 357420, Seattle, WA 98195-7420
ABSTRACT Human color vision starts with the signals from three cone photoreceptor types, maximally sensitive to long (L-cone), middle (M-cone), and short (S-cone) wavelengths. Within the retina these signals combine in an antagonistic way to form red–green and blue –yellow spectral opponent pathways. In the classical model this antagonism is thought to arise from the convergence of cone type-specific excitatory and inhibitory inputs to retinal ganglion cells. The circuitry for spectral opponency is now being investigated using an in vitro preparation of the macaque monkey retina. Intracellular recording and staining has shown that blueON/yellow-OFF opponent responses arise from a distinctive bistratified ganglion cell type. Surprisingly, this cone opponency appears to arise by dual excitatory cone bipolar cell inputs: an ON bipolar cell that contacts only S-cones and an OFF bipolar cell that contacts L- and M-cones. Red-green spectral opponency has long been linked to the midget ganglion cells, but an underlying mechanism remains unclear. For example, receptive field mapping argues for segregation of Land M-cone signals to the midget cell center and surround, but horizontal cell interneurons, believed to generate the inhibitory surround, lack opponency and cannot contribute selective L- or M-cone input to the midget cell surround. The solution to this color puzzle no doubt lies in the great diversity of cell types in the primate retina that still await discovery and analysis.
From Cell Types to Microcircuits
The vertebrate retina is that part of the central nervous system where multiple parallel representations of the visual world first emerge. And like other parts of the brain, the retina is a beautiful and complex piece of neural machinery, although it has taken nearly 100 years for the degree and nature of its complexity to be fully appreciated. Since the anatomical renderings of Cajal (1), the basic framework of retinal circuitry has been known. But only within the last decade has it become clear that the retina contains a diversity of neural cell types comparable, in fact, to that of the cerebral cortex. Rods and two or three types of cone photoreceptors relay signals to at least 10 types of bipolar interneurons. The bipolar cells in turn contact 20–25 distinct ganglion cell types, which give rise to an equal number of parallel pathways to the visual brain. Additional networks of interneurons allow lateral interactions to modify these parallel pathways: 2 horizontal cell types, at the level of the photoreceptor–bipolar cell synapse, and 20–40 amacrine cell types at the level of the bipolar –ganglion cell synapse (2–4). Most of these cell types have not yet been studied in detail, but their existence is no longer disputed. Without doubt, understanding the functional architecture of the retinal circuitry must begin by first characterizing these cell types.
In an astounding feat of neural efficiency, all of this complex circuitry is packaged in a thin, precisely laminated sheet of tissue. Each retinal cell type shows a characteristic set of physiological properties and connections with other cell types within the retinal layers. Each type also shows a characteristic density and spatial arrangement across the retina and, like a pattern of interlocking tiles, the “mosaic” of cells of a particular type forms an identifiable unit of retinal circuitry. A variety of techniques have revealed these distinctive cell mosaics (5) and the synaptic links among them. From this work it has become clear that the diverse retinal cell types are the building blocks of multiple “microcircuits” that function in parallel (2,3).
The diversity of retinal cell types and associated microcircuits provides a new framework for understanding the structure and function of the primate retina and its role in the visual process. One important function of the primate retina is to transmit color-related signals, and in this paper I review recent attempts to identify the cell types and microcircuits that are responsible for the complex, color-coding receptive fields of primate ganglion cells. This work has been done in macaque monkeys, a group that shares with humans (and other Old World species) a retina that contains three-cone photoreceptor types, each maximally sensitive to a different part of the visible spectrum. The cone spectral sensitivities and many aspects of the detailed anatomy of the retina and visual pathways in macaque are virtually identical to those in humans, establishing this genus as an excellent model for the neural basis of human color vision.
Classical Labeled Line Model for Color Opponent Circuitry
At an early stage in visual coding, signals from the three-cone types combine in an antagonistic, or opponent, fashion. This crucial stage in the neural representation of color is clearly manifest in color perception (6). Two opponent channels exist: in the red–green opponent pathway, signals from long- and middle-wavelength-sensitive cones (L- and M-cones, respectively) are opposed; and in the blue –yellow pathway, signals from short-wavelength-sensitive cones (S-cones) oppose a combined signal from L- and M-cones.
A neural correlate of these perceptual opponent channels can be found in the light responses of certain ganglion cells in the macaque retina. These spectrally opponent neurons are excited by wavelengths in one region of the spectrum and inhibited by light from another part of the spectrum, typically showing, at some intermediate point, a null response where
The publication costs of this article were defrayed in part by page charge payment. This article must therfore be hereby marked “advertisement” in accordance with 18 U.S.C. §1734 solely to indicate this fact.
Abbreviations: L-cone, M-cone, and S-cone, cone photoreceptors maximally sensitive to long, middle, and short wavelengths; LED, light-emitting diode; LGN, lateral geniculate nucleus.
|
* To whom reprint requests should be addressed. |
excitation and inhibition cancel (7). Although this spectral opponency has been studied for more than 30 years, the underlying retinal circuitry remains unclear.
Wiesel and Hubel (8) were the first to suggest a simple circuitry by which color opponency could arise in macaque ganglion cells. Recording from the the lateral geniculate nucleus (LGN), the target of color-responsive ganglion cells, they reported that inputs from the different cone types appeared to be segregated to the center and the surround of the classical receptive field. Color opponency thus could arise by piggy-backing on the antagonistic center–surround organization found in many ganglion cells. For example, a red-ON/ green-OFF opponent cell would receive excitatory L-cone input to the receptive-field center and inhibitory M-cone input to the receptive-field surround. A consequence of this combined spatial and cone opponency is that this type of cell could signal achromatic luminance variation, due to center–surround spatial antagonism, and also signal chromatic change that engaged both the excitatory and inhibitory cone pathways (9). This type of spatially and chromatically opponent receptive field was labeled “Type 1” (Fig. 1).
Wiesel and Hubel (8) described a second, Type 2, opponent cell class, which also appeared to receive excitatory and inhibitory input from different cone types, but which lacked a clear center–surround organization. Instead, opposing cone inputs were distributed in spatially coextensive ON and OFF responding fields (Fig. 1). As recognized by Hubel and Wiesel and others to follow, this Type 2 receptive-field organization suggested a specialization for color coding independent of any role in spatial vision.
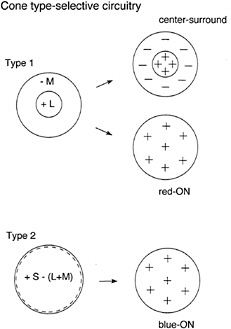
FIG. 1. Classical cone-type-specific circuitry (labeled-line model) for color opponency in ganglion cells. In the Type 1 receptive field, inputs from different cone types (L- and M-cones in this example) are segregated to the center vs. the surround of the receptive field. Type 1 cells show a center–surround antagonism to luminance changes and a spatially uniform response to full-field, equiluminant color changes (in this case an excitatory response to a shift to a longer wavelength). In Type 2 cells, opposing inputs (S-cones vs. L- and M-cones) form two spatially coextensive fields and thus lack the center–surround antagonism to luminance changes.
Clearly, although they both display opponency, Type 1 and Type 2 cells must be linked somewhat differently to cones and interneurons. In Type 1 cells, the cone inputs must be segregated spatially, while in Type 2 cells, the cone inputs are coextensive but opposite in sign. Nonetheless, the cornerstone for the circuitries of both Type 1 and Type 2 cells is the existence of labeled lines, that is, the anatomical segregation of the different cone signals from the receptors through the connecting interneurons to the ganglion cell. This labeled line model predicts a retinal circuitry that can sort out the L-and M-cone signals and deliver them with the appropriate sign to the appropriate part of the receptive field.
Identifying the Color Opponent Ganglion Cell Types
To explore the labeled line model and determine the retinal circuitry giving rise to red–green and blue–yellow opponency in ganglion cells, the ganglion cell types that transmit these signals must first be identified. In an early attempt, DeMonasterio (10), using intracellular recording and staining methods, tentatively suggested that a morphologically identified group of ganglion cells with large cell bodies, called parasol cells, were the blue-ON/yellow-OFF opponent cells and that cells with small cell bodies and small dendritic trees, called midget ganglion cells, probably transmitted red–green opponent signals. Parasol cells have since been shown to project exclusively to the magnocellular LGN layers where achromatic, nonopponent cells are recorded and so play no part in color coding. However, midget ganglion cells provide the major input to the the parvocellular layers of the LGN where both red–green and blue–yellow opponent cells are found (11,12). Thus, the midget ganglion cells came to be associated with the overall group of color opponent cells despite significant differences in the receptive-field properties of the red–green and blue–yellow opponent ganglion cells (13,14). A more direct link between anatomy and physiology requires the direct correlation of an identified ganglion cell type with a color opponent receptive field.
Studying Color Circuitry with an in Vitro Preparation. Recently developed techniques have enabled breakthroughs in linking structure to function in the retina. In pioneering studies of rabbit retina by Masland and Vaney and their colleagues (15,16), an isolated retina was maintained in vitro, and fluorescent markers were used to identify cell types under the light microscope. Targeted cells could then be intracellularly filled with dyes to reveal the cell's dendritic morphology. This in vitro approach was later applied to macaque retina (17,18) and eventually extended to combined anatomical and physiological experiments (19–22). The key to the success of this preparation is that neuronal light responses can be recorded from cell types that have been visually identified.
In macaque, the L-, M-, and S-cone spectral sensitivities are known, so the method of silent substitution can be used to identify cone inputs to a cell. With this method, two lights of differing spectral composition are alternated and their relative radiances adjusted so that the alternation between the pair of lights will give rise to a modulated response in one but not the other (the silent) cone type (23–25). We have now used this approach in macaque retina in vitro to explore circuits that underlie opponency.
Circuitry for Blue–Yellow Opponency and the Role of the Small Bistratified Cell. The first cell type studied with this approach was the small bistratified ganglion cell, one of a number of ganglion cell types that, in addition to the midget ganglion cell, projects to the parvocellular geniculate layers (26,27). The cell's distinctive dendritic tree stratifies in two separate sublayers within the inner plexiform layer (Fig. 2). The innermost tier of dendrites costratifies with the axon terminals of a cone bipolar cell type that makes exclusive
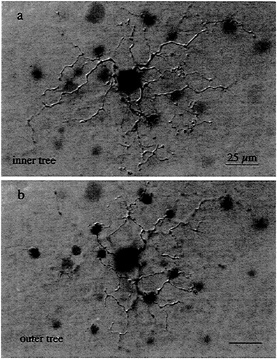
FIG. 2. Wholemount view of the dendritic morphology of the blue-ON, small bistratified ganglion cell. (a) The inner dendritic tree costratifies with the axon terminals of the “blue-cone” bipolar cell, close to the ganglion cell layer. (b) The outer dendritic tree is more sparsely branching than the inner tree and stratifies close to the amacrine cell layer. This cell was injected intracellularly with Neurobiotin, and the morphology was demonstrated by horseradish peroxidase (HRP) histochemistry.
contact with S-cone pedicles (28), suggesting a role for the bistratified ganglion cell in an S-cone signal pathway (27).
Intracellular recordings from small bistratified cells in vitro confirmed that they received S-cone signals and showed that they corresponded to a distinct blue-ON/yellow-OFF opponent cell type (21) (Fig. 3). An excitatory input from S-cones was demonstrated with chromatic and S-cone-isolating stimuli. Surprisingly, the response to offset of a yellow light was also excitatory—a fast depolarization and spike discharge. The origin of the opponent OFF component thus appears to arise from a direct excitatory input from OFF-center bipolar cells rather than from inhibition deriving from lateral interactions. Maps of the spatial structure of the yellow-OFF and blue-ON fields revealed a Type 2 receptive field, with coextensive ON and OFF regions (Fig. 4a).
The distinctive morphology of the small bistratified cell suggests a simple circuitry that could account for Type 2 opponency (Fig. 4b). A depolarizing input from the blue-cone bipolar cell would provide the excitatory S-cone ON field; similarly, an excitatory input from a second, OFF-cone bipolar type (summing L- and M-cone input) to the outer tier of dendrites could provide the coextensive yellow-OFF field. Preliminary analysis of the bipolar cell inputs to the small bistratified cell strongly supports such a circuit diagram (29). The density of the blue-ON small bistratified cells is consistent with the spatial resolution of the S-cone pathway, estimated psychophysically (30,31), suggesting that this pathway is a major carrier of S-cone signals.
Red–Green Opponency and the Role of the Midget Circuit. The proposed circuitry underlying the blue-ON/yellow-OFF
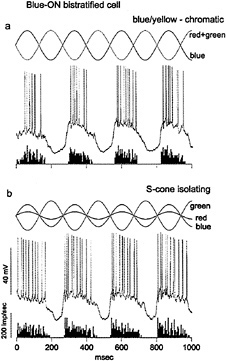
FIG. 3. Identification of strong S-cone input to the blue-ON, small bistratified ganglion cell, (a) Light-emitting diode (LED) stimulus waveform is shown at the top. Red and green LEDs are run in phase and set equal in luminance to the blue LED, run in counterphase to give a blue–yellow chromatic modulation. Membrane potential is shown in the center. The cell gives a strong ON response in phase with the modulation of the blue LED. A poststimulus time histogram of the spike discharge averaged over 10 sec is shown at the bottom, (b) Red and blue LEDs are set in counterphase to the green LED, and relative amplitudes of all three are adjusted to selectively modulate the S-cone signal. The cell response follows the phase of the S-cone excitation (solid sine wave).
cell complies with the labeled line model for Type 2 cells. The circuitry of the red–green opponent pathway remains a mystery for two reasons: (i) it has been much more difficult to study, and (ii) the labeled line model has not been completely successful in explaining observations.
In early studies of red–green spectral opponency, the evidence for cone-type-specific labeled lines to the ganglion cell receptive field center and surround was indirect. Monochromatic adapting lights were used to reduce preferentially the sensitivity of, say, the L-cone in an attempt to observe a cell 's response to the M-cone in relative isolation. This approach could not provide conclusive evidence, but more recent experiments recording from centrally located midget cells and using the silent-substitution method (32,33) support Hubel and Wiesel's original vision of a cone-type-specific colorcoding circuitry.
Strong support for the labeled line model also comes from the anatomy of central midget ganglion cells. In the central 7–10 degrees of visual field, each midget cell receives its sole excitatory connections from a single midget bipolar cell, which in turn connects to a single cone. This now well-established “private line” explains why a given midget cell responds only to one cone type (either L, or M, or S) in its receptive-field center (34,35).
The anatomy of the peripheral midget system suggests the possibility of excitatory input exclusively from L- or M-cones
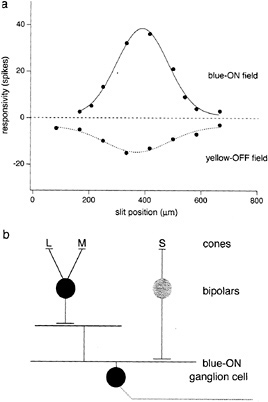
FIG. 4. Receptive-field map and simple circuitry to account for blue-ON/yellow-OFF opponency. (a) Spike discharge is plotted as a function of the position of a 25-µm slit within the receptive field. Blue-ON discharge (solid curve) was evoked by S-cone stimulus (as shown in Fig. 3); yellow-OFF discharge (dotted curve) was evoked by red + green LED luminance modulation. The cell shows spatially coextensive (Type 2) ON and OFF response fields, (b) Possible opponent circuitry: direct ON input from depolarizing blue-cone bipolar to inner dendrites and direct OFF input from hyperpolarizing “diffuse” bipolar to outer dendrites.
or some mixture of both. Beyond ≈ 10 degrees eccentricity, the dendritic trees of midget ganglion cells enlarge to attain a diameter of ≈ 150 µm in the far periphery (≈40 deg) (18,36). Surprisingly, the midget bipolar cell dendritic arbors remain small over this same retinal extent, contacting only single cones (37–39). For a midget ganglion cell to preserve a pure L- or M-cone receptive-field center, it must make connections exclusively with the appropriate midget bipolar (36,40).
I tested this possibility by recording from identified midget ganglion cells in the far retinal periphery. Fig. 5 shows a midget ganglion cell with a dendritic field diameter of about 150 µm. This cell's dendrites were stratified in the inner part of the inner plexiform layer and, as expected, gave a strong ON response to luminance modulation (Fig. 6a). The cell gave a weaker, green-ON, red-OFF response to chromatic modulation (Fig. 6b). L- and M-cone isolating stimuli revealed, however, a summed input from both cone types (Fig. 6c and d); the weak green-ON chromatic response is due to a greater weighting for the M-cone input. Thus far, almost all (19 out of 20) of our sample of peripheral midget ganglion cells have this kind of nonopponent physiology. It appears that peripheral midget ganglion cells do not make selective contact with a cone-specific subset of midget bipolar cells, and color opponency greatly diminishes or is absent in the far periphery. Variation in the strength of red–green opponency in the peripheral retina has been reported (e.g., ref.41), and several authors have pointed out a possible correspondence with well-documented perceptual losses in hue and saturation in the visual periphery (e.g., ref.42).
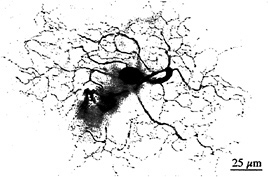
FIG. 5. Dendritic morphology of a midget ganglion cell from the retinal periphery. This cell was located 10 mm temporal to the fovea and has a dendritic field diameter of ≈ 140 µm. The cell was stratified in the inner part of the inner plexiform layer and gave an ON-center light response, illustrated in Fig. 6. The cell's morphology was demonstrated by Neurobiotin injection and horseradish peroxidase histochemistry.
Cone-Type Selective Surrounds and Horizontal Cells
A second problem with a labeled line model to explain red–green midget opponency is that at present there is no known anatomical basis for a cone-type-specific receptive-field surround. Horizontal cells, the interneurons of the outer retina, contribute to the surrounds of bipolar and ganglion cells, and certain nonmammalian horizontal cells are color
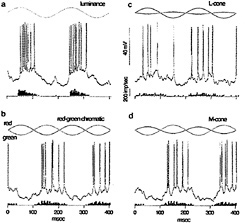
FIG. 6. Response of peripheral midget ganglion cell to luminance, chromatic, and cone-isolating stimuli (5-degree full-field stimulus). The morphology of the cell is illustrated in Fig. 5. (a) ON response to luminance modulation (red and green LEDs are run in phase). The stimulus waveform is at the top, membrane potential is in the center, and the poststimulus time histogram is at the bottom, (b) Weaker “green-ON” response to red–green chromatic modulation (red and green LEDs set equal in luminance and run in counterphase). (c) Weak ON-response to L-cone modulation (L-cone contrast = 53%). (d) ON response to M-cone modulation (M-cone contrast = 74%). Thus, both L- and M-cones provide additive nonopponent input to the receptive-field center.
opponent (43). Thus, if the labeled line model is correct, then macaque horizontal cells should also show color opponency. Previous results have led to conflicting views on this point, however. Wässle et al. (44) have shown that two distinct horizontal cell types, the H1 and H2 cells, nonselectively contact L- and M-cones and because of this, they argue, probably would not show red–green opponency. In agreement, the first recordings from H1 cells showed that they hyperpolarized to all wavelengths (45). Alternatively, Kolb and coworkers (46,47) give evidence that horizontal cells make preferential cone connections, specifically selecting for or against S-cones; they also argue for a third horizontal cell type and postulate both red–green and blue –yellow opponency in primate horizontal cells.
We directly tested whether horizontal cells show cone-typespecific opponency with in vitro intracellular recordings from both H1 and H2 cells (48). H1 cells show non-opponent additive input from L- and M-cones (Figs. 7a and 8a–d) but fail to respond to selective stimulation of S-cones (Fig. 8e). The pattern of cone connections to the H1 cells was revealed by intracellular injection of Neurobiotin which readily passes through large gap junctions and beautifully reveals the complete morphology of a local “patch” in the H1 cell mosaic (Fig. 7). The dendritic terminals of H1 cells innervate and clearly demarcate the great majority of cone pedicles. However, a small percentage, ≈ 7%, of cones in a labeled patch of H1 cells consistently lack innervation (Fig. 8f). The spacing and density of the noninnervated cones, together with the lack of response to S-cone stimulation, suggest that the H1 cells either avoid making any contact with the S-cones or contact them only infrequently.
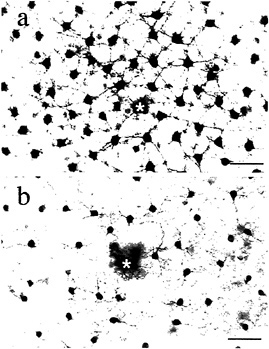
FIG. 7. Morphology of H1 and H2 horizontal cell mosaics. Neurobiotin injected intracellularly into horizontal cells passes into neighboring cells of the same type, thereby revealing a local “patch” of the horizontal cell mosaic, (a) The H1 cell mosaic: cells have relatively large cell bodies, and thick straight dendrites form a dense network. (b) The H2 cell mosaic: cells have smaller cell bodies and form a network of thin meandering dendrites. The physiology and pattern of cone contacts for each type are distinctive (illustrated in Figs. 8 and 9). Asterisks indicate the recording and injection site. (Bars = 50 µm.)
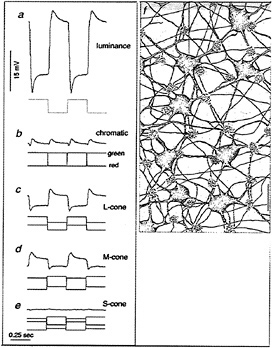
FIG. 8. Physiology and cone connections of the H1 cell mosaic. H1 cells show a hyperpolarizing response to luminance increments (a) and a null response to red–green chromatic modulation (b). H1 cells also hyperpolarize to both L-cone (c) and M-cone excitation (d) but fail to respond to selective S-cone stimulation (e). (f) Cone connections of the H1 cell mosaic illustrated in a camera lucida tracing. Flower-like clusters of dendritic terminals densely innervate and demarcate the cone pedicles (indicated by the white holes in the gray background). The great majority of pedicles are innervated but three cones in this field (approximate positions indicated by the white “holes”) lack innervation and probably correspond to S-cones. (Bar = 15 µm.)
H2 cells, like H1 cells, also receive additive input from Land M-cones (Fig. 9a–d) but respond with a strong hyperpolarization to S-cone stimulation (Fig. 9e). A striking anatomical correlate of this pattern of cone input was observed in the H2 mosaic: the great majority of cones are only sparsely innervated, but the H2 cell dendrites converge upon and densely innervate about 7% of the pedicles in a given patch, resulting in a kind of negative image of the H1 cone innervation (Fig. 9f). The spacing and density of the heavily innervated pedicles, together with the strong response of these cells to S-cone stimulation, suggests strongly that these pedicles belong to the sparse S-cone population. In sum, H1 and H2 cells show some cone-type selectivity with H1 cells avoiding and H2 cells selecting S-cone input. However, all cone inputs are of the same sign. Thus, a simple model of opponency in which bipolar and horizontal cells, respectively, mediate a cone-type-specific center and surround cannot hold for the primate retina.
Alternative Models for Red–Green Opponent Circuitry. Mixed surround mode. The lack of L- and M-cone selectivity in the peripheral midget ganglion cells and in the H1 and H2 cells seems to contradict the labeled line model but is consistent with an alternative “mixed surround ” model (9,49,50). In this model, the L- and M-cones need not be “identified” in the sense that each component of the postreceptoral circuitry is devoted to one or the other of the cone types. In the mixed
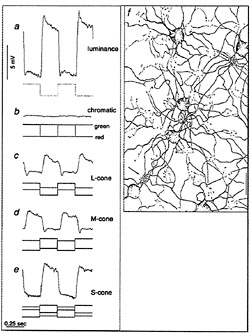
FIG. 9. Physiology and cone connections of the H2 cell mosaic. H2 cells, like H1 cells, hyperpolarize to luminance increments (a) and give a null response to red–green modulation (b). The H2 cells also hyperpolarize to L- and M-cone excitation (c and d), but in contrast with the H1 cell also hyperpolarize in response to S-cone excitation (e). (f) Cone connections of the H2 cell mosaic illustrated in a camera lucida tracing. By contrast with the H1 cell, the H2 cell dendrites contact the majority of cone pedicles (pedicles indicated as in Fig. 8) only sparsely. However, dendrites converge upon and densely innervate three pedicles (an arrow indicates one) in this field; these are presumably S-cones, which provide a strong hyperpolarizing input to the H2 mosaic. (Bar = 15 µm.)
surround model, a single cone input to the receptive-field center (as for the central midget system) along with a nonselective or mixed cone input to the surround will give good opponency because of the much greater synaptic weight given to the center. Modeled responses from hypothetical red–green cells with pure cone centers and mixed surrounds lend support to the mixed surround alternative (49). Implicit in this hypothesis is the idea that the “private line” midget system evolved in ancestral dichromatic primates to meet the anatomical requirements for the high spatial resolution of foveal vision. The more recent appearance of the separate L- and M-cone opsins in Old World species would not then require any major changes in postreceptoral circuitry but would simply take advantage of the preexisting midget circuits (40,51).
Like the labeled line model, the mixed surround model makes definite predictions about the underlying circuitry (Fig. 10). First, there should be a systematic relationship between the number of cones contributing to the receptive-field center and the degree of spectral opponency; as midget dendritic trees enlarge with increasing distance from the fovea, opponency should gradually deteriorate because of nonselective input from L- and M-cones, with nonopponent achromatic responses being the norm in the far peripheral retina. Second, the receptive-field surround, if measured in isolation, should show evidence of additive L- and M-cone input. These two predictions are thus far consistent with primate horizontal cell physiology as outlined above and with our preliminary results on the peripheral midget ganglion cells.
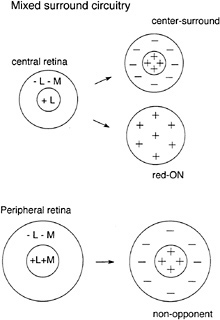
FIG. 10. Nonselective or “mixed-surround” model for red–green opponency in the midget system. In the central retina, midget ganglion cells are synaptically linked to a single cone that drives the receptivefield center; because the center is stronger than the surround, mixed cone input to the surround would still give strong opponency (in this example, L-cone input to the center gives a red-ON response despite a mixed cone input to the surround). In the retinal periphery, the midget dendritic tree enlarges to receive multiple cone inputs to the receptive field center; the lack of selectivity leads to a nonopponent response and additive input from L- and M-cones. Weak opponency could be generated by differences in the relative weights of L- and M-cone inputs.
Another model: the red–green Type 2 cell. An intriguing though more speculative hypothesis is that a ganglion cell type other than the midget cell conveys red–green opponent signals to the parvocellular LGN, perhaps corresponding to the Type 2 red –green cell that was originally hinted at in the experiments of Wiesel and Hubel (52). Identification of the Blue-ON small bistratified cell and its projection to the parvocellular LGN encourages the view that other similar ganglion cell types might exist that show red–green opponency. Other indirect support comes from the recent finding that the intercalated layers of the LGN provide a third major pathway, in addition to parvocellular and magnocellular pathways, for information flow to VI cortex (53). What kind of information is carried by this pathway? Retrograde labeling suggests that the intercalated layers project to the cytochrome oxidase “blobs” in layers 2 and 3; the blobs contain a large number of color-responsive cells (both red–green and blue–yellow) and are considered to be the main route for color signals passing to extrastriate cortex ( 54). Thus, the exciting possibility exists that there may be a set of anatomically distinct retinal pathways, including the Blue-ON cell, that transmit Type 2 color opponent signals via the intercalated layers of the LGN to the “blobs” in layers 2 and 3 of striate cortex.
Summary and Conclusions
The use of an in vitro preparation of the macaque retina has opened a door to more detailed analysis of the circuitry underlying color vision. Red–green and blue–yellow opponencies originate from distinct retinal ganglion cell types and
appear to be associated with equally distinct microcircuits. Blue-ON/yellow-OFF cells have spatially coextensive ON and OFF fields that are derived directly from ON- and OFF-center bipolar cell inputs to a bistratified dendritic tree. The blue-ON response derives from a direct excitatory input from the blue-cone bipolar cell and in this sense defines a cone-typespecific labeled line from the S-cone to the Blue-ON ganglion cell.
The midget cell system of the primate central retina has long been linked to red–green opponency, but the underlying circuitry remains a puzzle. On the one hand, physiological mapping of L- or M-cone inputs supports the labeled line model of cone type-specific connections to both the center and the surround of the midget cell receptive field. The “private line” from a single cone to a single midget ganglion cell can account for a pure cone center response. On the other hand, there is as yet no identified anatomical basis for a cone-typespecific center in the peripheral retina, where the larger receptive fields of midget ganglion cells receive convergent, additive input from both L- and M-cones. Neither is there a known anatomical basis for a cone-type-specific receptive-field surround. Horizontal cell types, believed important for surround formation, receive additive input from L- and M-cones. Thus, a simple model of opponency in which bipolar cells mediate a cone-selective center and horizontal cells mediate a cone-selective inhibitory surround must be discarded. What are the alternatives? Can the circuits of the inner retina—the connections among bipolar, amacrine, and ganglion cell types—generate selective L- and M-cone inhibitory pathways? Or is there truly a nonselective mixed surround? Finally, do other red–green (and blue-yellow) cell types and circuitries exist that remain to be discovered?
Continued electron microscopic study of the circuits of the primate fovea and more detailed physiological analysis of identified interneurons are needed to answer these questions. The retinal mechanisms for spectral opponency are likely to reside in the morphology and response properties of a few distinct bipolar and amacrine cell mosaics and their associated microcircuits. Because the first intracellular recordings from identified bipolar and amacrine cell types have been achieved (55), working out this circuitry is now a realistic and exciting goal.
I thank Barry B. Lee, Donna Stafford, Steve Buck, Joel Pokorny, and Vivianne C. Smith, who collaborated on various aspects of the in vitro studies; Pat and Keith Boro for technical help; and Christine Curcio, Kate Mulligan, Beth Peterson, Helen Sherk, and Lubert Stryer who offered helpful comments on the manuscript. This work was supported by Public Health Service Grants EY 06678 (to D.M.D.), EYO1730 (to the Vision Research Core), and RR00166 (to the Regional Primate Center at the University of Washington).
1. Ramon y Cajal, S. ( 1892) La Cellule 9, 119–257.
2. Wässle, H. & Boycott, B. B. ( 1991) Physiol. Rev. 71, 447–480.
3. Sterling, P. ( 1990) in The Synaptic Organization of the Brain, ed. Shepherd, G. M. (Oxford Univ. Press, New York), pp. 170–213.
4. Rodieck, R. W. ( 1988) in Comparative Primate Biology, ed. Steklis, H. D. (Liss, New York), Vol. 4, pp. 203–278.
5. Vaney, D. I. ( 1990) Prog. Retinal Res. 9, 49–100.
6. Lennie, P. & D'Zmura, M. ( 1988) CRC Crit. Rev. Neurobiol. 3, 333–400.
7. Kaplan, E., Lee, B. B. & Shapley, R. M. ( 1990) Prog. Retinal Res. 9, 273–335.
8. Wiesel, T. N. & Hubel, D. H. ( 1966) J. Neurophysiol. 29, 1115– 1156.
9. DeValois, R. L. & DeValois, K. K. ( 1993) Vision Res. 33, 1053– 1065.
10. DeMonasterio, F. M. ( 1979) Brain Res. 166, 39–48.
11. Leventhal, A. G., Rodieck, R. W. & Dreher, B. ( 1981) Science 213, 1139–1142.
12. Perry, V. H., Oehler, R. & Cowley, A. ( 1984) Neuroscience 12, 1101–1123.
13. Zrenner, E., Abramov, I., Akita, M., Cowey, A., Livingstone, M. & Valberg, A. ( 1990) in Visual Perception: The Neurophysiological Foundations, eds. Spillman, L. & Werner, J. S. (Academic, San Diego), pp. 163–204.
14. Shapley, R. & Perry, V. H. ( 1986) Trends Neurosci. 9, 229–235.
15. Tauchi, M. & Masland, R. H. ( 1984) Proc. R. Soc. London B 223, 101–119.
16. Vaney, D. I. ( 1985) Proc. R. Soc. London B 224, 475–488.
17. Dacey, D. M. ( 1988) Science 240, 1196–1198.
18. Watanabe, M. & Rodieck, R. W. ( 1989) J. Comp. Neurol. 289, 434–454.
19. Yang, G. & Masland, R. H. ( 1992) Science 258, 1949–1952.
20. Jensen, R. J. ( 1991) J. Neurosci. Methods 40, 101–112.
21. Dacey, D. M. & Lee, B. B. ( 1994) Nature (London) 367, 731–735.
22. Pu, M., Berson, D. M. & Pan, T. ( 1994) J. Neurosci. 14, 4338– 4358.
23. Estévez, O. & Spekreijse, H. ( 1974) Vision Res. 14, 823–830.
24. Estévez, O. & Spekreijse, H. ( 1982) Vision Res. 22, 681–691.
25. Smith, V. C., Pokorny, J., Davis, M. & Yeh, T. ( 1995) J. Opt. Soc. Am. 12, 241–249.
26. Rodieck, R. W. & Watanabe, M. ( 1993) J. Comp. Neurol. 338, 289–303.
27. Dacey, D. M. ( 1993) Vis. Neurosci. 10, 1081–1098.
28. Kouyama, N. & Marshak, D. W. ( 1992) J. Neurosci. 12, 1233– 1252.
29. Calkins, D. J., Schein, S. J., Tsukamoto, Y. & Sterling, P. ( 1995) Soc. Neurosci. Abstr. 23, 1257.
30. Green, D. G. ( 1972) J. Physiol. (London) 222, 419–426.
31. Williams, D. R. & Collier, R. ( 1983) Science 221, 385–387.
32. Reid, R. C. & Shapley, R. M. ( 1992) Nature (London) 356, 716–718.
33. Yeh, T., Lee, B. B. & Kremers, J. ( 1995) J. Opt. Soc. Am. 12, 456–464.
34. Kolb, H. & Dekorver, L. ( 1991) J. Comp. Neurol. 303, 617–636.
35. Calkins, D. J., Schein, S. J., Tsukamoto, Y. & Sterling, P. ( 1994) Nature (London) 371, 70–72.
36. Dacey, D. M. ( 1993) J. Neurosci. 13, 5334–5355.
37. Boycott, B. B. & Wässle, H. ( 1991) Eur. J. Neurosci 3, 1069–1088.
38. Milam, A. H., Dacey, D. M. & Dizhoor, A. M. ( 1993) Vis. Neurosci. 10, 1–12.
39. Wässle, H., Grünert, U., Martin, P. R. & Boycott, B. B. ( 1994) Vision Res. 34, 561–579.
40. Wässle, H., Grünert, U., Martin, P. R. & Boycott, B. B. ( 1993) in Structural and Functional Organization of the Neocortex, Experimental Brain Research Series 24, eds. Albowitz, B., Albus, K., Kuhnt, U., Northdurft, H.-Ch. & Wahle, P. (Springer, New York), pp. 94–104.
41. DeMonasterio, F. M. & Gouras, P. ( 1975) J. Physiol. (London) 251, 167–195.
42. Abramov, I., Gordon, J. & Chan, H. ( 1992) J. Opt. Soc. Am. 8, 404–414.
43. Kamermans, M. & Spekreijse, H. ( 1995) Prog. Retinal Eye Res. 14, 1–46.
44. Wässle, H., Boycott, B. B. & Röhrenbeck, J. ( 1989) Eur. J. Neurosci. 1, 421–435.
45. Dacheux, R. F. & Raviola, E. ( 1990) Proc. R. Soc. London B 239, 213–230.
46. Ahnelt, P. & Kolb, H. ( 1994) J. Comp. Neurol. 343, 387–405.
47. Ahnelt, P. & Kolb, H. ( 1994) J. Comp. Neurol. 343, 406–427.
48. Dacey, D. M., Lee, B. B., Stafford, D. K., Pokorny, J. & Smith, V. C. ( 1995) Science, in press.
49. Lennie, P., Haake, P. W. & Williams, D. R. ( 1991) in Computational Models of Visual Processing, eds. Landy, M. S. & Movshon, J. A. (MIT Press, Cambridge, MA), pp. 71–82.
50. Paulus, W. & Kröger-Paulus, A. ( 1983) Vision Res. 23, 529–540.
51. Mollon, J. D. ( 1989) J. Exp. Biol. 146, 21–38.
52. Rodieck, R. W. ( 1991) in From Pigments to Perception, eds. Valberg, A. & Lee, B. B. (Plenum, New York), pp. 83–93.
53. Hendry, S. H. C. & Yoshioka, T. ( 1994) Science 264, 575–577.
54. Merigan, W. H. & Maunsell, J. H. R. ( 1993) Annu. Rev. Neurosci. 16, 369–402.
55. Stafford, D. K. & Dacey, D. M. ( 1995) Invest. Ophthalmol. Visual Sci. 36, 13.


