
This paper was presented at a colloquium entitled “Vision: From Photon to Perception,” organized by John Dowling, Lubert Stryer (chair), and Torsten Wiesel, held May 20–22, 1995, at the National Academy of Sciences, in Irvine, CA.
Cell fate determination in the vertebrate retina
CONSTANCE L. CEPKO, CHRISTOPHER P. AUSTIN, XIANJIE YANG, MACRENE ALEXIADES, AND DIALA EZZEDDINE
Howard Hughes Medical Institute and Department of Genetics, Harvard Medical School, Boston, MA 02115
ABSTRACT In the vertebrate central nervous system, the retina has been a useful model for studies of cell fate determination. Recent results from studies conducted in vitro and in vivo suggest a model of retinal development in which both the progenitor cells and the environment change over time. The model is based upon the notion that the mitotic cells within the retina change in their response properties, or “competence”, during development. These changes presage the ordered appearance of distinct cell types during development and appear to be necessary for the production of the distinct cell types. As the response properties of the cells change, so too do the environmental signals that the cells encounter. Together, intrinsic properties and extrinsic cues direct the choice of cell fate.
The mechanisms that lead to specification of cell fates during development are starting to come into focus. It is clear that a cell responds to information from the environment and that this response depends upon the complement of genes expressed within the cell. Since gene expression varies among cells, some cells will interpret a particular environmental cue to give one fate, and another cell will interpret the same cue to give another. This is well illustrated by recent work on the response of neurepithelial cells to the secreted signaling molecule sonic hedgehog (Shh). Neurepithelial cells in the ventral spinal cord respond to Shh by becoming floorplate or motor neurons (1,2), while neurepithelial cells in the more rostral mesencephalon respond by becoming dopaminergic neurons (3). The ability of a cell to respond to a set of environmental cues can be thought of as an aspect of its “competence”. This is not to be confused with its potential, which is expressed over a greater time scale and/or through its progeny (4). For example, murine blastomeres clearly have the potential to produce all of the cell types of a mouse (5). However, early blastomeres would be incompetent to respond to cues that, for example, a retinal progenitor might respond to by making a rod photoreceptor. While it is generally appreciated that the process of development leads to progressive restriction, or gradual loss of potency, development can also be viewed as a series of changes in competence. In the central nervous system (CNS) of vertebrates, the retina is an accessible model system which recently has served to highlight the changes in competence that occur during production of a series of cell types and has allowed a description of environmental factors that elicit responses from competent retinal progenitors.
The Retina as a Model of CNS Development
The retina is a relatively simple, thin sheet of neural tissue that lines the back of the eye. More has been learned about the anatomy, physiology, metabolism, and development of the retina than any other CNS structure (6). This is due in part to the relative simplicity and accessibility of the tissue. Moreover, it is a system where total control of the input signal can be achieved. Light is the stimulus for the photoreceptor cells, the rods and the cones. Photoreceptors synapse with two types of interneurons, bipolar and horizontal cells. Further information is extracted through synapses between bipolar cells and another class of interneurons, the amacrine cells. Finally, retinal ganglion cells, the output neurons of the retina, transmit the result of all of the information processing to various target locations within the brain.
The retina must solve several problems during development (7). The proper cell types in the proper ratios must be produced, whereupon they must migrate to the proper layer, differentiate, and form synaptic connections. The earliest step in this process, production of retinal cells, is by neurepithelial cells (“progenitors”), which line the former surface of the neural tube, forming a layer known as the retinal ventricular zone. Newly postmitotic cells leave the ventricular zone and migrate relatively short and variable distances to one of three cellular layers. Newborn neurons, which make up six of the seven major classes of cells, then form synapses, almost exclusively with other retinal neurons. Effective information processing and patterning is critically dependent upon these early processes. Control over the genesis of the different cell types, as opposed to cell death, appears to contribute greatly to achieving the correct ratios of cell types. For example, retinal ganglion cells make up 2.7% of cells in the adult mouse retina, whereas rod photoreceptors account for 70% of all cells (8,9). Death occurs in ≈50% of ganglion, amacrine, and bipolar cells, whereas only 5% of photoreceptors die (10). Since the numbers of cells that die are relatively modest compared to the differences in the final numbers of each cell type, much of the control of final cell numbers must be exerted through cell genesis rather than cell death. Many of the studies of retinal development are focused on these early processes of retinal development.
Two aspects of the descriptive studies of retinal development most salient for the following discussion of cell fate determination are (i) the order of generation of retinal cell types and (ii) the lineal relationships among retinal cell types.
Retinal cells are generated in sequence, with the first becoming postmitotic as the optic cup forms. The order in which cell types are “born”, as defined by the day in which they undergo their last S phase, has been examined using [3H]thymidine labeling and autoradiography (Fig. 1). The day on which a cell undergoes its last S phase allows a strong prediction to be made concerning the type of cell that it will become. It is not clear why there is an order and why the order is as it is for any given area or species, but it is a common feature of development of the CNS. Some clues can be sought in the phylogenetic comparison of the order of birth of retinal cell
The publication costs of this article were defrayed in part by page charge payment. This article must therfore be hereby marked “advertisement” in accordance with 18 U.S.C. §1734 solely to indicate this fact.
Abbreviations: CNS, central nervous system; En, embryonic day n; Pn, postnatal day n; NF, neurofilament; CNTF, ciliary neurotrophic factor; LIF, leukemia inhibitory factor.
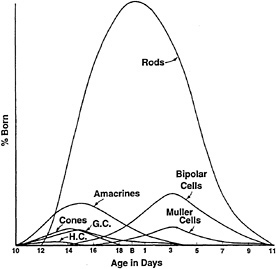
FIG. 1. Order of birth of retinal cells in the mouse retina. A pulse of [3H]thymidine was administered to animals each day during development of the retina. Mature retinae were then processed for autoradiography to reveal the labeled cells. Cells that were in S phase during the pulse would incorporate the label. Those that continued to divide would dilute the label, and those that underwent their last S phase would retain the highest levels of label. By analyzing mature retinae for the presence of heavily labeled cells, the day of birth of each cell type is revealed. The percentage of cells born on a given day that are each type is shown on the ordinate. The data shown are for mouse retina. [Modified and reproduced with permission from ref. 11 (copyright Wiley, New York).]
types in disparate species (12). It appears that there are some conserved aspects of the order of birth. For example, ganglion cells are the first born in many species. However, cones, horizontal cells, and amacrine cells can be born at about the same time, although none before the first ganglion cells. Overlap in the birth of different cell types, and extreme differences in the numbers of different cell types, preclude simple models in which there is a set order of recruitment of different cells into the different cell fates, as in the development of the Drosophila retina (13,14).
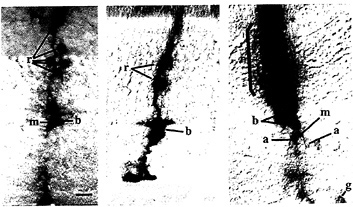
FIG. 2. Lineage analysis of rat retinal cells. P0 rat retinae (Left and Center) or an E14 mouse retina (Right) were infected in vivo with replication-incompetent retroviruses encoding either β-galactosidase (Left and Right) or human placental alkaline phosphatase (Center). At maturity, the retinae were processed histochemically to reveal the presence of infected cells, and cross-sections were made on a cryostat. Clones of infected cells are arranged radially as a result of siblings migrating radially from the ventricular zone to their final location in the indicated layers. Cells were identified on the basis of their morphology and location within the retina. Retinae are shown with the photoreceptor outer segment layer at the top of the photograph, r, rod; b, bipolar cell; m, muller glial cell; g, ganglion cell; a, amacrine cell. [Left, reproduced with permission from ref.15 (copyright Macmillan Magazines); Right, reproduced with permission from ref.16 (copyright Cell Press.]
Lineal relationships among retinal cells have been defined. Several groups have performed lineage analysis of retinae of various species using either intracellular injection of tracers or retroviruses ( Fig. 2). These studies have yielded similar results with respect to clonal composition (15–19). In all species, retinal progenitors appear to be multipotent. Infection or injection of mitotic retinal progenitors can produce clones with one to six cell types. Clones can also vary a great deal in terms of their size. In the rodent, clones composed of from 1 to 234 cells have been observed from infection at embryonic day 14 (E14).
The multipotency of retinal progenitors appears to extend to the last cell division. Clones of only two cells can consist of two different cell types. For example, in the rodent retina, cells as distinctive as rod photoreceptors and muller glia (the only nonneuronal cell type generated by retinal progenitors) can be the members of a two-cell clone (15). Even in the prenatal period of mouse development, two-cell clones can arise and consist of two different cell types (16). The only apparent exception to this is that of rod photoreceptors in mice and rats. Rods account for 70% of the cells in the rodent retina, and there are many multicellular clones (up to 33 cells in one clone) that are exclusively rods (15,16). This makes possible the hypothesis that there is a committed, mitotic progenitor that makes only rods. Lineage analysis is a technique that cannot address this issue, and other studies, described below, were undertaken to directly address it.
The observations that distinctive retinal cell types can be born at the same time and that retinal progenitor cells are multipotent favor the role of extrinsic cues in directing cell fates. However, as mentioned above, intrinsic properties of progenitor cells must contribute to choice of cell fate as well in that cells must be competent to respond to extrinsic cues to produce the appropriate cell types. To begin to define the factors making up the environment and the competence of cells to respond to these factors, we and others have undertaken studies of cell fate determination using in vitro culture systems (20–25). One of the major advantages of the retina for such studies is that it is fairly autonomous in its development. While many areas of the CNS are intimately intertwined with other areas of the CNS during development, the retina is not. It is separated from the rest of the CNS, connected only by the
optic nerve, and is not dependent upon other areas of the CNS for generation of any retinal cell type. The retina can be explanted as an intact tissue and cultured such that the correct cell types are generated and differentiate to the point where the various layers of cell bodies and synapses form (23). Even development of the outer segments of photoreceptors, a very elaborate and sensitive process, begins to occur in explant cultures. Alternatively, retinal cells can be dissociated and cultured as well-separated cells, either in tissue culture monolayers (22,25) or in three-dimensional collagen gels (21). The latter method has been used extensively by our laboratory to probe the role of cell–cell interactions during development of rod photoreceptors and ganglion cells.
The studies described below were undertaken to answer questions of retinal development at two levels. One level concerns the details of development of each cell type. The other level concerns the overall scheme of retinal development and the intrinsic properties of retinal progenitors. In regard to an individual cell fate decision, for example, for rods, we ask the following questions. What, if any, environmental factors are required for rod photoreceptor development? How do the factors interact with each other and the cell to yield rods? How many steps are there to form a rod from a mitotic, multipotent progenitor? Is there more than one type of progenitor capable of making rods, one of which is restricted to making only rods? Similar questions have been asked concerning generation of ganglion cells, amacrine cells, and bipolar cells. The overall goal is to then integrate these findings to understand how intrinsic properties of progenitors contribute to the production of each cell type. Do the original, totipotent retinal progenitors change during development? If so, how? Do these changes indicate a gain or loss of competence to respond to the environmental cues defined by the studies of each cell type? Do they indicate loss of potency to make certain cell types? A picture of the overall scheme of retinal development is beginning to emerge from these studies. Recent results will be summarized below, and a model based upon these findings will be presented.
Rod Development
In rodents, rods are born primarily in the late embryonic and early postnatal period (Fig. 1). The first known marker specific to differentiating rods is rhodopsin, the visual pigment of rod cells, composed of the apoprotein, opsin, and the chromophore, 11-cis-retinal. There can be a long delay between birth of a cell fated to be a rod and opsin expression. The earliest rods are born on E16 in the rat, but significant opsin expression does not occur until about 8 days later, on postnatal day 2 (P2) (26). When the kinetics of opsin expression was examined for cells born on P1 in the rat, it was determined that the majority took more than 4 days to turn on opsin (ref.27 and E. Morrow and C.L.C., unpublished results). These findings might suggest that the environment is limiting for opsin expression in the embryonic period and that there is a set of interactions that takes longer than 4 days, even when the environment is permissive, as it is in the postnatal period.
Watanabe and Raff (27) investigated the influence of the environment on rod photoreceptor development in vitro. They found that rat E15 cells mixed in vitro with a 50-fold excess of P1 cells were unaltered in their timing of opsin expression. However, when opsin was expressed, it was expressed by 40-fold more E15 cells than in the absence of P1 cells. These results suggest that E15 cells did not respond to the cues provided by the postnatal environment until they reached the age at which they normally express opsin. The significance of this “age” may be that it is a state of competence that allows cells to respond to environmental cues. Cells apparently cannot be hurried along the path to achieve this competence; the progression may be controlled solely by intrinsic factors, as suggested by the authors. The other finding reported in this study, that postnatal cells can raise the number of opsinexpressing cells among those that originate as E15 cells, suggests that environmental factors are limiting when E15 cells make it to this point on their own and that postnatal cells produce the limiting components.
In keeping with the findings of Watanabe and Raff (27), we observed stimulation of the number of cells expressing opsin after P2 by soluble factors produced by the retina. The stimulators were low molecular weight and heat resistant (28). Candidates for the factors are taurine (28), a derivative of cysteine, vasoactive intestinal peptide, a neuropeptide (J. LoTurco and C.L.C., unpublished results), and retinoic acid ( 29). Taurine and vasoactive intestinal peptide were found to be additive in stimulation of the number of cells expressing opsin.
Differentiation of other retinal cells, such as ganglion cells (30) and amacrine cells (31), occurs immediately upon their birth (see below). Why is there such a lengthy delay between becoming postmitotic and overt rod differentiation, and when does commitment to the rod fate occur? The definition of commitment is that the fate cannot be altered by different environments. Exposure of cells to different environments and examination of whether they still express the rod marker, opsin, is thus required to probe the issue of commitment. We have used growth factor treatment of cells in vitro for this purpose. Although we were looking for stimulatory growth factors, the factors we have defined to date are those that inhibit rod development. We found that cells normally fated to be rods according to their birthdates can be blocked from differentiating as rods.
The factors that have allowed this insight are ciliary neurotrophic factor (CNTF; ref.32) and leukemia inhibitory factor (LIF; ref.33). Treatment with either CNTF or LIF, which share a common receptor (34) and signal through the STAT family of transcription factors (35), reveals that cells that are fated to be rods according to their birthday, but which are not expressing detectable levels of opsin at the time of factor addition, can be prevented from expressing opsin (D.E., X.Y., J. LoTurco, and C.L.C., unpublished results). Treatment of cells with CNTF or LIF leads to a 5-fold stimulation in the number of bipolar cells, and thus the cells that were fated to be rods may become bipolar neurons. Cells that are expressing opsin at the time of CNTF or leukemia inhibitory factor addition are resistant in that they continue to express opsin and do not become bipolar cells. Similarly, treatment with epidermal growth factor or transforming growth factor α, which signal through the epidermal growth factor receptor to stimulate the ras pathway (36), appears to block some opsinnegative cells from becoming opsin-positive. Finally, retinal and brain extracts contain an inhibitor of rod development that similarly blocks development of opsin-positive cells (28) and stimulates bipolar development (D.E., X.Y., J. LoTurco, and C.L.C., unpublished results). This activity(ies) appears to be distinct from CNTF or other ligands that stimulate STAT phosphorylation (D. Feldheim and C.L.C., unpublished results). In addition to these data concerning treatment with inhibitors, another culture condition, culture of dissociated cells at low density, leads to a reduction in the number of opsin-positive cells and an increase in the number of bipolar cells (21).
All of the above data are consistent with the following model. Cells enter a state of competence where they can commit to the rod fate. While in this state, they interact with both inhibitory and stimulatory environmental factors to reach a decision concerning commitment to the rod fate. Commitment appears to occur in postmitotic cells, as cell division is not required for the changes that result from CNTF treatment. Immediately after commitment, cells synthesize detectable levels of opsin protein. If they fail to become committed while
in a state of competence for rod signals, due to either excess inhibition or insufficient stimulation, they may become bipolar cells. It is not clear whether this is the result of a binary decision in the sense that cells are poised to become either a rod or a bipolar. If so, then anything that favors one fate does so at the expense of the other fate. Other alternatives, such as two distinct states of competence, one for responding to factors signaling commitment to the rod fate and one for responding to signals for the bipolar fate, are also possible (as discussed below). In either case, the factors, if any, that would commit cells to the bipolar fate must not be limiting in the various culture conditions.
Ganglion Cell Development
Issues concerning differentiation in response to environment cues were investigated for ganglion cells, the first born retinal cell type (37). Cells were dissociated from E4 chickens, the time when ganglion cell genesis is near its peak (38), and were cultured at various densities suspended in a collagen gel in serum-free medium for 24 hr. A significant overproduction of cells expressing ganglion cell antigens was seen. While ≈15% of the starting population expressed ganglion cell markers, up to 70% of the cultured cells expressed ganglion cell markers after 24 hr. In vivo, the highest percentage of cells expressing the markers was about 17%. The overproduction was inversely correlated with density, suggesting that inhibition was controlling the production of cells expressing the markers. In addition, when cells were cultured as explants (intact retinae), there was only a small increase in the number of cells expressing the markers, to about 20%. Coculture experiments and transfer of conditioned medium did not lead to stimulation of marker expression in explants or high-density gel cultures, leading to the idea that contact-mediated inhibition was controlling the expression of the markers.
As the neurogenic gene Notch had been shown in Drosophila, Xenopus, and mouse to play a role in contact-mediated inhibition of neurogenesis (39), we examined whether it played a role in controlling ganglion cell genesis. Antisense and sense oligonucleotides directed against three different regions of the Notch1 gene were individually injected into chicken eyes in vivo. The antisense, but not the sense oligonucleotides, led to a 74% or greater overproduction of ganglion cells. In the peripheral retina, where development lags relative to central retina, antisense oligonucleotides led to precocious development of ganglion cells. When Notch1 RNA levels were examined, Notch1 RNA was decreased specifically. To examine if the opposite perturbation, an increase in Notch signaling, would reduce the number of cells differentiating as ganglion cells, an intracellular domain of Notch, shown to signal in a ligand-independent manner in other systems, was transduced into the retina with a retrovirus vector. Infection of early embryonic chicken eyes led to a 41–94% reduction in the number of ganglion cells relative to infection with a control virus.
One additional line of evidence supports the notion that Notch signaling is a controlling element in development of ganglion cells (37). One ligand for Drosophila Notch is the cell surface molecule, Delta. As no chicken homologue of Delta was available, we examined whether Drosophila Delta could inhibit chicken ganglion cell genesis. Coculture of chicken retinal cells with a 50-fold excess of Drosophila cells expressing Delta led to only 9% of the chicken cells expressing ganglion cell antigens. This was not due to a nonspecific effect of Drosophila cells or of generic cell–cell contact, as coculture with Drosophila cells lacking Delta led to 76% of the chicken cells expressing ganglion cell markers. Thus, at least in this case, Delta inhibited ganglion cell genesis, and presumably a chicken ligand for Notch, such as the recently identified chick Delta1 (40), plays a similar role in vivo.
We also addressed whether retinal cells from different ages varied in their competence to produce ganglion cells when placed in a low-density collagen gel environment (37). A low-density culture was made using cells taken from different days during retinal development, beginning with E2 and ending with E7. As shown in Fig. 3, cells varied greatly in their response to the low-density environment. Cells originating from E2 and E7 were very poor in their response. The peak response was obtained from cells taken from E3–E6, which corresponds to the period of ganglion cell genesis in vivo. As the cultures were made with all of the cells from each age—that is, progenitors and all postmitotic differentiating cells present at a given age—the response to the low-density environment could have been due to the environmental signals carried into the culture by the total population of cells. Alternatively, the differing responses of the progenitor cells from the different ages could have been due to intrinsic differences in progenitor cells. Mixing experiments with cells from different ages showed that the response to the low-density environment was an intrinsic property of the progenitors in the low-density environment. These data are consistent with the progenitors gaining and then losing competence to produce ganglion cells.
Are there molecular or biochemical markers that can be used to indicate that a cell has the competence to become a ganglion cell? An interesting observation concerning the expression of NFs by mitotic progenitors of the chicken retina was made several years ago by Sechrist (41) and might be a lead to such markers. Sechrist examined chicken retina for the presence of NFs using silver staining and electron microscopy. He found that ≈10% of the cells in the mitotic region of the E3–E4 chicken retina expressed NFs. He further showed that these cells had recently incorporated [3H]thymidine. We made similar observations using antisera to the low molecular weight subunit of NF to stain E5 chicken retinae pulsed for 1 hr with [3H]thymidine. We similarly found that 5–10% of cells in S phase expressed this subunit of NFs (42). In the study shown in Fig. 3, the data regarding the expression of NFs by S phase cells taken from different ages is shown. Throughout the period of ganglion cell genesis in vivo (E3–E6), which is also the period when the cells appear to be competent to respond to the low-density environment to produce ganglion cells,
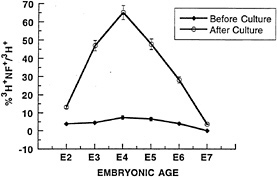
FIG. 3. Progenitors are temporally regulated in their response to low-density culture. Chicken retinae from E2 (stage 16), E3 (stage 20), E4 (stage 24), E5 (stage 27), E6 (stage 29), and E7 (stage 31) were incubated as explants for 1 hr in [3H]thymidine at 5 µCi/ml (1 Ci = 37 GBq) to label progenitor cells. They were then dissociated and cultured at low density (0.25 × 10⁵/25 µl) in collagen gels for 24 hr, stained for the ganglion cell-specific marker, low molecular weight neurofilament (NF), and developed for autoradiography. 3H+ cells that were also NF+ were scored. “Before Culture”, cells were fixed and stained immediately after dissociation; “After Culture”, cells were cultured for 24 hr, then fixed and stained. The percentage of 3Hlabeled cells that were NF+ is shown (mean ± SEM for three experiments). (Reproduced from ref.37).
there is a small percentage of mitotic cells that express NFs. This is clearly not a general feature of retinal progenitors, as virtually no mitotic cells express NFs after E7. Similarly, Sechrist (41) reports that very few progenitor cells after E4 expressed assembled NFs. Lineage analysis suggests that there is no mitotic progenitor committed to making only ganglion cells, though the data on this issue are not robust since very few ganglion cells exist in the lineage data published to date. However, it is possible that the expression of the low molecular weight NF in a subset of retinal progenitors is a marker of the competence of those cells to produce ganglion cells. The marker may be expressed only in a subpopulation of competent cells or may be expressed only in a portion of S phase in a larger group of competent cells, given that 70% of E4 progenitors are able to respond to the low-density culture environment and differentiate as ganglion cells, but only 5–10% of S phase cells express NF. The possibility that NF provides a marker of competence for any cells is strenthened when consideration of the expression of amacrine and horizontal cell markers in embryonic rat cells is considered (discussed below).
Amacrine and Horizontal Cell Development
We recently embarked upon studies of the development of amacrine cells within the rat retina. We began our studies using two monoclonal antibodies, HPC (31) and VC1.1 (43), which were reported as markers of mature amacrine cells and also possibly of horizontal cells. HPC has been shown to react with syntaxin (44), a synaptic vesicle docking protein (45), and VC1.1 has been shown to recognize an N-linked carbohydrate (46). One of the questions that we are seeking to answer in the study of each cell type is the time course of its differentiation. In staining embryonic retinae with these antibodies to answer this question, we found that both antibodies stained cells in the mitotic region of the retina. To determine whether the antibodies recognized mitotic cells, as opposed to newly postmitotic cells leaving the ventricular zone, we labeled retinae of different ages with [3H]thymidine for 1 hr and performed immunohistochemistry with HPC and VC1.1, followed by autoradiography (Fig. 4).
A high percentage of S phase cells express HPC and VC1.1 from E14 to E18, the period of horizontal and amacrine cell genesis. Are cells expressing these markers committed to producing only amacrine cells, only horizontal cells, or a mixture of the two cell types? Lineage analysis suggests that none of these is the case (15,16). Horizontal and amacrine cells are found predominantly in clones with other cell types, including those that are born after E18.
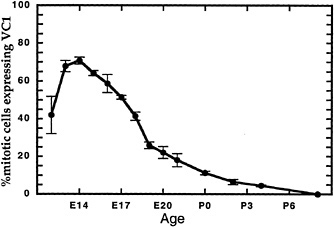
FIG. 4. VC1.1 is expressed on a subset of progenitor cells in a temporally regulated manner. Retinae explanted from rat embryos and neonates at the indicated times were pulse labeled in vitro as explants for 1 hr with [3H]thymidine. They were then dissociated and stained with monoclonal antibody VC1.1 (43), which recognizes an N-linked carbohyrate, and processed for autoradiography. The percentage of 3H-labeled cells that was reactive with VC1.1 antibody is indicated (mean ± SEM).
If amacrine and horizontal cells are not the only progeny of the mitotic VC1.1 cells, is there any specificity in the types of progeny produced by this subpopulation of progenitors? Preliminary results suggest that the postmitotic daughters of E14, E16, and E18 VC1.1 + cells are almost always amacrine and horizontal cells. However, classical birthdating experiments have shown that cone photoreceptors and ganglion cells are also being produced between E14 and E18 ( 8,11). These findings suggest that distinct progenitor types are biased in their production of cell types, with embryonic VC1.1+ progenitors making amacrine and horizontal cells and VC1.1− progenitors making cone and ganglion cells. The bias may be a reflection of the competence of the subpopulations of progenitors to make the various types of progeny. Interestingly, mitotic daughters of VC1.1 + progenitors can be VC1.1+ or VC1.1−, in keeping with the lineage analysis and the idea of the dynamic nature of competence.
Markers expressed by other subpopulations of mitotic retinal progenitor cells may allow further definition of competence states. It appears that the receptor tyrosine kinase, flk1, is expressed on subsets of retinal progenitors (X.Y. and C.L.C., unpublished results), flk-1 is expressed on a small subset of mature amacrines, and thus its expression in a relatively high percentage of progenitors is presumably not of the same significance as expression of VC1.1, syntaxin, or NFs. It is more likely that flk1 has a function in progenitors, perhaps in the cell fate or differentiation process. Other molecules whose expression marks subsets of progenitors have been partially characterized (47–49), and still others will undoubtably be discovered, as expression patterns of many genes are being explored. Some of these will be transcription factors whose role may be to control or direct the response of cells to various signaling events.
Model of Retinal Cell Fate Determination
Our current model is that retinal progenitors undergo a series of state changes in which a state is defined by the competence to respond to environmental cues to produce one, or a few, particular cell types (Fig. 5). Each state of competence is
endowed upon a cell by expression of a combination of transcription factors. These factors may direct synthesis of surface receptors or elements in signal transduction cascades so that a cell can respond to a particular set of cues. In addition, the transcription factors respond directly and/or direct the response to signal transduction cascades in order for differentiation to begin. A state of competence is transient. It appears that when a cell moves from one state to the next, it cannot go back to a previous state, as discussed above concerning the competence of chicken retinal cells to make ganglion cells (Fig. 3 and ref.37), as suggested by other experiments carried out in vitro (20,50), and by transplantation in vivo (D. Fekete and C.L.C., unpublished results). Commitment is achieved when extrinsic factors allow stabilization of the network of transcription factors and/or lead to production of a stable group of factors so that the cell is no longer dependent upon environmental cues to move forward in a program of differentiation. The transition from one state of competence to the next may be due to extrinsic cues or an intrinsic program.
The above hypothesis concerns specific signals between a competent cell and its environment. Over the past few years, as many specific receptors and ligands have been identified, it has been noted that signaling through these receptors triggers relatively few signal transduction cascades. For example, the ras cascade is triggered by most receptor tyrosine kinases (36,51,52), and phosphorylation of the STAT family of transcription factors occurs as a result of signaling through the cytokine receptors ( 35). In addition to the apparent convergence of many specific signals into these pathways, disparate cell types have another common signal transduction pathway that is critical to differentiation. Signaling through the Notch/glp/lin receptor family has been shown to regulate differentiation in many types of cells in both invertebrates and vertebrates (39). Finally, a recently described barrier to differentiation, repression by the transcription factor, yan, has been hypothesized to control differentiation in many types of Drosophila cells (53,54). As yan is downstream of ras and is a target of the mitogen-activated protein kinase, a need to reduce yan activity could explain the fact that differentiation of many cell types involves stimulation of the ras/mitogen-activated protein kinase pathway (36,51,52). Although a vertebrate homologue of yan has not been identified, yan is an ETS domain transcription factor, and since a number of ETS domain transcription factors have been found in vertebrate genomes (55), a yan homologue will most likely be found.
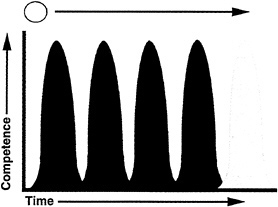
FIG. 5. A model for the behavior of progenitor cells in the developing retina. Retinal progenitors are proposed to undergo a series of changes in intrinsic properties. These properties are revealed by the competence of cells, or the ability to respond to environmental cues to produce different retinal cell types. Each state is depicted by a distinct color in the figure. One state of competence might occur for production of each cell type, or perhaps cells can produce two or three cell types in a particular state of competence. The commitment of a competent cell to become, or produce, a particular cell type is controlled by environmental signals. Movement of cells from one state to the next appears to be in one direction only (see text).
How does stimulation of a few common pathways lead to the generation of so many types of cells? The developmental history of each cell, which contributes to its state of competence, has to be critical in the choice of cell fate. There must be a selection within the cell of which genes will respond to the signal transduction cascades. Such genes are just beginning to be identified—for example, phyllopod in the Drosophila eye (56,57). In addition, some of the genes that contribute to competence and/or control the response to extracellular cues have been identified, such as the homeodomain gene, rough (58,59), also in the Drosophila eye. Given the fairly limited number of signal transduction cascades identified to date, the contribution of the developmental history and competence to the generation of diversity cannot be overstated.
We thank David Cardozo, Eric Morrow, Michael Belliveau, Zhengzheng Bao, David Feldheim, and Jeff Golden for helpful comments on the manuscript and the past and present members of the Cepko Laboratory for stimulating discussions concerning the ideas and data discussed herein. The authors also gratefully acknowledge the help of Michael Belliveau in the preparation of the figures.
1. Marti, E., Bumcrot, D. A., Takada, R. & McMahon, A. P. ( 1995) Nature (London) 375, 322–324.
2. Roelink, H., Porter, J. A., Chiang, C., Tanabe, Y., Chang, D. T., Beachy, P. A. & Jessell, T. M. ( 1995) Cell 81, 445–455.
3. Hynes, M., Porter, J. A., Chiang, C., Chang, D., Tessier-Lavigne, M., Beachy, P. A. & Rosenthal, A. ( 1995) Neuron 15, 35–44.
4. Slack, J. M. W. ( 1991) From Egg to Embryo (Cambridge Univ. Press, Cambridge, MA), 2nd Ed.
5. Mintz, B. ( 1970) Symp. Int. Soc. Cell Biol. 9, 15.
6. Dowling, J. E. ( 1987) The Retina—An Approachable Part of the Brain (Harvard Univ. Press, Cambridge, MA).
7. Mann, I. ( 1928) Trans. Ophthal. Soc. U.K. 47, 172.
8. Young, R. W. ( 1985) Dev. Brain Res. 21, 229–239.
9. Drager, U. C. & Olsen, J. F. ( 1980) J. Comp. Neurol. 191, 383–412.
10. Young, R. W. ( 1984) J. Comp. Neurol. 229, 362–373.
11. Young, R. W. ( 1985) Anat. Rec. 212, 199–205.
12. Altshuler, D., Turner, D. & Cepko, C. ( 1991) Development of the Visual System, Proceedings of the Retina Research Foundation Symposia (Massachusetts Inst. of Technology, Cambridge, MA), 37–58.
13. Cagan, R. ( 1993) Development (Cambridge, U.K.) Supplement, 19–28.
14. Tomlinson, A. & Ready, D. F. ( 1987) Dev. Biol. 120, 366–376.
15. Turner, D. L. & Cepko, C. L. ( 1987) Nature (London) 328, 131–136.
16. Turner, D. L., Snyder, E. Y. & Cepko, C. L. ( 1990) Neuron 4, 833–845.
17. Holt, C. E., Bertsch, T. W., Ellis, H. M. & Harris, W. A. ( 1988) Neuron 1, 15–26.
18. Fekete, D. M., Perez-Miguelsanz, J., Ryder, E. & Cepko, C. L. ( 1994) Dev. Biol. 166, 666–682.
19. Wetts, R. & Fraser, S. E. ( 1988) Science 239, 1142–1145.
20. Adler, R. & Hatlee, M. ( 1988) Science 243, 391–393.
21. Altshuler, D. & Cepko, C. ( 1992) Development (Cambridge, U.K.) 114, 947–957.
22. Lillien, L. & Cepko, C. ( 1992) Development (Cambridge, U.K.) 115, 253–266.
23. Sparrow, J. R., Hicks, D. & Barnstable, C. J. ( 1990) Dev. Brain Res. 51, 69–84.
24. Mack, A. F. & Fernald, R. D. ( 1991) J. Neurosci. Methods 36, 195–202.
25. Reh, T. A. ( 1992) J. Neurobiol. 23, 1067–1083.
26. Treisman, J. E., Morabito, M. A. & Barnstable, C. J. ( 1988) Mol. Cell. Biol. 8, 1570–1579.
27. Watanabe, T. & Raff, M. C. ( 1990) Neuron 2, 461–467.
28. Altshuler, D., LoTurco, J. J., Rush, J. & Cepko, C. ( 1 993) Development ( Cambridge, U.K.) 119, 1317–1328.
29. Kelley, M. W., Turner, J. K. & Reh, T. A. ( 1994) Development (Cambridge, U.K.) 120, 2091–2102.
30. Waid, D. K. & McLoon, S. C. ( 1995) Neuron 14, 117–124.
31. Barnstable, C. J., Hofstein, R. & Akagawa, K. ( 1985) Dev. Brain Res. 20, 286–290.
32. Lin, L.-F. H., Mismer, D., Lile, J. D., Armes, L. G., Butler, E. T., III, Vannice, J. L. & Collins, F. ( 1989) Science 246, 1023– 1025.
33. Yamamori, T., Fukada, K., Aebersold, R., Korshing, S., Fann, M. J. & Patterson, P. H. ( 1989) Science 246, 1412–1416.
34. Ip, N. Y., McClain, J., Barrezueta, N. X., Aldrich, T. H., Pan, L., Li, Y., Wiegand, S. J., Friedman, B., Davis, S. & Yancopoulos, G. D. ( 1993) Neuron 10, 89–102.
35. Darnell, J. E., Jr., Kerr, I. M. & Stark, G. R. ( 1994) Science 264, 1415–1420.
36. Schlessinger, J. & Ulrich, A. ( 1992) Neuron 9, 383–391.
37. Austin, C. P., Feldman, D. E., Ida, J. A. & Cepko, C. L. ( 1995) Development (Cambridge, U.K.) 121, 3637–3650..
38. Prada, C., Puga, J., Perez-Mendez, L., Lopez, R. & Ramirez, G. ( 1991) Eur. J. Neuroscience 3, 559–569.
39. Artavanis-Tsakonas, S., Matsuno, K. & Fortini, M. ( 1995) Science 268, 225–232.
40. Henrique, D., Adam, J., Myat, A., Chitnis, A., Lewis, J. & Ish-Horowicz, D. ( 1995) Nature (London) 375, 787–790.
41. Sechrist, J. W. ( 1968) Am. J. Anat. 124, 117–134.
42. Guillemot, F. & Cepko, C. ( 1992) Development (Cambridge, U.K.) 114, 743–754.
43. Arimatsu, Y., Naegele, J. R. & Barnstable, C. J. ( 1987) J. Neurosci. 7, 1250–1263.
44. Inoue, A., Kunihiko, O. & Akagawa, K. ( 1992) J. Biol. Chem. 267, 10613–10619.
45. Bennett, M. K., Calakos, N. & Scheller, R. H. ( 1992) Science 257, 255–259.
46. Naegele, J. R. & Barnstable, C. J. ( 1991) Brain Res. 559, 118–129.
47. Guillemot, F. & Joyner, A. L. ( 1993) Mech. Dev. 42, 171–185.
48. Jasoni, C. L., Walker, M. B., Morris, M. D. & Reh, T. A. ( 1994) Development (Cambridge, U.K.) 120, 769–783.
49. Hernandez-Sanchez, C., Frade, J. M. & de la Rosa, E. J. ( 1994) Eur. J. Neurosci. 6, 105–114.
50. Reh, T. A. & Kljavin, I. J. ( 1989) J. Neurosci. 9, 4179–4189.
51. Wassarman, D. A., Therrien, M. & Rubin, G. M. ( 1995) Curr. Opin. Genet. Dev. 5, 44–50.
52. Pawson, T. & Bernstein, A. ( 1990) Trends Genet. 6, 350–356.
53. O'Neill, E. M., Rebay, I., Tjian, R. & Rubin, G. M. ( 1994) Cell 78, 137–147.
54. Rebay, I. & Rubin, G. M. ( 1995) Cell 81, 857–866.
55. Wasylyk, B., Hahn, S. L. & Giovane, A. ( 1993) Eur. J. Biochem. 211, 7–18.
56. Dickson, B. J., Dominquez, M., van der Straten, A. & Hafen, E. ( 1995) Cell 80, 453–462.
57. Chang, H. C., Solomon, N. M., Wassarman, D. A., Karim, F. D., Therrien, M., Rubin, G. M. & Wolff, T. ( 1995) Cell 80, 463–472.
58. Kimmel, B. E., Heberlein, U. & Rubin, G. M. ( 1990) Genes Dev. 4, 712–727.
59. Basler, K., Yen, D., Tomlinson, A. & Hafen, E. ( 1990) Genes Dev. 4, 728–739.


