
This paper was presented at a colloquium entitled “Vision: From Photon to Perception,” organized by John Dowling, Lubert Stryer (chair), and Torsten Wiesel, held May 20–22, 1995, at the National Academy of Sciences in Irvine, CA.
Molecular biology of retinal ganglion cells
MENGQING XIANG*†, HAO ZHOU*, AND JEREMY NATHANS *†‡§¶
Departments of *Molecular Biology and Genetics,‡Neuroscience,§Ophthalmology,†Howard Hughes Medical Institute, Johns Hopkins University School of Medicine, Baltimore, MD 21205
ABSTRACT Retinal ganglion cells are the output neurons that encode and transmit information from the eye to the brain. Their diverse physiologic and anatomic properties have been intensively studied and appear to account well for a number of psychophysical phenomena such as lateral inhibition and chromatic opponency. In this paper, we summarize our current view of retinal ganglion cell properties and pose a number of questions regarding underlying molecular mechanisms. As an example of one approach to understanding molecular mechanisms, we describe recent work on several POU domain transcription factors that are expressed in subsets of retinal ganglion cells and that appear to be involved in ganglion cell development.
This paper reviews our current knowledge of retinal ganglion cell structure and function with an emphasis on those areas in which molecular biological approaches may be expected to provide new insights. We begin with an overview of the physiological, anatomical, and psychophysical experiments that have revealed the diversity of ganglion cell properties and the significance of that diversity for visual perception. Although little is currently known about the molecular basis of this diversity, it is likely that many of the relevant molecules will be identified in the near future. As an illustration of one area in which significant progress seems likely, we conclude with a description of recent work on transcription factors in retinal ganglion cells.
Physiological Properties of Retinal Ganglion Cells
Ganglion cells are the output units of the retina. Because their cell bodies and axons are relatively accessible, they were among the first vertebrate neurons for which single unit responses were determined. In 1938 Hartline (1) recorded from individual axons at the vitreal surface of the frog retina while stimulating the retina with a spot of light. These seminal experiments introduced the concept of a receptive field, defined by Hartline as the region of the retina that must be illuminated in order to obtain a response in a given fiber. As shown in Fig. 1, these experiments also revealed a multiplicity of response properties among retinal ganglion cells, including both activation and inhibition: “This diversity of response among fibers from closely adjacent regions of the same retina is extreme and unmistakable; it does not depend upon local conditions of stimulation or adaptation, but appears to be an inherent property of the individual ganglion cells themselves ” (1).
In 1953 Barlow and Kuffler (2,3) independently discovered that many ganglion cells have an antagonistic spatial organization in which either an excitatory center is paired with an inhibitory surround or an inhibitory center is paired with an excitatory surround. The center-surround organization filters the image by emphasizing spatial contrast. This type of spatially antagonistic filtering had been predicted in the 19th century by both Hering and Mach (4,5) on psychophysical grounds, and it accounts for the illusory black dots seen in the Hermann grid in Fig. 2. In the retinas of old world primates, many ganglion cells also relay chromatic information by reporting either the difference between red and green cone inputs or the difference between blue cone input and a sum of red and green ( = yellow) cone inputs. For reasons that are not obvious, most ganglion cells of the red vs. green type have both chromatically and spatially opponent receptive fields, whereas most ganglion cells of the blue vs. red + green type have nearly coextensive excitatory and inhibitory zones and therefore a much smaller degree of spatial opponency (6). The channeling of chromatic information into two pathways with red vs. green and blue vs. yellow color opponent organization was deduced on psychophysical grounds by Hering (4). It accounts for the chromatic afterimages generated by selective desensitization of one or another limb of the opponent processing system (Fig. 2).
Hartline's original recordings showed that in some ganglion cells a prolonged light stimulus evoked a steady response, whereas in others it evoked a transient (i.e., nonlinear) response (Fig. 1). The latter type of response filters the image by emphasizing temporal changes. Beginning in the mid-1960s, this distinction was systematically investigated in both cat and monkey retinas (reviewed in refs.6 and 7). In the cat two major ganglion cell types were identified and termed X and Y, the former responding both spatially and temporally in a linear manner and the latter responding nonlinearly (8). In primates, a similar dichotomy was found in temporal response properties, with one class, now referred to as parvocellular or P-type ganglion cells, responding linearly, and a second class, now referred to as magnocellular or M-type ganglion cells, responding nonlinearly (9). P- and M-type cells have been found to differ in a number of properties. In general terms, P cells are characterized by relatively slow conduction velocities, insensitivity to small changes in luminance contrast, and high spatial resolution, especially near the fovea. Most P cells have a chromatically opponent receptive field organization as described above. By contrast, M cells are characterized by relatively fast conduction velocities, sensitivity to small changes in luminance contrast, and low spatial resolution. M cells have achromatic center-surround receptive fields and therefore detect luminance but not chromatic contrast. The distinction drawn between cat X and Y cells in spatial response properties does not appear to carry over to the primate P/M system as all P-type and most M-type ganglion cells show linear spatial summation (10). The distinct P and M systems appear
The publication costs of this article were defrayed in part by page charge payment. This article must therfore be hereby marked “advertisement” in accordance with 18 U.S.C. §1734 solely to indicate this fact.
Abbreviations: IPL, inner plexiform layer; LGN, lateral geniculate nucleus.
|
¶ To whom reprint requests should be addressed at: 805 Preclinical Teaching Building, 725 North Wolfe Street, Johns Hopkins University School of Medicine, Baltimore, MD 21205. |
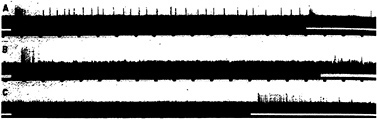
FIG. 1. Light responses obtained from isolated ganglion cell axons in the frog retina (reproduced from ref.1). The interval between the regular marks at the bottom of each trace correspond to 0.2 sec. The duration of illumination is indicated by the blackened portion of the strip near the bottom of each trace. The three cells reveal responses to the onset of illumination, the cessation of illumination, steady illumination, or various combinations of these. (Note: in trace A the apparent activity following cessation of illumination is from another cell.)
to represent a critical point at which the image is divided into separate and parallel streams.
Morphologic and Anatomic Properties of Retinal Ganglion Cells
From the earliest histologic studies of the vertebrate retina it has been apparent that each major class of cells— photoreceptor, bipolar, horizontal, amacrine, and ganglion— contains within it morphologically distinct subtypes (11). A major theme during the past century of retina research has been the identification of functional correlates for these morphologic differences (12). Among ganglion cells, one correlation that is now well established (and is perhaps not surprising) is between the area of the dendritic field and the area of the receptive field, the former appearing to coincide with and to determine the extent of the latter. Both dendritic field size and cell body size differ markedly between physiologically distinct ganglion cell types. For example, in the cat, X and Y cells correspond, respectively, to the medium (β) and large (α) cell types, and in the monkey, P- and M-type cells correspond, respectively, to the small (midget) and large (parasol) cell types (reviewed in refs.6 and 13). For P and M cells, both dendritic field and soma size increase progressively with increasing retinal eccentricity, and this increase is matched by a corresponding increase in the size of the receptive field. The eccentricity-dependent change in receptive field size accounts for the absence of an illusory dark spot in the one intersection of the Hermann grid upon which the observer fixates (Fig. 2). In the human retina, receptive field sizes have been measured psychophysically by determining the threshold for detection of a small test flash in the presence of a superimposed circular background of varying diameter and constant brightness (14). When the superimposed background is confined to the excitatory center of a center-surround receptive field it produces a persistent activation, thereby decreasing the sensitivity of the cell to dim test flashes. When the superimposed background is enlarged so that it also includes the inhibitory surround, the level of persistent activation is reduced and the sensitivity of the cell approaches that seen with the test flash alone. This psychophysical measure closely matches the eccentricity-dependent size of primate M-type ganglion cell dendritic fields (15) and receptive fields (16).
A second correlation between ganglion cell structure and function relates the level at which the ganglion cell dendrites arborize in the inner plexiform layer and the inputs that the cell receives. By examining the morphologies of individual ganglion cells after recording their light responses, it was discovered that ganglion cells with OFF centers have dendritic arbors in the outer part of the inner plexiform layer (IPL), whereas ganglion cells with ON centers have dendritic arbors in the inner part of the IPL (reviewed in ref. 12). Further subdivisions within the IPL are evident upon close examination of ganglion, bipolar, and amacrine cell dendritic morphologies ( Fig. 3). These are likely to be related, at least in part, to the segregation of chromatic inputs. In one well characterized example, the blue ON/yellow OFF color opponent type of ganglion cell has been shown to be bistratified (17). One dendritic tree is located at that level in the inner part of the IPL where the processes of blue cone bipolar cells terminate, and the second dendritic tree is located in the outer part of the IPL where it presumably receives inhibitory signals from bipolar cells driven by red and green cones.
A third structure–function correlation can be seen in the different projections made by retinal ganglion cells, with the result that distinct aspects of the retinal image are delivered to different destinations in the brain (reviewed in refs.6 and 7). The two principal projections from the retina are to the midbrain and to the dorsal lateral geniculate nucleus (LGN) of the thalamus, the latter projecting to the primary visual cortex. In amphibia and other lower vertebrates the midbrain projection (the retinotectal pathway) constitutes the major output pathway from the retina and mediates simple visually guided behaviors. In primates, the analogous pathway is devoted principally to the control of eye and head movements. Many ganglion cells that project to the midbrain exhibit receptive fields with a high degree of selectivity—for example, to movement in a particular direction.
Ganglion cell axons navigate with extraordinary precision to contact their appropriate targets within the brain. At the optic chiasm, most axons from the nasal but not the temporal half of each retina cross the midline to follow the contralateral optic tract. Central to the chiasm, ganglion cell axons in the primate retinothalamic tract undergo further segregation. Axons from M-type ganglion cells project to the ventral two layers of the LGN while axons from the P-type ganglion cells project to the dorsal four layers; axons derived from the contralateral eye innervate the first, fourth, and sixth layers of the LGN, while those derived from the ipsilateral eye innervate the second, third, and fifth layers; and within each layer of the LGN the pattern of innervation generates a precise retinotopic map that is aligned with each of the retinotopic maps above and/or below it.
Molecular Biological Questions
The diversity of ganglion cell properties and the precision with which these properties are programmed invite numerous questions regarding underlying molecular mechanisms. We list some of these questions below.
-
What determines the synaptic specificity of each ganglion cell for the various classes of bipolar and amacrine cells? What attractive or repulsive molecules determine the levels in the IPL where ganglion cells and the various classes of bipolar and amacrine cells synapse? What molecules determine the dendritic field size for each type of ganglion cell?
-
How do different ganglion cell classes differ in the types of neurotransmitters they use and in the properties and
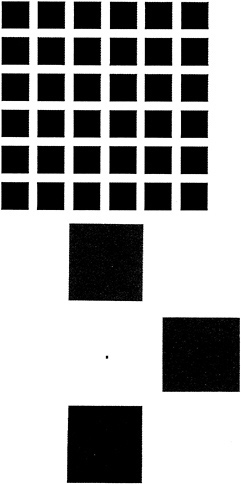
FIG. 2. Psychophysical demonstrations of chromatic and spatial signal processing in the retina. (Upper) Spatial opponent processing demonstrated by the Hermann grid. Viewing the figure at one-half arm's length produces the illusion of gray dots at the intersections formed by four black corners. The effect can be understood with reference to excitatory center–inhibitory surround receptive fields. More light falls on the inhibitory annulus of a ganglion cell that has its receptive field centered over the image of an intersection compared to a ganglion cell that has its receptive field centered in the white space between two adjacent black squares. Therefore, the former cell will be inhibited to a greater extent than the latter, with the result that the white area at the intersection will appear relatively dimmer. When the figure is viewed at one-half arm's length, illusory gray dots are seen at all intersections except for the one upon which the observer fixates, an effect that arises from the smaller receptive field sizes in the central retina. (Lower) Color opponent processing demonstrated by the induction of chromatic afterimages. To achieve the full effect, the viewer should fixate on the central black dot for ten seconds while the figure is illuminated by intense white light (e.g., sunlight). If the observer then views a white piece of paper, an afterimage is seen in which each square appears as its opponent color. The effect occurs because within the retinal region illuminated by each colored square those cones and/or cone pathways that were most strongly stimulated were selectively desensitized. The desensitization must occur within the retina because the afterimage appears to move in space as the eye moves. Consistent with a retinal origin, if the figure is viewed with only one eye the afterimage will be confined to that eye. The observed afterimage colors reveal two systems for chromatic analysis: red vs. green and blue vs. red + green ( = yellow).
-
regulation of their postsynaptic receptors? Do ganglion cells exhibit physiological alterations in synaptic efficacy and, if so, by which mechanisms?
-
What are the identities of the guidance molecules that lead ganglion cell axons across the retinal surface to the optic nerve, determine which axons cross the midline at the optic chiasm, direct different axons to the midbrain or thalamus (as well as to other destinations), and produce the precise arrangement of synaptic contacts within the midbrain and LGN?
-
What genetic regulatory circuits distinguish retinal ganglion cell types and how are these set up during development? How are the numbers of different ganglion cell types determined, and what are the mechanisms by which these differ between species? How are the numbers and morphologies of each type of ganglion cell programmed to vary as a function of retinal eccentricity?
Transcription Factors in Retinal Ganglion Cells
Many of the questions posed above are under active investigation. As an illustration of one area in which some progress has been made, we discuss below current work on the identification and characterization of transcription factors that are likely to be involved in controlling ganglion cell development.
The specification of a final differentiated cellular phenotype consists, in large part, of the selective transcriptional activation of particular genes. Work on myoblast differentiation in the mouse (18) and on early embryonic development in Drosophila (19) suggests that this is accomplished by a combinatorial network of interacting transcription factors. These act both to stably set the cell along a particular pathway of differentiation and to activate a battery of downstream genes, the products of which are the structural proteins, enzymes, etc., that functionally distinguish one cell type from another.
A number of transcription factors have been localized to the retina; most are also present in a variety of neural, and in some cases nonneural, tissues. Pax6 is the best characterized of these factors. It contains both a PAX domain and a homeodomain and is expressed in all or nearly all ocular tissues including the lens, iris, and retina (20). In mice, homozygous Pax6 mutants lack eyes and nasal primordia (21). In the heterozygous condition, mutations in the murine Pax6 gene cause a small eye phenotype, and mutations in the human PAX6 gene cause aniridia (22,23). SOHo-1, a homeodomain gene identified in chickens, is expressed in all layers of the developing retina as well as in other sensory organs including the otocyst and dorsal root and facial ganglia (24). Several homeodomain genes that are highly homologous to the Drosophila NK-2 gene—Nkx2.2, TTF1, and Dlx—are expressed in the developing retina and in a complex pattern in other regions of the developing central nervous system (CNS) (25,26). Isl1, which contains both a LIM domain and a homeodomain, is expressed in endocrine organs, in the brain and spinal cord, and in the retina in subsets of cells in the inner nuclear and ganglion cell layers (27). Chx10, a homeodomain gene, is expressed in retinal neuroblasts but not in the developing ganglion cell layer; in the adult retina it is confined to the inner nuclear layer (28). Two transcription factors that do not contain homeodomains have been characterized in the retina. NRL, a member of the basic region leucine zipper family, is expressed only in the retina, where it is present in most or all neurons (29). Mash-1, a member of the basic region helix–loop–helix family, is expressed in many regions of the developing CNS; in the developing retina, it is present in neuroblasts and is absent from the ganglion cell layer (30). A number of more ubiquitous transcription factors have also been found in the retina but are unlikely to play a role in distinguishing cell types.
With respect to the generation and differentiation of retinal ganglion cells, four POU domain transcription factors are likely to be important, based on their expression in subsets of
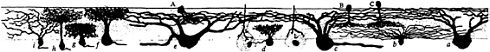
FIG. 3. Ganglion and amacrine cells in the dog retina (from ref.11). A, B, and C, amacrine cells; a-i, ganglion cells.
ganglion cells in a variety of vertebrate retinas. The POU domain family of transcription factors is defined by the presence of a bipartite DNA binding domain consisting of a POU-specific domain of ≈70 amino acids and a POU-specific homeodomain of ≈60 amino acids, separated by a 10- to 30-amino acid linker. More than 10 distinct POU domain family members have been identified thus far in vertebrates, including both ubiquitously expressed factors such as Oct-1 and tissue-specific factors such as the pituitary-specific factor Pit-1 (reviewed in ref.31). Three of the four POU domain factors implicated in ganglion cell development—Brn3a, Brn3b, and Brn3c—are highly homologous members of the class IV POU domain subfamily. The fourth, RPF-1, is a newly discovered member of the class VI POU domain subfamily.
The first member of the Brn3 subfamily was identified in developing rat brain cDNA (32). Subsequent experiments led to the identification and characterization of the three Brn3 genes in mice (33–35) and in humans (36,37). The Brn3 proteins are closely related to Unc86, a protein involved in the development of sensory neurons in Caenorhabditis elegans (38,39). In the adult mouse, each Brn3 gene is expressed in a small number of midbrain nuclei, in the dorsal root and trigeminal ganglia, and in the retina. Within the retina, expression is confined to subsets of cells within the ganglion cell layer (Fig. 4). In cat and rabbit retinas, all of the Brn3-expressing cells appear to be ganglion cells rather than displaced amacrine cells (which constitute an appreciable fraction of the cells in the ganglion cell layer) as determined by double immunostaining with AB5, an antibody previously shown to label only ganglion cells (40). In all retinas examined thus far, a characteristic and reproducible heterogeneity is observed in the intensity of ganglion cell immunolabeling. In the developing mouse retina, the Brn3 proteins are found in the ganglion cell layer beginning between embryonic days 12 and 15, the time at which this layer first separates from the underlying layer of dividing neuroblasts (M.X. and J.N., unpublished).
In cat and macaque retinas, it has been possible to correlate the pattern of expression of the Brn3 genes with the known morphologic and anatomic classes of ganglion cells (37). In the cat, Brn3a is found at high levels in small (γ) ganglion cells and at lower levels in medium (β) and large (α) cells; Brn3b is found at high levels in all ganglion cells; and Brn3c is found only in small ganglion cells. A similar pattern is seen in the mouse retina where Brn3a and Brn3b are present in ≈40% of cells in the ganglion cell layer and largely colocalize; anti-Brn3c immunoreactivity is present in ≈15% of cells in the ganglion cell layer and these constitute a subset of the cells that contain Brn3a and Brn3b.
In the macaque retina, immunostaining also reveals colocalization of Brn3a and Brn3b. The density of immunostained cells in the ganglion cell layer falls steeply in going from the center to the periphery of the retina, a distribution that roughly matches the overall distribution of retinal ganglion cells in the primate retina (Fig. 5). Immunolabeling of macaque retinae following retrograde tracing from the lateral geniculate nucleus shows high levels of Brn3a in a minority of P-type ganglion cells and low levels in all of the remaining P- and M-type ganglion cells. In the same retinae, high levels of Brn3b were seen in nearly all P-type ganglion cells and low levels were seen in nearly all M-type ganglion cells (Fig. 6). Brn3ccontaining cells have not yet been mapped in the macaque retina because of their low level of immunoreactivity with currently available antibodies.
The Brn3 proteins are also expressed in the developing dorsal root and trigeminal ganglia (33,35), reminiscent of the expression pattern of the chicken homeobox gene SOHo-1 (24). In adult mice, each of the anti-Brn3 antibodies stains a subset of cells within these ganglia (37). Anti-Brn3a antibodies label most of the neurons; anti-Brn3b antibodies label <50% of the neurons; and anti-Brn3c antibodies label only occasional neurons. The expression of these transcription factors in both the somatosensory and visual systems is intriguing, given that
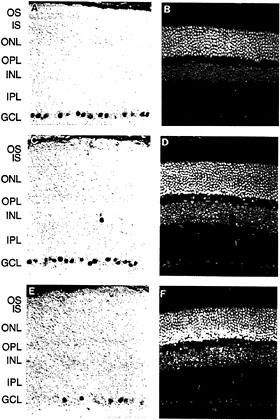
FIG. 4. Anti-Brn3a, anti-Brn3b, and anti-Brn3c immunoreactivity in the mouse retina [reproduced with permission from ref.37 (copyright 1995, Society for Neuroscience)]. Immunoperoxidase staining with affinity-purified polyclonal antibodies specific for each of the Brn3 transcription factors (Left) and 4′,6-diamidino-2-phenylindole (DAPI) staining of the same sections (Right). (A and B) Anti-Brn3a. (C and D) Anti-Brn3b. (E and F) Anti-Brn3c. Immunoreactive nuclei are found almost exclusively within the ganglion cell layer; the rare immunostained cells found in the inner nuclear layer are presumed to represent displaced ganglion cells. Note that the purple horseradish peroxidase reaction product partially quenches DAPI fluorescence when the two are present in the same nucleus. OS, outer segment; IS, inner segment; ONL, outer nuclear layer; OPL, outer plexiform layer; INL, inner nuclear layer; GCL, ganglion cell layer.
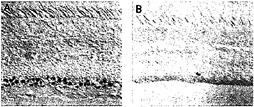
FIG. 5. Distribution of anti-Brn3a immunoreactivity among ganglion cells in the central (A) and peripheral (B) macaque retina [reproduced with permission from ref.37 (copyright 1995, Society for Neuroscience)].
both systems divide a complex sensory input into parallel streams (41). These data suggest a homology in the development of these two sensory systems, based on a partial overlap of transcriptional regulators.
RPF-1, the fourth POU domain sequence implicated in ganglion cell development, was identified in human and mouse genomic DNA and subsequently found in the human retina where it is expressed in subsets of ganglion and amacrine cells (H.Z. and J.N., unpublished data). As described above for the pattern of immunostaining for the Brn3 factors, immunostaining for RPF-1 shows a characteristic heterogeneity of nuclear staining intensity. In the cat retina, the highest levels of RPF-1 are found in medium (β) and small (γ) ganglion cells; the large (α) ganglion cells contain little or no RPF-1. In the macaque, many ganglion cells contain low levels of RPF-1 and a minority of cells in the ganglion cell layer contain high levels of RPF-1. In contrast to the eccentricity-dependent decrease in overall cell density in the ganglion cell layer, the density of cells that contain high levels of RPF-1 changes little with retinal eccentricity.
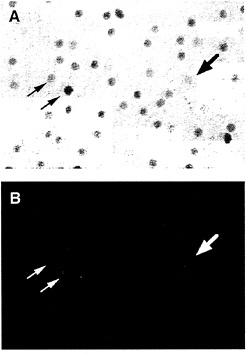
FIG. 6. Anti-Brn3b immunolabeling of backfilled macaque retinal ganglion cells [reproduced with permission from ref.37 (copyright 1995, Society for Neuroscience)]. A macaque retina was immunostained with anti-Brn3b after retrograde transport of Texas Redconjugated dextran from an injection that included both the parvocellular and magnocellular layers of the LGN. (A) Anti-Brn3b immunoreactivity visualized with horseradish peroxidase. (B) Texas Red fluorescence. Large arrow points to a large backfilled cell; small arrows point to two smaller backfilled cells.
The most direct evidence that any of the POU domain transcription factors play a role in ganglion cell development comes from recent experiments in which the Brn3b gene has been inactivated by homologous recombination in embryonic stem cells (M.X., J.N., L. Gan, and W. Klein, unpublished data). Mice that are homozygous for the mutant allele are viable but show specific defects in retinal structure. While Brn3b knockout retinae resemble those of the wild type in overall structure, they have 70% fewer ganglion cells. Other neurons within the retina and brain appear to be minimally or not at all affected.
An intriguing aspect of the Brn3 and RPF-1 immunolabeling patterns is the characteristic heterogeneity in nuclear labeling intensity. This heterogeneity in levels of transcription factors suggests that stable differentiated states may be determined not only by the presence or absence of different transcription factors but by the maintenance of these factors at particular intermediate levels. A graded mechanism of this general type has been shown to mediate anterior–posterior fate determination in the Drosophila embryo, in which case concentration gradients of a small set of maternally derived regulatory proteins determine the level of expression of a larger set of target genes at different positions in the embryo (19).
The authors thank Dr. Stewart Hendry for helpful comments on the manuscript. This work was supported by the National Eye Institute (National Institutes of Health) and the Howard Hughes Medical Institute.
1. Hartline, H. K. ( 1938) Am. J. Physiol. 121, 400–415.
2. Barlow, H. B. ( 1953) J. Physiol. 136, 469–488.
3. Kuffler, S. ( 1953) J. Neurophysiol. 16, 37–68.
4. Hering, E. ( 1878) Zur Lehre von Lichtsinn (Gerald, Vienna).
5. Mach, E. ( 1897) Die Analyse der Empfindungen (Fischer, Jena, F.R.G.).
6. Spillman, L. & Werner, J. S. ( 1990) Visual Perception: The Neurophysiological Foundations (Academic, New York).
7. Stone, J. ( 1983) Parallel Processing in the Visual System: The Classification of Retinal Ganglion Cells and Its Impact on the Neurobiology of Vision (Plenum, New York).
8. Enroth-Cugell, C. & Robson, J. G. ( 1966) J. Physiol. (London) 187, 517–552.
9. Gouras, P. ( 1968) J. Physiol. (London) 199, 533–547.
10. Derreington, A. M. & Lennie, P. ( 1984) J. Physiol. (London) 357, 219–240.
11. Cajal, S. R. ( 1892) La Rétine des vertébrés (La Cellule 9, 17–257), trans. Maguire, D. & Rodeick, R. W. (1973) The Vertebrate Retina (Freeman, San Francisco).
12. Kolb, H. ( 1994) Invest. Ophthalmol. Visual Sci. 35, 2385–2404.
13. Rodieck, R. W. & Brening, R. K. ( 1983) Brain Behav. Evol. 23, 121-164.
14. Westheimer, G. ( 1967) J. Physiol. (London) 190, 139–154.
15. Perry, V. H., Oehler, R. & Cowey, A. ( 1984) Neuroscience 12, 1101–1123.
16. DeMonastario, F. M. & Gouras, P. ( 1975) J. Physiol. (London) 251, 167–195.
17. Dacey, D. M. & Lee, B. B. ( 1994) Nature (London) 367, 731–735.
18. Lassar, A. & Munsterberg, A. ( 1994) Curr. Opin. Cell Biol. 6, 432–442.
19. St. Johnston, D. & Nusslein-Volhard, C. ( 1992) Cell 68, 201–218.
20. Walther, C. & Gruss, P. ( 1991) Development (Cambridge, U.K.) 113, 1435–1449.
21. Hill, R. E., Favor, J., Hogan, B. L. M., Ton, C. C. T., Saunders, G. F., Hanson, I. M., Prosser, J., Jordan, T., Hastie, N. D. & von Heyningen, V. ( 1991) Nature (London) 354, 522–525.
22. Jordan, T., Hanson, I., Zaletayev, D., Hodson, S., Prosser, J., Seawright, A., Hastie, N. & von Heyningen, V. ( 1992) Nat. Genet. 1, 328–332.
23. Glaser, T., Walton, D. S. & Maas, R. L. ( 1992) Nat. Genet. 2, 232–239.
24. Deitcher, D. L., Fekete, D. M. & Cepko, C. L. ( 1994) J. Neurosci. 14, 486–498.
25. Dolle, P., Price, M. & Duboule, D. ( 1992) Differentiation 49, 93–99.
26. Price, M., Lazzaro, D., Pohl, T., Mattei, M.-G., Ruther, U., Olivo, J.-C, Duboule, D. & DiLauro, R. ( 1992) Neuron 8, 241–255.
27. Thor, S., Ericson, J., Brannstrom, T. & Edlund, T. ( 1991) Neuron 7, 881–889.
28. Liu, I. S. C., Chen, J., Ploder, L., Vidgen, D., van der Kooy, D., Kalnins, V. I. & McInnes, R. R. ( 1994) Neuron 13, 377–393.
29. Swaroop, A., Xu, J., Pawar, H., Jackson, A., Skolnick, C. & Agarwal, N. ( 1992) Proc. Natl. Acad. Sci. USA 89, 266–270.
30. Guillemit, F. & Joyner, A. L. ( 1993) Mech. Dev. 42, 171–185.
31. Rosenfeld, M. G. ( 1991) Genes Dev. 5, 897–907.
32. He, X., Treacy, M. N., Simmons, D. M., Ingraham, H. A., Swanson, L. W. & Rosenfeld, M. G. ( 1989) Nature (London) 340, 35–42.
33. Gerrero, M. R., McEvilly, R., Turner, E., Lin, C. R., O'Connell, S., Jenne, K. J., Hobbs, M. V. & Rosenfeld, M. G. ( 1993) Proc. Natl. Acad. Sci. USA 90, 10841–10845.
34. Theil, T., Zechner, U., Klett, C., Adolph, S. & Moroy, T. ( 1994) Cytogenet. Cell Genet. 66, 267–271.
35. Turner, E. E., Jenne, K. J. & Rosenfeld, M. G. ( 1994) Neuron 12, 205–218.
36. Xiang, M., Zhou, L., Peng, Y.-W., Eddy, R. L., Shows, T. B. & Nathans, J. ( 1993) Neuron 11, 689–701.
37. Xiang, M., Zhou, L., Macke, J. P., Yoshioka, T., Hendry, S. H. C., Eddy, R. L., Shows, T. B., Nathans, J. ( 1995) J. Neurosci. 15, 4762–4785.
38. Chalfie, M., Horvitz, H. R. & Sulston, J. E. ( 1981) Cell 24, 59–69.
39. Finney, M., Ruvkin, G. & Horvitz, H. R. ( 1988) Cell 56, 757–769.
40. Fry, K. R., Tavella, D., Su, Y. Y. T., Peng, Y. W., Watt, C. B. & Lam, D. M. K. ( 1985) Brain Res. 338, 360–365.
41. Barlow, H. B. & Mollon, J. D. ( 1983) The Senses (Cambridge Univ. Press, Cambridge, U.K.).


