
This paper was presented at a colloquium entitled “Vision: From Photon to Perception,” organized by John Dowling, Lubert Stryer (chair), and Torsten Wiesel, held May 20–22, 1995, at the National Academy of Sciences in Irvine, CA.
Multineuronal codes in retinal signaling
MARKUS MEISTER
Molecular and Cellular Biology, Harvard University, 16 Divinity Avenue, Cambridge, MA 02138
ABSTRACT The visual world is presented to the brain through patterns of action potentials in the population of optic nerve fibers. Single-neuron recordings show that each retinal ganglion cell has a spatially restricted receptive field, a limited integration time, and a characteristic spectral sensitivity. Collectively, these response properties define the visual message conveyed by that neuron's action potentials. Since the size of the optic nerve is strictly constrained, one expects the retina to generate a highly efficient representation of the visual scene. By contrast, the receptive fields of nearby ganglion cells often overlap, suggesting great redundancy among the retinal output signals. Recent multineuron recordings may help resolve this paradox. They reveal concerted firing patterns among ganglion cells, in which small groups of nearby neurons fire synchronously with delays of only a few milliseconds. As there are many more such firing patterns than ganglion cells, such a distributed code might allow the retina to compress a large number of distinct visual messages into a small number of optic nerve fibers. This paper will review the evidence for a distributed coding scheme in the retinal output. The performance limits of such codes are analyzed with simple examples, illustrating that they allow a powerful trade-off between spatial and temporal resolution.
All of our visual experience derives from the sequences of action potentials carried by the fibers of the optic nerve. This cable linking the eye to the brain contains about 1.5 × 10⁶ fibers in man and presents a severe bottleneck for visual signals: nowhere earlier or later is the visual scene captured in such compact form. Evolutionary pressure to keep the number of optic nerve fibers low may result from the necessity for eye movements, which places a mechanical constraint on the thickness of the nerve bundle. In this context, the purpose of the retina is to process the raw image of the outside world and produce a compressed representation that matches the finite capacity of the optic nerve (1,2). Since the quality of this representation limits the performance of the entire visual system, there is considerable interest in the neural code by which the population of optic nerve fibers represents our visual environment.
The visual responses of individual retinal ganglion cells have been studied in exquisite detail (for review, see refs.3–5). Their functional properties vary considerably among species, and within the same retina one can distinguish several different types of light responses. However, they all share the following features. Each ganglion cell responds to light within a compact region of the retina, its receptive field, which can measure from tens to hundreds of micrometers in diameter. Due to lateral inhibition within the retinal circuitry, the receptive field often shows a central and a surrounding region with opposite sensitivity to light, which enhances the ganglion cell's response to spatial intensity gradients rather than a uniform field. Similarly, each ganglion cell's sensitivity is restricted in time, extending into the past for tens to hundreds of milliseconds. As a result of adaptation and filtering in retinal circuits, this sensitivity is often biphasic, such that the cells are driven most strongly by a changing visual image rather than a steady pattern.
The receptive fields of nearby ganglion cells show a great degree of overlap. By multiplying the area of receptive field centers with the spatial density of ganglion cells one obtains a retina-wide coverage factor of about 35 in the cat retina (6), indicating that each point in the visual image is encoded by as many optic nerve fibers. Part of this overlap can be explained by division of labor among ganglion cells: the ON and OFF cells clearly transmit different aspects of the scene; similarly for the X, Y, and W classes of ganglion cells, which partly project to different areas of the brain. But the functional distinctions we know today can account for only a fraction of the global overlap among ganglion cell receptive fields, which leaves the impression of a great deal of remaining redundancy in the retinal code. In the cat retina, for example, the coverage factors within each of the ON and OFF subdivisions range up to 3 for Y cells and up to 15 for X cells (7).
The conclusion that overlapping receptive fields imply redundant optic nerve signals results from the assumption that different neurons in the ganglion cell population operate independently of each other. This means that each ganglion cell views the world through its particular receptive field window, analyzes the visual pattern within that region, and modulates its firing probability accordingly, without regard to the activity of other ganglion cells. Formally, it implies that the response probabilities of two neurons are conditional only on the stimulus but are otherwise statistically independent. This is a convenient assumption: if it holds, then each optic nerve fiber can be treated as an independent channel of information about the visual scene, which greatly simplifies analysis of the retinal code. Since the classical tools of extracellular recording mostly monitored neurons one at a time, it was, for a long time, impossible to falsify the hypothesis of independent signaling. In the absence of contrary evidence, this provided the most parsimonious assumption, and, to date, no neuroscience textbook mentions any alternatives.
In recent years, the assumption of statistical independence within the ganglion cell population has been proven wrong. In particular, the spike trains of nearby ganglion cells tend to be synchronized on a time scale of several milliseconds. It now appears that these patterns of synchronous firing may be elements of the retinal code for vision, yielding a visual representation with higher spatial acuity and lower redundancy than expected from the classical single-unit analysis. The following section will summarize empirical evidence for these claims.
Concerted Signals from Retinal Ganglion Cells
Several groups have obtained simultaneous recordings from pairs of retinal ganglion cells in goldfish (8,9), rabbit (10), cat
The publication costs of this article were defrayed in part by page charge payment. This article must therfore be hereby marked “advertisement” in accordance with 18 U.S.C. §1734 solely to indicate this fact.
Abbreviations: LGN, lateral geniculate nucleus.
(11–14), and salamander (15,16). Each of these studies concluded that ganglion cells were not independent in their behavior. In particular, the spike trains from different ganglion cells were strongly correlated in absence of any visual stimulus, for example, in complete darkness or constant uniform illumination. Nearby cells tended to fire synchronously much more frequently than expected by chance, as evidenced by a central peak in the correlation function of their two spike trains (Fig. 1A). Such positive correlation was found primarily if both cells were ON type or both were OFF type. Two cells of opposite response type were often anticorrelated and tended to avoid generating simultaneous spikes.
In a remarkable study of pairwise recordings from cat retina, Mastronarde (12–14) identified three separate sources of correlations among the spike trains of two ganglion cells: Quantal fluctuations in a shared photoreceptor led to a broad peak or valley in the correlation function, with widths around 50 ms. These were observed only in darkness or very dim illumination, presumably requiring the high gain of phototransduction achieved by the dark-adapted retina. Shared synaptic input from a spiking neuron, possibly an amacrine cell, produced fast correlations on the time scale of 5–10 ms. These occurred at all light levels, provided that the receptive field centers of the two ganglion cells overlapped. Finally, ganglion cells appeared to be coupled to each other by gap junctions, and occasionally triggered each other with spike delays of <1 ms. Taken together, these correlations affected a large fraction of retinal activity—e.g., the rapid correlations from shared spiking input alone accounted for 80% of the maintained activity of Y cells. However, the experiments were all performed under constant illumination, and, thus, it remained unresolved whether such synchronous firing occurs during visual stimulation and how it might affect the transmission of information from the retina to the brain.
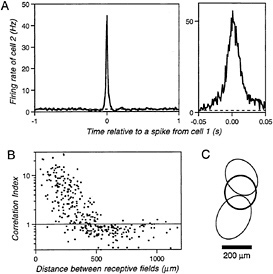
FIG. 1. (A) Cross-correlation function between the spike trains of two ganglion cells in tiger salamander retina during spontaneous activity in darkness. The plot is normalized to show the average firing rate of cell 2 as a function of time before or after an action potential from cell 1 and plotted on two time scales. The dashed line indicates the mean firing rate of cell 2 (for experimental methods, see refs.16 and 17). (B) Strength of the correlation between two ganglion cells as a function of the distance between their receptive fields. For each pair of cells, the correlation index expresses the observed rate of synchronous firing with a <0.02-s spike delay (the area under the correlation function in Fig. 1A from –0.02 s to 0.02 s) divided by the rate expected if the two cells fired independently (the corresponding area under the dashed line in Fig. 1A). This ratio is plotted for every pair among the OFF-type ganglion cells recorded from a single retina. (C) The visual receptive fields of two ganglion cells (thin lines) and of their synchronous firing events with a <0.02-s spike delay (thick line). Receptive fields were determined by stimulating the retina with a pseudorandom flickering checkerboard and reverse-correlating each ganglion cell's response to the stimulus. Each receptive field profile was fitted with a two-dimensional Gaussian and the plot shows the contours at 1 standard deviation from the center of these Gaussian fits.
It is now feasible to record simultaneously from many retinal ganglion cells by placing the isolated retina on a flat array of metal microelectrodes (17). In this way, we have recently analyzed the concerted activity among ganglion cells in the tiger salamander retina (15,16). The efficiency of monitoring a large number of cells and the long lifetime of the amphibian preparation have allowed a more thorough statistical analysis of concerted firing patterns, as well as an assessment of their role in visual signaling. During spontaneous activity in darkness, nearby ganglion cells had a pronounced tendency to fire synchronously, within 10–20 ms of each other (Fig. 1A). This degree of synchrony is highly significant, and one can quantify its strength by the “correlation index”: the observed number of synchronous spike pairs (with delays <20 ms) divided by the number expected if the ganglion cells fired independently. The correlation index was found to depend strongly on the distance between the receptive field centers of the two neurons (Fig. 1B), decreasing from a maximum of ≈20 for neighboring cells to 1 at a separation of 0.4 mm. At greater distances, up to 1 mm, the correlation index dipped significantly below 1, indicating that distant neurons tended to avoid firing synchronously. The phenomenology of these correlations is remarkably similar to the fast pairwise correlations observed in cat retina (12).
A higher-order analysis revealed that the effects extended beyond pairwise synchrony (M. J. Schnitzer and M.M., unpublished results): larger groups of ganglion cells were found to discharge simultaneously. Such firing patterns involved up to seven neurons in an experiment that monitored about 10% of the ganglion cells overlying the electrodes. These groups of cells were usually not nearest neighbors, but dispersed over the retina within the 0.4-mm distance determined from the pairwise analysis. Each ganglion cell could participate in several such stereotyped firing patterns. Altogether, synchronized firing among two or more cells accounted for more than 50% of all recorded action potentials. This probably underestimates the overall importance of concerted firing since only a fraction of all ganglion cells was observed.
The narrow width of the correlation peak centered near zero delay (Fig. 1A) suggests that groups of synchronized ganglion cells share excitatory input from another spiking neuron: its action potentials could trigger the follower ganglion cells simultaneously with high reliability. This shared input may originate from a spiking amacrine cell (12), and each stereotyped firing pattern among ganglion cells may represent the postsynaptic field of such an amacrine cell. Alternatively, synchronized ganglion cells could be coupled to each other via gap junctions, a possibility that is less plausible (16), though not entirely ruled out by the available evidence. For the remainder of this article, an origin in spiking amacrine cells will be taken as a working hypothesis, although the basic conclusions do not depend on that assumption.
Concerted firing persisted when the retina was driven by various visual stimuli, such as periodic flashes, traveling gratings, and a randomly flickering checkerboard (16). The shape of the pairwise correlation functions and the distance dependence of the correlation index remained essentially unaltered under visual stimulation. The same stereotyped multineuronal firing patterns were found as in darkness, but their rate of occurrence was strongly modulated by the stimulus. We de-
termined the visual receptive fields of such firing patterns: these were remarkably sharp in space, and located at the intersection of the receptive field centers of the individual ganglion cells participating in the firing pattern (Fig. 1C). Under the above working hypothesis, each characteristic firing pattern is caused by a spike of one amacrine cell. One concludes that this amacrine cell is active spontaneously in darkness but can also be driven by light. Its receptive field is small and contributes to the receptive fields of all its postsynaptic ganglion cells. Vice versa, the large receptive field of an individual ganglion cell includes the union of the receptive fields of several amacrine cells.
These observations have led to the proposal that synchronous firing events, rather than individual action potentials, should be considered the fundamental symbols of the retinal code (16). Each characteristic firing pattern among ganglion cells is associated with a small receptive field, presumably that of an amacrine cell, and thus carries a precise visual message. In fact, recent experiments suggest that by assigning a different message to each ganglion cell firing pattern one can derive more information from their spike trains than by treating each neuron as an independent encoder (19). As the number of such combinatorial firing patterns can be very large, many different visual messages could be multiplexed efficiently into a smaller number of optic nerve fibers. However, such a distributed multineuron code entails several tradeoffs compared with a single-neuron code that deserve further analysis, in particular: (i) To what extent is a combinatorial multiunit code beneficial at all, compared with a system that simply uses independent ganglion cells with large and overlapping receptive fields? Could the same information about the visual scene be extracted from the spike trains of two independent ganglion cells, without an explicit encoding of the receptive field subunits deriving from amacrine cells? (ii) In multiplexing, several symbols must share the same optic nerve fiber. This is conceivable because the visual signal has a much lower bandwidth (<15 Hz after transduction by the photoreceptors) than the optic nerve fibers (firing rates > 100 Hz). Nevertheless, the ganglion cell's total firing rate is limited, which forces a compromise between the number of different symbols it carries and the dynamic range available to encode each symbol. Is the resulting code still beneficial? (iii) The decoding of such multiplexed signals presumably requires the detection of characteristic synchronous firing patterns; yet, the average firing rates of mammalian ganglion cells can be high, ≥40 Hz. Can synchronous firings be decoded efficiently under these conditions, or would the process be affected seriously by fortuitous coincidences?
These concerns are best evaluated by analyzing a specific example of concerted coding.
Multiplexed Coding with Synchronous Spikes: An Example
Consider network A in Fig. 2A, a greatly reduced retina that encodes the light intensity of three regions by the spike trains
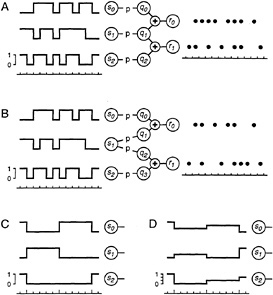
FIG. 2. A simplified retinal network that encodes the intensity of three spatial regions, si, by the spike trains of two output neurons, rk. The three intensities, whose time course is diagrammed on the left, are varied randomly and independently of each other. The output neurons fire at most once per time unit, and their spikes are indicated as dot rasters. In version A, the output neurons encode the activity of an interneuron, q1, by synchronous firing, whereas in version B they act as independent encoders. In C, the stimulus changes only once every 5 time units (long tick marks on the time scale). In D, the stimulus varies in a graded fashion, taking on one of four possible intensity values. See text for details.
of two ganglion cells. The stimulus variables si represent the intensity in three adjoining regions of the visual scene which, in the simplest version, will be taken to be either ON (si = 1) or OFF (si = 0). The response variables rk represent the spike trains of the two ganglion cells. Time is measured in discrete units, of duration equal to the coincidence interval for concerted firing. Within each time unit, the output neurons either fire (rk = 1) or remain silent (rk = 0). The qj represent the spike trains of interneurons, symbolic amacrine cells. Each of these responds to only one of the stimulus variables by the following simple rule: in each time unit, interneuron i fires (qi = 1) with probability p if region i is ON (si = 1), and remains silent if region i is OFF. Each ganglion cell receives input from two interneurons, and fires if at least one of its inputs fires. The resulting probabilities for the four possible ganglion cell firing patterns depend on the stimulus as shown in Table 1. Clearly, each of the two ganglion cell receptive fields extends equally over two input regions, and they have the central region, s1, in
Table 1. Probabilities p(r|s) for the four different ganglion cell firing patterns (r0,r1) = (0,0), (0,1), (1,0), and (1,1), conditional on the stimulus (s0, s1, s2) in networks A and B
|
Network A, (r0, r1) |
Network B, (r0, r1) |
||||||||||
|
s0 |
s1 |
s2 |
p(s) |
0,0 |
0,1 |
1,0 |
1,1 |
0,0 |
0,1 |
1,0 |
1,1 |
|
0 |
0 |
0 |
1/8 |
1 |
0 |
0 |
0 |
1 |
0 |
0 |
0 |
|
0 |
0 |
1 |
1/8 |
1 − p |
p |
0 |
0 |
1 − p |
p |
0 |
0 |
|
0 |
1 |
0 |
1/8 |
1 − p |
0 |
0 |
p |
(1 − p)2 |
(1 − p)p |
p(1 − p) |
p2 |
|
0 |
1 |
1 |
1/8 |
(1 − p)2 |
(1 − p)p |
0 |
p |
(1 − p)3 |
(1 − p)(2p − p2) |
p(1 − p)2 |
p(2p − p)2 |
|
1 |
0 |
0 |
1/8 |
1 − p |
0 |
p |
0 |
1 − p |
0 |
p |
0 |
|
1 |
0 |
1 |
1/8 |
(1 − p)2 |
(1 − p)p |
p(1 − p) |
p2 |
(1 − p)2 |
(1 − p)p |
p(1 − p) |
p2 |
|
1 |
1 |
0 |
1/8 |
(1 − p)2 |
0 |
p(1 − p) |
p |
(1 − p)3 |
p(1 − p)2 |
(1 − p)(2p − p2) |
p(2p − p2) |
|
1 |
1 |
1 |
1/8 |
(1 − p)3 |
(1 − p)2p |
p(1 − p)2 |
p + (1 − p)p2 |
(1 − p)4 |
(1 − p)2(2p − p2) |
(1 − p)2(2p − p2) |
(2p − p2)2 |
common. However, they do not encode the stimulus independently of each other: when the central interneuron q1 fires, then both ganglion cells fire synchronously, which implements the concerted coding scheme proposed above.
We will compare this coding scheme with that of network B in Fig. 2B. Here, the two ganglion cells operate independently of each other since they no longer share input from the same amacrine cell. Their single-unit response properties, however, are identical to those in network A: the firing of a ganglion cell in B depends on the stimulus in precisely the same fashion as for the corresponding cell in A. Thus, network B might have been inferred from serial single-unit recordings of these two ganglion cells without knowledge of their concerted behavior. The resulting response probabilities for the four firing patterns are listed in Table 1.
The performance of these two codes will be measured by how well the ganglion cell spike trains describe the visual stimulus. Specifically, we will compute the Shannon information (20) conveyed in each time unit by the response, r, about the stimulus, s, as follows:
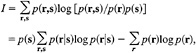
[1]
since p(s) = −1/8 for all s, where p(s) = probability of stimulus s, p(r) = probability of response r, p(r,s) = joint probability of response r with stimulus s, and p(r|s) = probability of response r conditional on stimulus s.
The information conveyed by the two networks is plotted in Fig. 3A (curves labeled N = 1, M = 1) as a function of p. This parameter determines the mean firing rate, f, of the ganglion cells, which is
f = p(1 − p/4) spikes per time unit
for both networks. At low p, the information per time unit approaches 0 because the cells hardly ever fire and silence conveys very little knowledge of the stimulus. In the limit of p = 1, the responses of both networks become deterministic and follow the same rules. Thus, they convey the same information, though still substantially less than the maximum of three bits, because eight stimuli are mapped into only four responses.
The performance ratio of the two networks, IA/IB, is plotted in Fig. 3B (N = 1, M = 1) against the mean firing rate of the ganglion cells. Network A, using concerted coding, always outperforms network B, using independent ganglion cells with the same properties. At low firing rates, the concerted code conveys 50% more information. In this regime of low p, network B hardly ever generates the response (1,1), whereas network A produces (1,1) as often as (1,0) and (0,1); r = (1,1) signals that the center region is ON almost unambiguously. Thus the 3:2 ratio in performance is a direct result of encoding the center region by a concerted firing pattern. At higher firing rates, the synchronous firing pattern can also be produced by activation of both s0 and s2; thus, its interpretation becomes ambiguous, and, eventually, the performance of B approaches that of A.
It was argued above that the visual input to the retina, after transduction by photoreceptors, varies on a time scale much longer than the coincidence interval within which ganglion cells exhibit synchronous firing. This can be incorporated in a more realistic analysis by holding the stimulus steady for N time units, and collecting the N resulting firing patterns as the response (Fig. 2C). Since the ganglion cell's decision to fire occurs independently in each time unit, the response to a given stimulus is completely characterized by the numbers of occurrence of each firing pattern throughout the N time units. The probability of obtaining each of these responses can be computed in a straightforward extension of Table 1, and Eq. 1 again yields the mutual information between stimulus and response. Fig. 3A (N = 10, M = 1) shows the information per stimulus presentation for both networks at N = 10. Clearly, the information conveyed about each stimulus pattern is now significantly higher than for N = 1 since each ganglion cell can fire up to 10 spikes within a stimulus correlation time. Again, the concerted code always outperforms the independent code, as seen in Fig. 3B (N = 10, M = 1). At low firing rates, the performance ratio is 3:2 for the same reasons as at N = 1. At higher firing rates, the performance margin of the concerted code is even greater than that computed at N = 1.
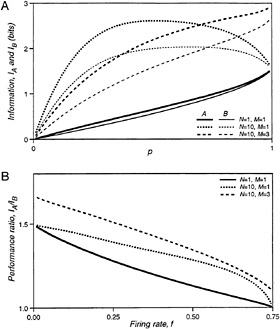
FIG. 3. (A) The information transmitted by the spike trains of networks A and B about the visual stimulus, plotted as a function of the firing probability for interneurons, p. (B) The ratio of information transmitted by networks A and B, plotted as a function of the mean firing rate per time unit of the output neurons, f.
The curve for N = 10, M = 1 in Fig. 3A already shows some saturation: the maximal information the ganglion cells can convey about this binary stimulus is three bits. So, one might object that the 10 independent firing events during a stimulus presentation are not used efficiently, which might put network B at a disadvantage. This can be fixed by providing the stimulus with a greater dynamic range: each region will now take on one of M + 1 intensity values drawn randomly from {0, 1/M, . . . , 1}, as illustrated in Fig. 2D. Thus, gradation in the firing rate of each ganglion cell can now encode gradation in the stimulus intensity. The firing probability of the interneurons is taken to be proportional to the corresponding stimulus intensity, with the same proportionality factor p. Again, one can derive analytical expressions for the information rates, and the results for M = 3 are plotted in Fig. 3 (N = 10, M = 3). Once more, network A outperforms network B. Its relative benefits are even greater than for the simple binary stimulus.
Discussion
The goal of this exercise was to analyze the simplest retina-like circuit (Fig. 2A) that uses a concerted firing code to represent
a visual stimulus. This was compared with another circuit (Fig. 2B) whose output neurons had the same single-cell properties, as might be assessed by single-electrode recording, but encoded the stimulus independently of each other. The task we set was to determine which of various adjoining regions of the visual scene was bright and which dark: not unlike the simple wall chart test for acuity performed by the eye doctor. Under all conditions, network A by using concerted firing performed better than network B with independent output neurons. Closer analysis showed that the enhanced spatial acuity of network A results because its concerted firing patterns explicitly represent the activities of retinal interneurons, each of which has a smaller receptive field than the ganglion cells. Thus, the output of network A represents three independent samples of the visual scene, whereas the output of B contains only two independent samples. One concludes that a concerted firing code of this type can provide information that could not be extracted at all from the spike trains of ganglion cells acting independently. No amount of processing of optic nerve signals can circumvent the sampling theorem, which states that spatial acuity is directly limited by the density of the available independent samples.
The concerted firing code gained a greater edge the more realistic we made the task, in particular when the ganglion cells were allowed to encode gradations in the stimulus by a graded firing rate. It appears that the trade-off between multiplexing several spatial messages into one nerve fiber and the resulting loss in dynamic range for each message emerges in favor of multiplexing. An intuitive explanation may be found as follows: if a ganglion cell can deliver up to N action potentials during a stimulus correlation time to encode a single stimulus variable, its information capacity is increased by a factor of log2 N (assuming that the precise temporal pattern of these spikes is not a coding variable, see also ref.21). Alternatively, the same action potentials could be used to encode N different stimulus variables with one spike each, resulting in a capacity increase by a factor of N, which is always greater than log2 N.
Finally, it was found that the concerted firing code yields a significant improvement even at high average firing rates. For mammalian retina, the coincidence interval for synchronous firing patterns is on the order of 5 ms (12). Given the integration properties of photoreceptors, the stimulus correlation time is around 50 ms (22). With these absolute time units, N = 10 in the above networks, and the maximal firing rate of their ganglion cells is 150 spikes per s. Inspection of Fig. 3B shows that even at a realistic average firing rate of 50 spikes per s (f = 0.25) the concerted firing code of network A provides a 51% boost in information capacity over network B working with independent coders.
It therefore appears that a concerted signaling mechanism of the type analyzed in the salamander retina can transmit more visual information than one would estimate on the basis of a single-unit analysis of each ganglion cell. In particular, the resulting visual representation has higher spatial resolution. What functions might such a concerted coding mechanism subserve?
It is tempting to link the enhanced spatial resolution to visual “hyperacuity” (23), namely tasks, such as vernier alignment, in which our visual system performs on spatial scales far below the ganglion cell receptive field. However, concerted coding of the type proposed here is unlikely to be involved in these mechanisms. The commonly studied hyperacuity tasks involve vision within the fovea, where each ganglion cell receives input from a single cone photoreceptor: Clearly, this receptive field does not decompose into subunits that could be encoded independently by amacrine cell spikes. Furthermore, these tasks typically require estimation of only one or a few spatial variables from a stimulus spanning many ganglion cell receptive fields. It is well known that such problems can be solved, in principle, by combining signals from several broadly overlapping sensors (24) and do not require dense spatial sampling.
Concerted coding is more likely to play a role in extrafoveal vision, where ganglion cell receptive fields are larger and overlap significantly. The receptive fields of Y cells in the cat are known to be composed of smaller subunits, each of which can excite the ganglion cell independently (25,26). Interestingly, concerted firing is also strongest among Y cells and accounts for most or all of their maintained activity (12). Different Y cells might therefore share input from the same subunit, and an analysis of synchronous firing patterns could reveal the visual scene at the resolution of the subunits rather than the larger ganglion cell receptive fields. Furthermore, it is possible that these receptive field subunits are distinct also in their temporal properties (27). Thus, a concerted firing code could provide higher resolution not only in the spatial dimension but for any spatiotemporal visual feature. Clearly, it is of prime importance to measure the visual response properties of firing patterns in the cat retina, and to assess their prevalence and characteristics in the primate retina.
Measurements of retinal activity can only determine how visual information is packaged into the optic nerve, not whether it is also used at the other end of the cable. A firing pattern spanning a specific set of optic nerve fibers could be detected by a cell that integrates excitatory input from these fibers and whose threshold is poised such that it fires only when all fibers are active simultaneously. Such a neuron would effectively re-create the spike train of the retinal interneuron that caused the concerted firing pattern. The resulting representation of the scene would again require many more neurons than in the optic nerve. Thus, it is unlikely that such explicit decoding takes place in the lateral geniculate nucleus (LGN) since the number of relay cells is comparable to the number of ganglion cells. On the other hand, these cells project to layer 4C of visual cortex which, in the macaque, contains about 40 times more neurons than there are afferents from the LGN (28,29). What is the purpose of this sudden expansion in the visual representation as soon as the signal enters the cortex? It has been proposed (30,31) that these neurons interpolate the visual image spatially between the coarse sampling of ganglion cell receptive fields. Alternatively, they might be dedicated to reconstructing the activity of many retinal interneurons that caused specific firing patterns among the optic nerve fibers. As discussed above, this would yield a representation of higher spatial resolution because it is based on a denser array of sampling points.
Several requirements must be met by such a coincidence detector. First, it should integrate the inputs from several LGN afferents. The anatomical overlap of afferent axonal arbors and cortical dendritic fields allows up to 100 LGN neurons to converge on each recipient cell in layer 4C (32), although it is not known how many such connections are actually established. Furthermore, the time scale of synaptic integration should not exceed the correlation time of synchronous inputs, about 10 ms. This appears to be satisfied for the fast postsynaptic potentials mediated by non-N-methyl-D-aspartate glutamate receptors. Also, the pulses from different ganglion cells should not suffer significant temporal dispersion on the pathway from the retina to the detector neuron. Most firing patterns are found among neurons <0.4 mm apart in the retina; assuming a conduction velocity of 500 mm/s in the unmyelinated ganglion cell axon, this spatial dispersion contributes, at most, 0.8 ms in temporal dispersion. The responses of cat LGN cells to electrical stimulation of the retina and the visual cortex suggest that the total travel time of an action potential from the retina to the cortex varies by <3 ms among cells of the same functional class (18). Altogether, it appears that spikes from different ganglion cells involved in a firing pattern experience relative transmission delays to the cortex of <4 ms, smaller than the 10-ms correlation time.
In summary, anatomical and physiological considerations suggest that the recipient neurons in primary visual cortex could, in principle, act as coincidence detectors for synchronous firing patterns among ganglion cells. Once relieved of the constraints imposed by the physical bottleneck of the optic nerve, the visual system may thus revert to a different neural code, again spreading the visual message over many independently firing neurons. Such a representation may be more adapted to the requirements for subsequent neural processing. Whether such decoding of concerted firing patterns does in fact occur must be resolved by future experiments which will provide a critical test of the retinal coding mechanisms proposed here.
I thank Drs. Leon Lagnado and Denis Baylor for their role in the early experiments leading to this work and the members of my laboratory for many discussions elaborating the ideas discussed here. Recent research has been supported by grants from the National Eye Institute (EY10020), the Office of Naval Research (N00014-92-J4072), the Human Frontiers Science Program Organization (RG17576), the Whitaker Foundation, a Presidential Faculty Fellow Award, and scholarships from the Markey Charitable Trust and the Pew Scholars Program.
1. Barlow, H. B. ( 1961) in Sensory Communication, ed. Rosenblith, W. A. (Mass. Inst. Technol. Press, Cambridge, MA), pp. 217–234.
2. Atick, J. J. ( 1992) Network 3, 213–251.
3. Stone, J. ( 1983) Parallel Processing in the Visual System (Plenum, New York).
4. Dowling, J. E. ( 1987) The Retina: An Approachable Part of the Brain (Harvard Univ. Press, Cambridge, MA).
5. Wässle, H. & Boycott, B. B. ( 1991) Physiol. Rev. 71, 447–480.
6. Fischer, B. ( 1973) Vision Res. 13, 2113–2120.
7. Peichl, L. & Wässle, H. ( 1979) J. Physiol. (London) 291, 117–141.
8. Arnett, D. W. ( 1978) Exp. Brain Res. 32, 49–53.
9. Johnsen, J. A. & Levine, M. W. ( 1983) J. Physiol. (London) 345, 439–449.
10. Arnett, D. & Spraker, T. E. ( 1981) J. Physiol. (London) 317, 29–47.
11. Rodieck, R. W. ( 1967) J. Neurophysiol. 30, 1043–1071.
12. Mastronarde, D. N. ( 1983) J. Neurophysiol. 49, 303–324.
13. Mastronarde, D. N. ( 1983) J. Neurophysiol. 49, 325–349.
14. Mastronarde, D. N. ( 1983) J. Neurophysiol. 49, 350–365.
15. Lagnado, L., Meister, M. & Baylor, D. A. ( 1992) Soc. Neurosci. Abstr. 1992, 394.
16. Meister, M., Lagnado, L. & Baylor, D. A. ( 1995) Science 270, 1207–1210.
17. Meister, M., Pine, J. & Baylor, D. A. ( 1994) J. Neurosci. Methods 51, 95–106.
18. Cleland, B. G., Levick, W. R., Morstyn, R. & Wagner, H. G. ( 1976) J. Physiol. (London) 255, 299–320.
19. Warland, D. K. & Meister, M. ( 1995) Invest. Ophthalmol. Visual Sci. 36, Suppl., 932.
20. Shannon, C. E. & Weaver, W. ( 1963) The Mathematical Theory of Communication (Univ. of Illinois Press, Chicago).
21. Barlow, H. B. ( 1986) in Visual Neuroscience, eds. Pettigrew, J. D., Sanderson, K. J. & Levick, W. R. (Cambridge Univ. Press, Cambridge, U.K.), pp. 3–18.
22. Schnapf, J. L., Nunn, B. J., Meister, M. & Baylor, D. A. ( 1990) J. Physiol. (London) 427, 681–713.
23. Westheimer, G. & McKee, S. P. ( 1977) Vision Res. 17, 941–947.
24. Baldi, P. & Heiligenberg, W. ( 1988) Biol. Cybernet. 59, 313–318.
25. Hochstein, S. & Shapley, R. M. ( 1976) J. Physiol. (London) 262, 237–264.
26. Enroth-Cugell, C. & Freeman, A. W. ( 1987) J. Physiol. (London) 384, 49–79.
27. Levine, M. W. & Zimmerman, R. P. ( 1988) Visual Neurosci. 1, 377–385.
28. Chow, K.-L., Blum, J. S. & Blum, R. A. ( 1950) J. Comp. Neurol. 92, 227–239.
29. Winfield, D. A. & Powell, T. P. ( 1983) Brain Res. 277, 223–229.
30. Crick, F. H. C., Marr, D. & Poggio, T. ( 1980) in The Cerebral Cortex, eds. Schmitt, F. O. & Worden, F. G. (Mass. Inst. Technol. Press, Cambridge, MA), pp. 505–533.
31. Barlow, H. B. ( 1981) Proc. R. Soc. London B 212, 1–34.
32. Freund, T. F., Martin, K. A., Soltesz, I., Somogyi, P. & Whitteridge, D. ( 1989) J. Comp. Neurol. 289, 315–336.


