
2
Air Quality, Emissions, and Health Impacts Overview
OVERVIEW OF POLLUTANTS AND STANDARDS
The primary goal of air quality management is the protection of public health and welfare. The governing legislation that exists today is the federal Clean Air Act (CAA), which was established in 1963 (PL 86-493) and substantially amended in 1967, 1970, 1977, and 1990. Several amendments to those CAAs also occurred between full CAA reviews and formal legislative revisions, particularly during the 1960-1980 period. The CAA provides the regulatory framework for air quality management, including mobile-source emissions. The management framework has five goals: mitigate ambient concentrations of criteria pollutants (described below), limit exposure to hazardous air pollutants (HAPs), protect and improve visibility in pristine areas, reduce emissions that cause acid deposition, and curb the use of stratospheric ozone-depleting chemicals (NRC 2004). The reduction of mobile-source emissions plays a key role in attaining those goals and is dealt with explicitly in the CAA, as discussed in Chapter 3 of this report. Regulation of mobile-source emissions is aimed predominantly at mitigating criteria pollutants; however, these sources also emit pollutants that contribute to air toxic exposures (also called hazardous air pollutants or HAPs), acid deposition, visibility degradation, and greenhouse gas concentrations.
The benefits from the CAA and its amendments have been substantial. The economic benefits to public health from improved air quality have outweighed the overall costs required to implement all mitigation strategies (OMB 2004). EPA estimated that the benefits of implementa-
tion of the CAA between 1970 and 1990 were $5-50 trillion greater than the costs (EPA 1997). EPA (1997) estimated that these benefits include about 100,000 to 300,000 fewer premature deaths per year and 30,000 to 60,000 fewer children each year with intelligence quotients below 70. In addition, regulations to improve air quality have helped propel the development of the emission-control industry.
Criteria Pollutants
The six criteria pollutants are identified as those reasonably anticipated to endanger public health or welfare and those whose presence results from numerous or diverse mobile and stationary sources (CAA section 108(A) (1)). The federal CAA Amendments of 1970 directed EPA to set National Ambient Air Quality Standards (NAAQS) for criteria pollutants and to review the NAAQS at intervals of not more than 5 years and to update them as needed (CAA section 109). Standard concentrations for each pollutant are set at two levels: a primary standard that protects the public health and a secondary standard that protects public welfare, including effects on visibility and agriculture.1 NAAQS were first established in 1971 on the basis of the current scientific knowledge of the effects of the pollutants on health and welfare. The NAAQS of 1971 included carbon monoxide (CO), sulfur dioxide (SO2), nitrogen dioxide (NO2), total photochemical oxidants, total suspended particles (TSP), and hydrocarbons (HC). Over time, a standard for lead (Pb) was added, TSP was revised to a standard for PM10,2 a standard for ground-level ozone replaced the oxidants standard, and the standard for HC was removed. The most recent NAAQS were promulgated in 1997 when a standard was added for fine PM (PM2.5),3 and the standard for ozone was lowered
and changed from a 1-hr average basis to an 8-hr average basis, effectively making the standard more stringent. Mobile sources contribute to ambient concentrations of all criteria pollutants.
Air Quality Standards
Some of the earliest, most severe, and most persistent air pollution episodes in the United States have been in California, particularly in the Los Angeles basin, and parts of California continue to have the most severe air pollution in the country. State legislation to control air pollution was passed as early as 1947, well before the federal CAA of 1963, and California has often preceded the federal government in establishing air quality and emissions standards. California’s Department of Public Health set ambient standards as early as 1959, and later the California Air Resources Board (CARB), formed in 1969, became the agency authorized by California law to set state ambient air quality standards. The federal CAA authorizes states to adopt ambient air quality standards to protect public health that are more protective than the EPA standards. California is among several states that have adopted separate ambient standards. California’s standards are more stringent than the NAAQS, and the state has adopted standards for additional criteria pollutants. In contrast to the federal standards, California’s ambient standards do not have attainment deadlines. The current federal and California standards are presented in Table 2-1.
Nonattainment Areas
The CAA mandates that ambient concentrations of criteria pollutants be monitored in urban and rural areas throughout the United States. EPA then determines whether the monitored regions attain the NAAQS based on statistical analysis of monitored data. Figure 2-1 shows nonattainment counties as of September 2005, indicating how many criteria pollutants are in nonattainment in each county. Figure 2-2 shows nonattainment counties for PM2.5 and ozone (with concentrations averaged over 8 hr) and, when compared with Figure 2-1, shows that the majority of nonattainment counties in the United States violate either the ozone or PM2.5 NAAQS. The figures show that nonattainment of criteria pollutants is especially problematic in much of California and the Northeast region
TABLE 2-1 Federal and California Ambient Air Quality Standards
|
Pollutant |
Averaging Time |
Federal Standards |
California Standardsa Primary |
|
|
Primary |
Secondary |
|||
|
Ozone |
1 hr |
0.12 parts per million (ppm) (235 μg/m3) |
Same as primary |
0.09 ppm (180 μg/m3) |
|
|
8hr |
0.08 ppm (157 μg/m3) |
Same as primary |
0.070 ppm (137 μg/m3) |
|
PM10 |
24 hr |
150 μg/m3 |
Same as primary |
50 μg/m3 |
|
|
Annual arithmetic mean |
50 μg/m3 |
Same as primary |
20 μg/m3 |
|
PM2.5 |
24 hr |
65 μg/m3 |
Same as primary |
No separate state standard |
|
|
Annual arithmetic mean |
15 μg/m3 |
|
12 μg/m3 |
|
CO |
8 hr |
9 ppm (10 mg/m3) |
None |
9.0 ppm (10 mg/m3), Lake Tahoe 6 ppm (7 mg/m3) |
|
|
1 hr |
35 ppm (40 mg/m3) |
|
20 ppm (23 mg/m3) |
|
NO2 |
Annual arithmetic mean |
0.053 ppm (100 μg/m3) |
Same as primary |
|
|
|
1hr |
|
|
0.25 ppm (470 μg/m3) |
|
SO2 |
Annual arithmetic mean |
0.030 ppm (80 μg/m3) |
|
|
|
|
24 hr |
0.14 ppm (365 μg/m3) |
|
0.04 ppm (105 μg/m3) |
|
|
3 hr |
|
0.5 ppm (1,300 μg/m3) |
|
|
|
1 hr |
|
|
0.25 ppm (655 μg/m3) |
|
Pba |
30-day average |
|
|
1.5 μg/m3 |
|
|
Calendar quarter |
1.5 μg/m3 |
Same as primary |
|
|
Visibility |
8 hr |
No federal standards |
|
Extinction coefficient of 0.23 per kilometer; visibility of 10 miles or more |
|
Sulfates |
24 hr |
No federal standards |
|
25 μg/m3 |
|
Hydrogen sulfide |
1hr |
No federal standards |
|
0.03 ppm (42 μg/m3) |
|
Vinyl chloridea |
24 hr |
No federal standards |
|
0.01 ppm (26 μg/m3) |
|
aCARB has identified lead and vinyl chloride as “toxic air contaminants” with no threshold level of exposure for adverse health effects determined. These actions allow for the implementation of control measures at levels below the ambient concentrations specified for these pollutants. Source: Adapted from CARB 2003a. |
||||
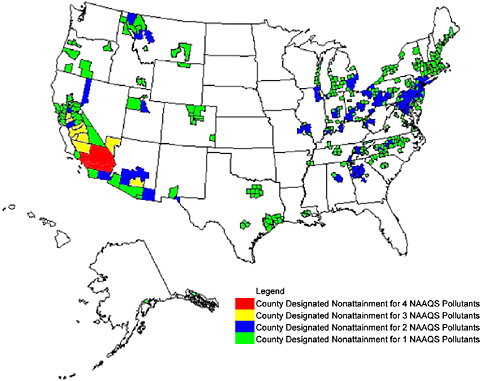
FIGURE 2-1 Counties designated “nonattainment” for NAAQS as of September 2005. Guam—Piti and Tanguisson Counties are designated nonattainment for the SO2 NAAQS. Partial counties, those with part of the county designated nonattainment and part attainment, are shown as full counties on the map. Source: EPA 2005a.
of the United States. Many counties in the United States are nonattainment designated for both ozone and PM2.5 concentrations.
Trends
On average, monitored concentrations for all criteria pollutants have decreased throughout the nation since 1970. A National Research Council (NRC 2004) assessment of air quality management credits the CAA with these substantial emissions reductions despite growth in population, energy use, and vehicle activity. The exceedances of the NAAQS, however, differ in relative severity from location to location and over time, depending on emissions sources, prevailing meteorology, and ef-
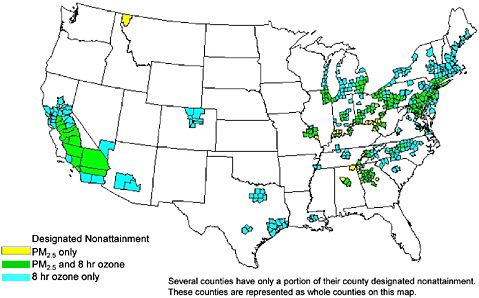
FIGURE 2-2 Counties designated nonattainment for PM2.5 and/or ozone with concentrations averaged over 8 hrs. Designations for ozone were made in June and September 2004. Designations for the PM2.5 were made in April 2005. Source: EPA 2005b.
fectiveness of regulation. Ambient Pb concentrations, for example, have been dramatically reduced throughout the nation since the 1980s as a result of a national policy to remove Pb from gasoline. Because of effective regulation of CO emissions, especially from mobile sources, the number of CO nonattainment areas has been reduced from many to only a few, representing another area of success due to the CAA (NRC 2003; Holmes and Russell 2004).
In contrast, ground-level ozone remains above the NAAQS in many areas despite decades of precursor reductions. Figure 2-3 shows the number of days per year that ozone concentrations exceeded the NAAQS from 2001 to 2003. The figure shows that areas in California exceed the NAAQS most frequently and that exceedances are common in Texas, the Midwest, and the entire Northeast region. Figures 2-4 and 2-5 presents historical air quality trends in exceedances of the 1-hr maximum ozone concentration and the 8-hr maximum ozone concentration in Los Angeles and New York. Both New York and Los Angeles are approaching the 1-hr NAAQS as a result of air quality improvement programs. The new standard for ozone, however, places both locations in a much more diffi
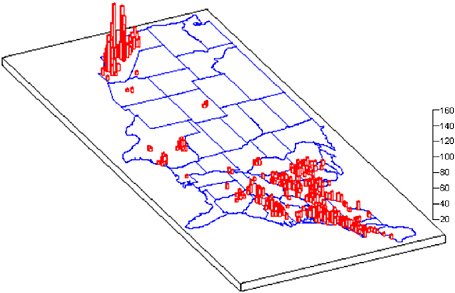
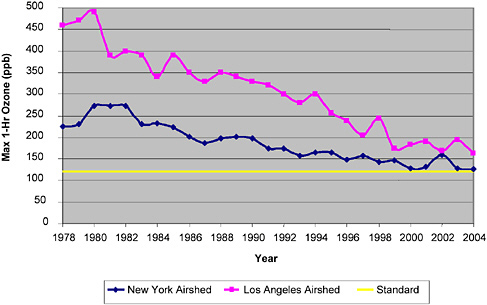

FIGURE 2-5 Trends in maximum ozone concentrations averaged over 8 hr for New York and Los Angeles airsheds from 1994 to 2004. Source: EPA 2004a; CARB 2005a.
cult position. Meeting this standard will require more aggressive ozone precursor control strategies for each region. That position is typical of other nonattainment areas on both the east and the west coasts of the United States.
More generally, further progress in improving air quality in the United States is likely to be challenging, especially in meeting the new NAAQS for PM2.5 and ozone and in addressing issues such as regional haze, HAPs, and greenhouse gas emissions (NRC 2004; Chameides et al. 2005). Mobile-source emissions standards, the focus of this report, are promulgated primarily to meet NAAQS, but such standards will also affect other air quality issues, such as mobile-source HAPs and greenhouse gas emissions. For example, EPA analyses show that mobile-source emissions standards programs already in place will yield significant reductions of mobile-source HAPs (EPA 2000a).
GROUND-LEVEL OZONE AND FINE PARTICULATE MATTER
Ground-level ozone and fine PM currently account for the majority of nonattainment areas in the United States and will be the focus of many
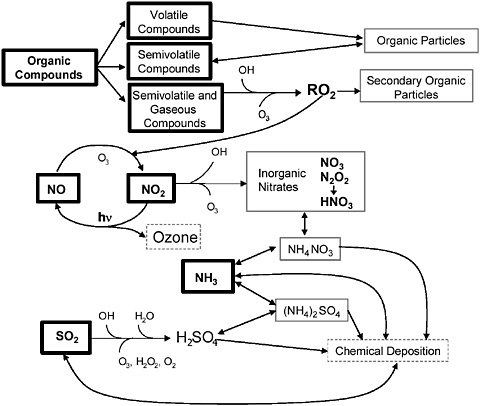
FIGURE 2-6 Schematic of the atmospheric processes involved in the formation of O3 and secondary PM. Major precursors are shown in the boxes with thick sides. Secondary particle components are shown in the boxes with thin, solid sides. Source: NARSTO 2004. Reprinted with permission; copyright 2004, Cambridge University Press.
future mitigation efforts. General characteristics of these two pollutants relevant to mobile-source management are presented here. Figure 2-6 shows a schematic representation of ozone and secondary PM formation and the relationships among the atmospheric processes involved in their formation. Later sections expand on the contribution of mobile sources to the concentrations of ozone and fine PM.
Ozone
Some criteria pollutants accumulate in the atmosphere due to direct emissions and are characterized as primary pollutants. Ozone, in contrast,
is characterized as a secondary pollutant because it is formed almost entirely in the atmosphere. Ozone formation is a highly nonlinear process that depends on sunlight intensity, meteorology, and the emissions and transport of its two major precursors, NOx and HCs. Understanding tropospheric ozone chemistry is a key to understanding how ozone formation depends on concentrations and emissions of its major precursors.4 A detailed description of this chemistry can be found elsewhere (Seinfeld and Pandis 1998; Finlayson-Pitts and Pitts 1999), and the following is meant to give a brief overview of the relationship of ozone to NOx and HC concentrations.
Ozone is formed when NO2 disassociates in the presence of sunlight to form NO and a single reactive oxygen atom (O), which can then combine with molecular oxygen (O2) to produce ozone. However, NO can remove ozone by reacting with it to recreate NO2 in a cycle that by itself would not necessarily result in ozone accumulation. Ozone accumulates when NO is converted to NO2 by alternate pathways, thereby eliminating an ozone sink (reaction with NO) and creating a new ozone source (more NO2). The alternate NO to NO2 conversion pathways are driven by HCs and reactive, short-lived species called radicals. The hydroxyl radical (OH) can react with HCs to form new organic (carbon-containing) radicals and inorganic (noncarbon-containing) radicals through multistep reactions with such species as oxygen. These new radicals convert NO to NO2 while regenerating more organic and inorganic radicals in a self-propagating process, including regeneration of OH that can then oxidize a new HC. The NO2 is then available to form ozone as described above. Ozone accumulates when conditions favor this recycling of radicals and NOx. Organic radicals and NO2 can be removed from the system by termination reactions that result in formation of less-reactive or stable compounds, thereby reducing their ability to promote ozone formation. Ozone formation slows or reverses when conditions favor these termination processes. NOx and thousands of different HC species may participate in this process.
Because ozone formation is driven by sunlight, as are other important radical reactions, ozone formation (and concentrations) is typically at a maximum in the afternoon and at a minimum before sunrise; however, ozone concentrations also depend on the temporal patterns of emissions and concentrations of available NOx and HCs.

FIGURE 2-7 Ozone isopleths (lines of constant ozone concentration). Source: NARSTO 2000. Reprinted with permission; copyright 2000, Cambridge University Press
A common way of understanding the relationship between ozone, NOx, and HC is through the use of ozone isopleths diagrams (lines of constant ozone concentration), which relate relative amounts of HC or volatile organic carbon (VOC)5 and NOx to ozone concentrations in a particular location. Ozone isopleths typical of an urban area in the United States are presented in Figure 2-7. The x- and y-axes represent initial VOC and NOx concentrations, respectively, in a mixture of precursors. The maximum ozone concentration (averaged over 1 hr) that results when the mixture reacts is plotted as a function of different initial precursor concentrations, and isopleths are drawn through these resultant concentrations.
A characteristic feature of Figure 2-7 is the ridgeline (in this example, at VOC/NOx ratio of 8:1), which passes through the local maxima in the ozone isopleths and separates conditions into two regimes: VOC-
|
5 |
Hydrocarbons are classified in a number of ways. EPA typically reports total VOC emissions. The California Air Resources Board uses reactive organic gas (ROG) emissions. Appendix A in this report lists various ways of reporting HC emissions. |
limited conditions above the ridgeline and NOx-limited conditions below the ridgeline. At VOC-limited conditions reducing NOx either will not affect ozone concentrations or will even increase ozone concentrations. At NOx-limited conditions, reducing VOC concentrations have little to no effect on ozone concentrations. The isopleths provide some insight into the complexities in designing appropriate control strategies. VOC emissions reductions might be appropriate if conditions in an urban area are in the VOC-limited regime, whereas NOx emissions reductions might be appropriate if conditions are NOx-limited. In some cases, both NOx and VOC control might be appropriate. Because VOC and NOx concentrations and their ratios can vary within a single airshed and throughout the day and week, appropriate emissions-reduction strategies are complex. The effectiveness of NOx versus VOC emissions reductions has been an important science-policy question for ozone mitigation.
Particulate Matter
Atmospheric PM refers to all suspended solid and solid-liquid particles in the atmosphere. Particles vary in size and chemical composition and originate from natural and anthropogenic sources. Some particles are emitted directly (primary PM) and some are formed in the atmosphere as a result of chemical and physical processes involving gaseous species (secondary PM). Figure 2-8 shows a typical urban size distribution of PM in the United States and shows both particle number concentrations and mass concentrations as a function of particle diameter. Particles are often divided by size into coarse (>2.5 m), fine (2.5 m), and ultrafine (<0.1 m) particles. Figure 2-8 shows that the majority of particles (as indicated by number concentration n°N) are ultrafine in size; however, the majority of particle mass (as indicated by volume concentration n°V) is coarse or fine in size.
The NAAQS for PM2.5 is expressed in terms of total mass concentration; however, regulatory agencies measure both total mass and composition of fine PM to provide information about its sources and potential health effects. Figure 2-9 shows the bulk composition of PM2.5 for different U.S. regions. The size of the pie charts also gives an indication of average total PM2.5 mass concentrations in the different regions. Major components of ambient PM2.5 are ammonium sulfates, ammonium nitrates, and elemental and organic carbon compounds. Elemental carbon refers to nonvolatile materials that are almost exclusively carbon, where-
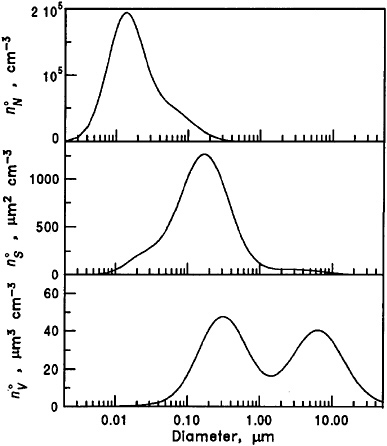
FIGURE 2-8 Typical particle volume (n°V), surface area (n°S), and number (n°N) concentrations of urban aerosol as a function of particle diameter. Source: Seinfeld and Pandis 1998. Reprinted with permission; copyright 1998, Wiley.
as organic carbon refers to organic compounds in the particle phase. Ammonium sulfates and ammonium nitrates are formed as a result of gas-to-particle conversion of ammonia (NH3), SO2, and NOx, and are considered secondary PM. Elemental carbon is exclusively primary; however, a fraction of organic carbon in PM2.5 was found to be secondary. The compositions presented in Figure 2-9 apply to total PM2.5. The chemical composition of the ultrafine fraction of PM2.5 was found to be different from that of total PM2.5 (EPA 2004f), suggesting that different size particles have different compositions and origins.
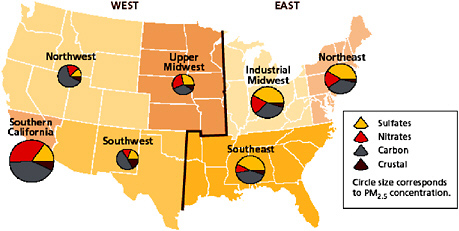
FIGURE 2-9 Mean PM2.5 compositions in the United States. Source: EPA 2004b.
MOBILE-SOURCE EMISSIONS CHARACTERIZATION
Fraction of Overall Inventory
Emissions of air pollutants are generally divided into the source categories shown in Table 2-2. Mobile sources compose a large fraction of the overall inventory. The National Air Quality and Emission Trends Report 2003 (EPA 2004b), Special Studies Edition reports that the percentage of national emissions due to on-road and nonroad mobile sources are 82% for CO, 56% for NOx, and 45% for VOCs. Although mobile sources emit SO2, point sources tend to dominate these emissions (EPA 2003a). Since phasing out leaded gasoline, Pb nonattainment has been virtually eliminated in the United States, and point sources are now more important than mobile (EPA 2003a). During 1993-2002, across the continental United States, transportation sources were estimated to have contributed on average about 20% of PM10 and 30% of PM2.5 (EPA 2003a). Data in this report are mostly limited to CO, NOx, VOCs, and PM. CO, NOx, and VOCs have been the primary focus of emissions control from light-duty vehicles. NOx and PM have been the primary focus of emissions control from diesel-fueled mobile sources, such as heavy-duty on-road vehicles.
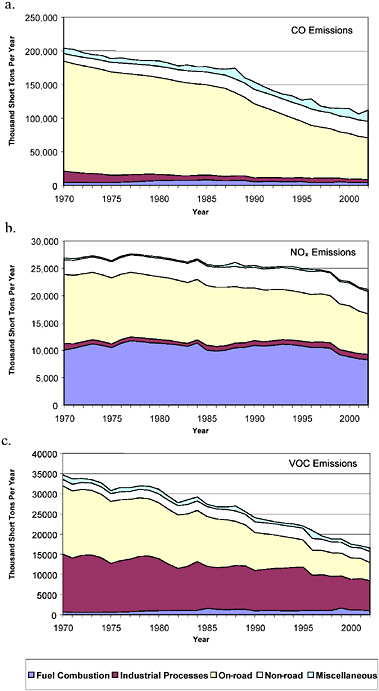
Figure 2-10a-c shows the national trends in total anthropogenic emissions by major sector from 1970 through 2002 for CO, NOx and VOC, respectively. Biogenic emissions are not included in these summa-
TABLE 2-2 Air Pollutant Emissions Sources
|
• Point sources are major, localized, and stationary sources that typically have their emissions regulated through permits, such as power plants, refineries, and large manufacturing facilities. • Area sources do not individually produce sufficient emissions to qualify or to be reported as a single point source, but collectively the emissions from all the small sources of the same type in an area may be significant and are reported as a category. These sources are numerous, including dry-cleaning facilities, architectural coatings, consumer products, commercial and residential heating, fugitive dust, solvent usage, and gasoline-dispensing facilities. • On-road mobile sources are emissions from vehicles certified for highway use, including passenger cars, buses, trucks, and motorcycles. • Nonroad mobile sources encompass a wide variety of equipment types that either move under their own power or are capable of being moved from site to site. Nonroad mobile equipment sources are not licensed or certified as highway vehicles but are defined as those that move or are moved within a 12-month period and are covered under EPA's emissions regulations as nonroad mobile sources. Major nonroad sources include aircraft, marine vessels, locomotives, farm and agricultural equipment, lawn and garden equipment, construction and mining equipment, and recreational vehicles, such as boats, all-terrain vehicles and snowmobiles. Regulation of aircraft, commercial marine vessels, locomotives, and certain farm and agricultural equipment is entirely federally preempted. These sources are not considered in this study because no state, including California, has authority to regulate them. • Biogenic emissions are dominated by hydrocarbons released by natural and cultivated vegetation. These emissions are not typically subject to emission-control strategies, and their spatial distribution (highest in heavily forested areas) differs from that of other emissions sources, which are often highest in populated areas. |
ries because they are typically not subject to controls. The figure illustrates the substantial contribution made by on-road and nonroad mobile sources for all three pollutants. The figure shows that total emissions and on-road emissions, especially of CO and VOC, have decreased substantially since 1970. As shown later in this chapter, this decrease has occurred despite increased on-road vehicle activity. Total nonroad emissions, in contrast, have remained fairly constant, and as a result, the fraction of total emissions that come from nonroad sources has increased. Nonroad CO increased from 6% to 22% of the total CO inventory from 1970 to 2002. Likewise, nonroad NOx increased from 10% to 19%, and nonroad VOC increased from 5% to 16% of total inventories from 1970 to 2002.
Composition of Mobile-Source Emissions
Mobile-source emissions are a complex mixture of gases and particles. In general, the gas-phase component includes CO, NOx, sulfur compounds, ammonia, and a vast array of volatile and semivolatile HCs, although the latter are often associated with particle emissions. There are some characteristic differences in gas-phase emissions composition between normal operating gasoline and diesel vehicles. Diesel engines, which burn a mixture rich with air, emit more NOx per unit activity than do normal gasoline vehicles. Sulfur is found in the United States in higher levels in diesel fuel than in gasoline, resulting in higher SO2 emissions from these engines. Gasoline-powered engines operating under nonstoichiometric6 conditions, such as at cold start and during idling, as well as older high-emitting engines are important contributors to mobile-source CO and organic compounds. Organic compounds typically found in gas-phase emissions include n, branched, cyclic alkanes and alkenes; other compounds found are 1,3-butadiene, aldehydes, ethers, ketones, steranes, hopanes, and aromatic compounds ranging from benzene to polycyclic aromatic hydrocarbons (PAHs) (Schauer et al. 2002).
Particles in mobile-source exhaust are generally quite small, from 0.001 to 1 μm, and are a complex mixture of a high number of compounds. Diesel exhaust is a significant contributor of particles in the ultrafine size range. Studies have shown diesel exhaust to include particles ranging from 0.01 to 0.3 μm, with the most found in the lower end of the size distribution (Park et al. 2003; Sakurai et al. 2003). The relative contribution of gasoline light-duty vehicles versus diesel heavy-duty vehicles to PM concentrations is an area of active research. A study of PM2.5 in Denver, Colorado, found that light-duty vehicles contributed a much larger fraction of PM2.5 emissions than did diesel vehicles (Fujita et al. 1998; Norton et al. 1998); however, the Southern California Air Quality Study found diesel heavy-duty vehicles to be the dominant contributor of mobile-source-emitted PM2.5 (Schauer et al. 1996).
The particle exhaust mixture includes elemental carbon resulting from incomplete combustion and organic and other compounds resulting from chemical reactions between combustion products. A large number of organic compounds are generated by the combustion of both gasoline and diesel fuel (see sample compositions in Zielinska et al. 2004; Shah et al. 2004). The semivolatile fraction of the emissions mixture for both
|
6 |
Chapter 3 discusses stoichiometric engine operations. |
fuels includes a large number of PAHs containing two to seven rings, as well as PAHs that include nitrogen, oxygen, and sulfur. Additional semivolatile HCs identified included hopanes and steranes, which are considered signature compounds for lubricating oil used in mobile sources. Both gasoline and diesel particles may also contain inorganic compounds and a range of trace metals. Twelve elements—Mg, Al, Si, P, S, Cl, Ca, Fe, Cu, Zn, Br, and Pb—have been regularly identified in the PM produced by light-duty vehicles (Gillies and Gertler 2000).
ON-ROAD MOBILE-SOURCE EMISSIONS
On-Road Vehicle Types
Approximately 236 million vehicles were registered in the United States in 2003 (FHWA 2005). As shown in Figure 2-11, roughly 136 million were passenger cars, 95 million were trucks, and 5 million were motorcycles. In 2002, roughly 86% of the truck fleet is composed of light-duty pickups, vans, and sport utility vehicles (SUVs) at a gross vehicle weight (GVW)7 of less than 8,500 lb; 7.5% comprised heavy-duty pickups, vans, and SUVs at a GVW of 8,500-10,000 lb; and 6.5% at a GVW of greater than 10,000 lb (Davis and Diegel 2004).8 Approximately 1.8 million truck tractors (heavy-duty trucks) and 800,000 buses were registered in 2003 (FHWA 2005). California registers nearly 13% of the nation’s vehicles; another 13% are registered in the Northeast (Maine, Vermont, New Hampshire, Connecticut, Massachusetts, Rhode Island, New York, and New Jersey) (FHWA 2005).
Passenger cars, as well as light- and heavy-duty pickups, vans, and SUVs are dominated by spark-ignition gasoline-powered engines. As described in later sections, passenger cars have historically been certified to more stringent emissions standards than light-duty pickups, vans, and SUVs. Because different vehicle classes have different emissions stan-
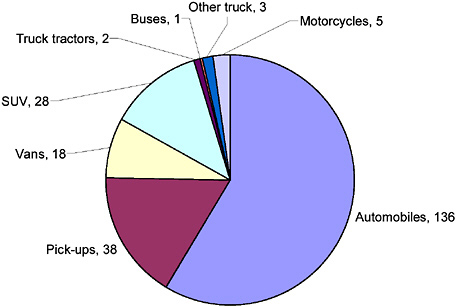
FIGURE 2-11 Number of registered vehicles in various on-road vehicle classes in 2003. A fraction of pickups, vans, and SUVs in the above figure are heavy-duty vehicles. Source: FHWA 2005.
dards, the mix of vehicle classes in the fleet plays an important role in fleet-wide emissions. Figure 2-12 shows how the mix of light-duty vehicles has changed with time. Pickups, vans, and SUVs accounted for only 20% of sales in 1976; sales of those vehicles have steadily increased over time and accounted for 50% of sales in 2003 (ORNL 2004).
The heaviest classes of trucks are powered predominantly by compression-ignition (diesel) engines. Although those vehicles are a small fraction of the total fleet, they contribute proportionally more to total vehicle miles traveled (VMT) and consume more fuel per mile, as shown in Table 2-3. Trucks greater than 26,000 lb GVW make up approximately 3% of the truck fleet, but contribute over 10% of all truck VMT and over 23% of all truck fuel use (U.S. Census Bureau 1999). A substantial number of heavy-duty vehicles on U.S. roads are also registered in other countries, especially Canada and Mexico, and those are not included in the reported totals.
Roughly 520,000 vehicles, or 0.2 % of the fleet, in 2002 used alternative fuels, such as liquid petroleum gas (LPG), compressed natural gas (CNG), alcohol-gasoline blends, or electricity (battery) (Davis and
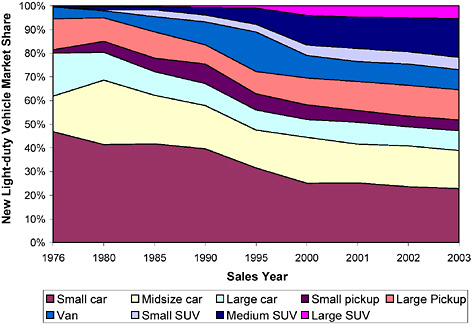
FIGURE 2-12 New light-duty vehicle market share by vehicle class from 1976 to 2002. The small-car category includes minicompact, subcompact, compact, and two-seater vehicles. Source: ORNL 2004.
Diegel 2004). These vehicles contribute little to the fleetwide emissions, although the number of hybrid vehicles, combined gasoline and battery powered, is increasing rapidly. New hybrid vehicle registrations totaled 83,153 in 2004, an increase of 81% over 2003, although this is less than 1% of the 17 million total new vehicles sold in 2004 (Durbin 2005).
On-Road Emissions Estimation
Emissions Modes
Mobile-source emissions are generally characterized as exhaust or evaporative emissions. Other categories of mobile-source emissions include tire and brake wear; however, these categories of emissions are not yet regulated. Exhaust emissions are the products of combustion or incomplete combustion and include HC, NOx, PM, SO2, CO, and Pb, as well as greenhouse gases and HAPs. The volume and composition of
TABLE 2-3 Comparison of 2003 Activity and FuelConsumption by Vehicle Type
|
|
Passenger Cars and Other 2-Axle, 4-Tire Vehicles |
Single-Unit 2-Axle, 6-Tire or More, and Combination Trucks |
Motorcycles |
Buses |
|
Average yearly miles traveled per vehicle |
11,939 |
27,286 |
1,776 |
8,548 |
|
Average milestraveled per gallon fuel consumed |
20.3 |
5.7 |
50.0 |
6.9 |
|
Source: FHWA 2005. |
||||
exhaust emissions depend on such factors as engine type and age, engine load, engine temperature, and quality of maintenance. Exhaust emissions are further divided into cold-start and running emissions. The former occur when a vehicle is initially started and the emission-control equipment has not yet reached a temperature of optimal pollutant removal, as discussed in Chapter 4.
Evaporative emissions include HCs and some HAPs and are divided into five types:
-
Resting loss: Vapor permeation and leaks from the evaporative emissions control system.
-
Diurnal: Evaporative emissions from idle equipment due to daily ambient temperature and pressure variations.
-
Running loss: Evaporative emissions during vehicle operation.
-
Hot soak: Evaporative emissions due to engine heat that persists after the vehicle has stopped operating.
-
Refueling loss: Includes vapors displaced in fuel tanks during refueling as well as volatilized spilled fuel.
Estimates from CARB’s current statewide inventory indicate that, on a typical day, the breakdown of light- and medium-duty reactive organic gas (ROG)9 emissions are 58% from exhaust; 30% from evaporative running losses; 5% from diurnal losses; 5% from hot-soak losses; and 2% from evaporative resting losses (refueling evaporative emissions not included in the total) (CARB 2005b). These distributions of emission types are broadly representative of actual conditions, but as discussed below, the models used to estimate exhaust and evaporative emissions include important uncertainties. For example, discrepancies have been found between data used in emissions models and data used in ambient measurements of the ratio of evaporative to exhaust emissions (Pierson et al. 1990, 1999).
Emissions Rates
The standard practice for estimating emissions rates for a source is to combine an emissions factor (EF) with an activity rate:
|
9 |
Refer to Appendix A on hydrocarbon classifications |
Emissions (mass/time) = EF (mass/unit activity) × activity rate (unit activity/time).
Emissions factors for light-duty on-road mobile sources are typically reported as mass pollutant per distance traveled (for example, grams of NOx/mile) and emissions standards are developed on such a basis. Evaporative emissions factors that do not depend on use, such as hot soak and diurnal evaporative emissions, are reported as mass/trip or mass/time. For heavy-duty on-road vehicles and nonroad vehicles and equipment, emissions factors are typically reported as mass pollutant per unit energy output (kilowatt-hour or brake horsepower-hour10) and emissions standards are developed on such a basis. Emissions factors are developed by the MOBILE and EMFAC models described in a later section.
Uncertainty and Variability in Emissions
Emissions vary considerably by vehicle and engine type, driving speeds, engine loads, fuel formulation, and ambient driving conditions. There is a great deal of uncertainty in how emissions change as a vehicle ages (emissions deterioration) and in how the change depends on vehicle make and model, where the vehicle is located, and maintenance factors. In-use measurement programs, such as exhaust remote sensing, state-run inspection and maintenance programs, and tunnel studies, are often used to characterize real-world emissions from vehicles. These efforts have confirmed that a small percentage of the fleet from each model year, called high emitters, contributes disproportional amounts to total emissions (Wayne and Horie 1983; Ashbaugh and Lawson 1991; Stedman et al. 1994; Bishop et al. 1999, 2000; Popp et al. 1999; Pokharel et al. 2000). (See NRC [2001] for more details on in-use measurements.) High-emitter vehicles have either been tampered with or have emission-control systems that have rapidly deteriorated or malfunctioned. Although emissions tend to increase with vehicle age, remote-sensing data have shown in the past that high emitters from newer model years may emit as much or more than the majority of older model year vehicles (Ashbaugh and Lawson 1991; Stedman et al. 1994; Bishop et al. 1999). A typical number reported in the literature is that approximately 10% of
the light-duty fleet emits 50-60% of the exhaust emissions. Pokharel et al. (2003) speculate that the combination of more durable components in newer vehicles and advanced technologies, such as on-board diagnostics, might be reducing the number of high emitters in newer generations of vehicles. Variability and uncertainty of vehicle emissions factors, especially in high-emitting, poorly maintained vehicles, remain important uncertainties in the estimation of vehicle fleet emissions.
On-Road Vehicle Activity
On-road vehicle activity is typically estimated in units of VMT. A widely used approach for calculating on-road VMT in urban areas is travel-demand modeling, which involves estimating the trips on each road in a transportation network by modeling travel requirements and preferences of the population. The travel-demand modeling results are provided by local metropolitan planning agencies. Travel-demand models can provide VMT for individual road segments by hour or multihour time periods (for example, a morning peak). Travel-demand models typically estimate total VMT across all vehicle types; VMT by vehicle type can then be determined from vehicle registration data in combination with assumptions about average mileage accumulation by vehicle type and age. The VMT from travel-demand models can be compared with estimates derived by traffic counters, thus improving model accuracy. Still, there is uncertainty in estimates which, in combination with uncertainty in emissions factors, leads to uncertainty in the estimated emissions.
Emissions Modeling
EPA has developed the MOBILE model for estimating on-road mobile-source emissions in the United States. The model was established in the 1970s to estimate the variability in vehicle emissions factors across the fleet. The estimates were then used to estimate changes in emissions resulting from planned changes in regional transportation.11 MOBILE has since evolved into a tool to develop emissions inventories ranging from yearly, nationwide, fleetwide estimates to hourly, roadway level,
vehicle-class-specific estimates. The most recent version, MOBILE6.2, released by EPA in 2004 (EPA 2003b), models the variation in emissions factors across roadway type, vehicle type, vehicle age, driving speeds, ambient conditions, fuel types, and different types of emissions-control programs.
Vehicle emissions rates are typically estimated as a function of a zero-mileage, new-car emissions factor and the deterioration of the emissions factor over time. The deterioration rates are determined from statistical analyses of extensive test programs on in-use vehicles and data from vehicle inspection and maintenance (I/M) programs. Adjustments are then made for in-use conditions, such as speed (by roadway type), ambient temperature and humidity, local fuel characteristics and regulations, and other control programs. These adjustments are typically based on test data under a broad range of conditions. (See NRC [2000] for a more complete description of how emissions rates are estimated.)
MOBILE is used to estimate historical emissions factors and future factors that are expected from possible changes in regulations, such as changes in vehicle emissions standards, changes in fuel composition, and I/M programs. California developed a similar model, EMFAC, to estimate on-road mobile-source emissions; the latest version of this model is EMFAC 2002. Although the EMFAC 2002 and MOBILE6.2 models are conceptually similar, there are a number of important differences:
-
EMFAC provides emissions factors (for example, g/mi) as well as mass emissions (for example, tons/day). Activity estimates for all mobile emissions sources by county are incorporated into the model. MOBILE6.2 estimates emissions factors only; mass emissions are estimated outside the model with activity estimates derived from local data.
-
EMFAC models California emissions standards in the California fleet and uses a larger number of vehicle classes, especially for later model years for which California’s low-emitting vehicle (LEV) standards are in place.
-
MOBILE6.2 estimates emissions factors by vehicle class and roadway type; EMFAC 2002 estimates emissions factors and emissions by vehicle class but not by roadway type.
-
MOBILE6 estimates ammonia emissions factors and mobile-source HAPs emissions factors; EMFAC does not.
-
MOBILE6 allows the user to estimate the benefits of equipping fleets with natural gas; EMFAC does not.
Uncertainties in Emissions Modeling
MOBILE is widely used in air quality management, although MOBILE and other mobile-source emissions models have important limitations. Underestimation of mobile-source emissions inventories, especially for CO and HCs, by a factor of two or more have been described (Ingalls 1989; Fujita et al. 1992; see also references in NRC [1991] and NRC [2000]). NRC (2000) identified several important fleet features for which test data were either insufficient or not treated adequately in mobile-source emission-estimation models. These features include the following:
-
Real-world changes in emissions with vehicle age and maintenance history compared with accelerated aging typically used in testing for both older and newer vehicles.
-
Emissions factors, activity levels, and population of high-emitting vehicles and how these vary by vehicle age, model, and geographic location.
-
Emissions factors for heavy-duty diesel vehicles and nonroad vehicles.
-
Emissions factors for HAPs and PM from all mobile sources.
The review also found that the lack of data has resulted in poor evaluation of the MOBILE model’s performance, and that the uncertainty in the model is not quantified or understood adequately (NRC 2000). EPA’s sixth-generation model of MOBILE (MOBILE6) is based on analyses of more data from EPA, CARB, and manufacturer exhaust and evaporative test programs, as well as data from in-use emissions measurements. EPA has recently released a draft version of their next generation of mobile-source model called “motor vehicle emission simulator” (MOVES).12
On-Road Mobile Emissions Inventory
Figures 2-13 and 2-14 show historical trends in on-road mobile CO, NOx, and VOC (or ROG) emissions by category for the United States and California, respectively. The figures show substantial reductions in
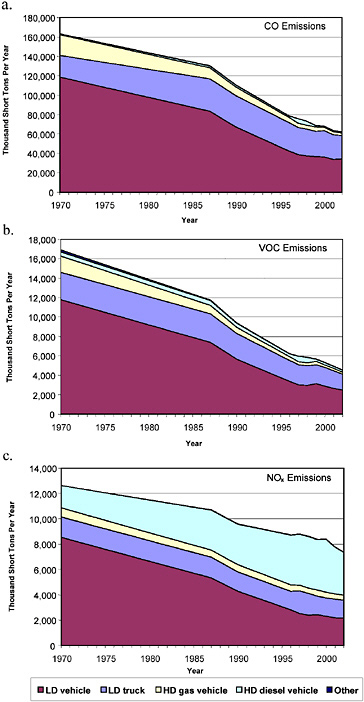
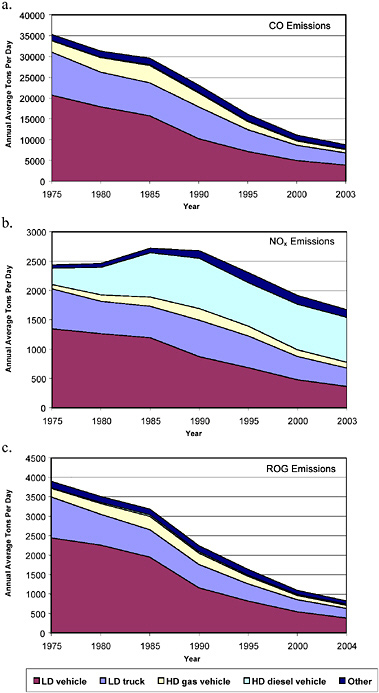
TABLE 2-4 Percent Change in Annual Emissions from 1980 to 2000 for NOx, VOC, and CO, and Percent Change in Annual Vehicle Miles Traveled from 1980 to 2000
|
|
Emissions |
National |
California |
|
|
|
NOx |
-27 % |
-22 % |
|
|
|
VOC |
-62 % |
-69 % |
|
|
CO |
-53 % |
-65 % |
||
|
VMT |
|
+ 80 % |
+ 105 % |
|
|
Sources: Davis and Diegel 2004 (vehicle miles traveled data); CARB 2005b, EPA 2005c (emissions data). |
||||
on-road light-duty vehicle emissions throughout the nation for all three pollutants since 1970, reductions that can be attributed to the regulation and control of emissions from these sources. Total NOx emissions have declined less than CO and VOC or ROG emissions because of the increase in diesel heavy-duty vehicle emissions resulting from the rapid increase in heavy-duty vehicle VMT that occurred in this period and from less stringent regulations compared with light-duty vehicles for most of this period. The figures highlight how emissions from light-duty trucks and diesel heavy-duty trucks became a more significant fraction of the on-road emissions inventories as light-duty vehicle emissions have been reduced. Table 2-4 shows the percent change in annual on-road emissions and VMT between 1980 and 2000 in the United States and in California. The table highlights the significant decreases in on-road emissions despite increases in vehicle activity. The uncertainties related to emissions modeling and VMT estimates discussed above apply to these emissions estimates.
NONROAD MOBILE SOURCES AND EMISSIONS
Nonroad Vehicle and Equipment Types and Emissions Estimation
Nonroad sources comprise a wide variety of vehicles and equipment with many different uses as listed in Table 2-5. Nonroad vehicle and equipment population and activity are not known as accurately as they are for on-road vehicles because only some sources, such as recreational boats and snowmobiles, are registered, and fewer data have been collected on nonroad source activity. Figure 2-15 shows estimated U.S.
TABLE 2-5 Nonroad Mobile-Sources Categories
|
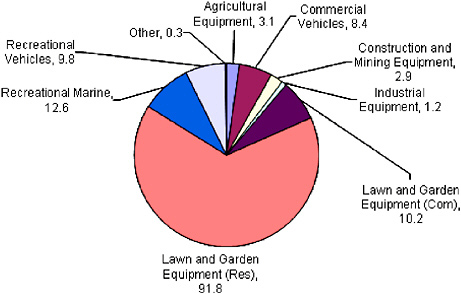
FIGURE 2-15 National 2002 estimates for nonroad equipment population by source category (in millions). The total population for all source categories is approximately 140 million. The basic equation for estimating emissions is the NONROAD model is the following: Emissions = Pop Power LF A EF, where Pop = engine population, Power = average power (hp), LF = load factor (fraction of available power), A = activity (hr/yr), and EF = emission factor (g/hp-hr). Source: Data from EPA 2006.
nonroad populations by equipment type for 2002. The estimates in Figure 2-15 are from the NONROAD2004 model that EPA used to inventory and estimate emissions from nonroad sources other than aircraft, locomotive, and commercial marine sources (EPA 2006).13 Equipment populations and activity data in the NONROAD model are largely based on proprietary data from Power Systems Research (PSR), a market research company (EPA 2004c). PSR provides national population estimates, and the NONROAD model estimates county populations for each equipment type by using socioeconomic and other spatial allocation surrogates. Because of the uncertainty in the county population and activity estimates, EPA encourages state and local agencies to perform surveys, or use other measures to derive local estimates. Such surveys are costly, however, and only a few have been performed.
Of the 140 million estimated nonroad engines, 66% are associated with residential lawn and garden equipment, which are dominated by small spark-ignition engines. Ninety-five percent of all engines in the NONROAD model use gasoline, 4% use diesel, and less than 1% use compressed natural gas (CNG) or liquefied petroleum gas (LPG).
Nonroad Emissions Inventories
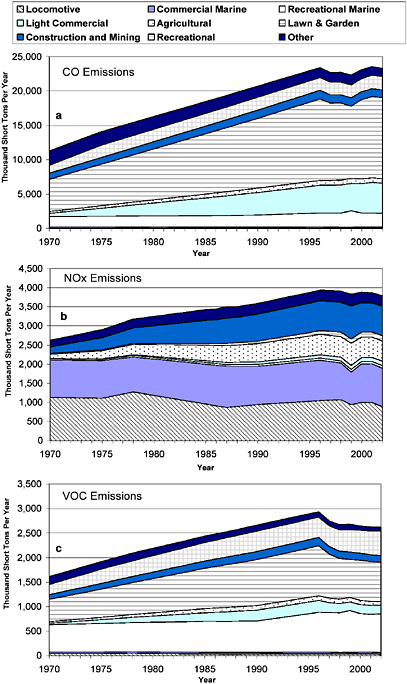
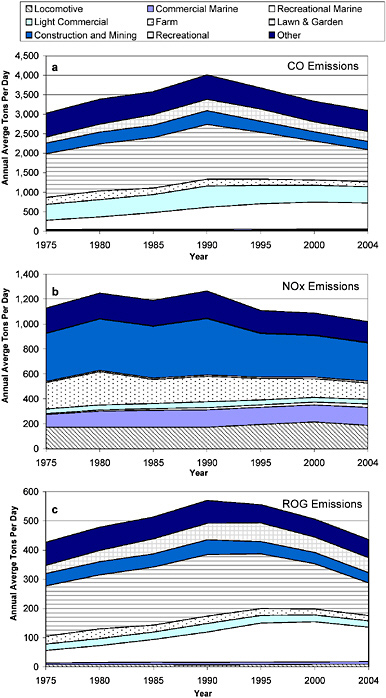
As shown in Figure 2-10, nonroad source emissions are an increasing fraction of total emissions of CO, NOx, and VOCs in the United States. Figures 2-16 and 2-17 show historical trends in nonroad mobile-source emissions by major category for the United States and California, respectively. The figures show the diversity of sources that contribute to the inventories of all three pollutants. Lawn and garden equipment, recreational land, and recreational marine equipment are the three largest sources of CO and VOC or ROG nonroad inventories nationwide and in California. In contrast, nonroad NOx emissions are dominated by locomotive, commercial marine, construction, and mining equipment. The figures also show that all three pollutants’ emissions rose until the early to mid-1990s, owing to limited regulation before 1990, and that reductions were achieved in California earlier than in the entire nation. The uncertainties related to emissions and activity estimates discussed in relation to on-road sources also apply to these emissions estimates.
LINK BETWEEN EMISSIONS AND AIR QUALITY
Factors Influencing Variability in Air Quality
Mixing, transport, chemical reaction, and physical removal of emitted pollutants directly influence the ambient concentrations to which populations are ultimately exposed. These processes are complex, given the dynamic nature of the atmosphere and the numerous gas and particle air pollutants with different physical and chemical properties. They can also vary significantly from region to region, leading to different ambient pollution levels in regions that have similar emissions.
Meteorology and topography influence air pollutant concentrations through effects on vertical mixing, wind speeds, temperature, humidity, and emissions. Atmospheric inversions occur when the temperature of the atmosphere increases with altitude, greatly reducing vertical mixing in the atmosphere. Combined with low wind speeds, inversions prevent air circulation because colder air is trapped near the ground by warmer air above. The California South Coast Air Basin, Fairbanks (Alaska), and Denver (Colorado) are examples of urban areas where vertical and horizontal transport is limited by topography and meteorology (NRC 2003). Such conditions allow pollutants to accumulate and enhance chemical and photochemical transformations due to longer residence times of precursors. In regions with limited ventilation, exceedances of the NAAQS can occur at emissions concentrations that generally do not lead to NAAQS exceedances in other regions.
Another phenomenon that can cause regional differences in ambient air pollution concentrations is the long-range transport of pollutants. The northeastern United States experiences increased air pollutant concentrations in part because of long-range precursor and pollutant transport from industrialized regions in the Midwest. Regions affected by long-range transport of pollutants might need to reduce local emissions to a greater extent to meet the NAAQS than areas not affected by regional transport.
Spatial and Temporal Variability in Mobile-Source Emissions
In addition to the factors discussed above, variability in emissions inventories may affect variability in air quality between and within regions. On-road and nonroad mobile sources are significant contributors to emissions inventories in all major urban areas. Figure 2-18 shows that
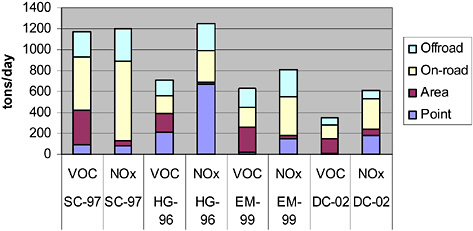
FIGURE 2-18 Representative emissions inventories (tons/day) from areas that are in nonattainment of the ozone NAAQS, based on 1-hr averaged concentrations. The California South Coast (SC) and Houston (HG) have average daily inventories. Eastern Massachusetts (EM) and District of Columbia (DC) areas have “ozone season” daily inventories. See Table 2-2 for definitions of emission-source categories in legend. Sources: MADEP 2002; TNRCC 2002; MWCG 2003; SCAQMP 2003.
the fraction of total emissions due to mobile sources varies significantly from region to region. For the four regions reported in the Figure, the fraction of total emissions due to mobile sources ranges from 45% to 65% for VOCs and 45% to 89% for NOx. Factors influencing regional differences in mobile emissions include population, activity patterns, regional characteristics of the fleet (the distribution of vehicle types and ages), and control programs in place.
The spatial variation of some primary pollutants within a single region can follow the spatial pattern of emissions, including mobile-source emissions. Figure 2-19 shows how CO, black carbon (similar to elemental carbon), and particle number vary in close proximity to a major highway (Zhu et al. 2002). Such primary pollutants emitted from motor vehicles will not have uniform concentrations across a region, and spots with higher concentrations of ambient pollutants can occur at discrete locations. These locations often are in places with high vehicle traffic, although topographical and meteorological conditions also play a role.
Mobile-source emissions also vary by day of week and throughout the day, which influences ambient concentrations of primary pollutants,
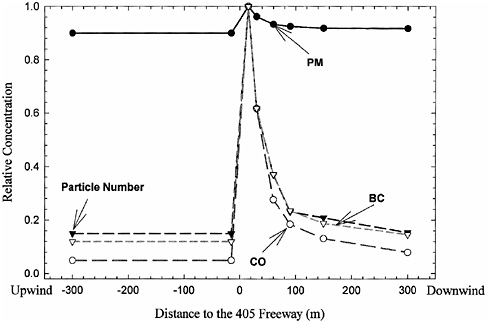
FIGURE 2-19 Total particle number, black carbon (similar to elemental carbon), and CO concentrations versus downwind distance from a freeway. Source: Zhu et al. 2002. Reprinted with permission; copyright 2002, Air & Waste Management Association.
such as CO, and secondary pollutants, such as ground-level ozone. In areas influenced by commuter traffic, emissions from light-duty vehicles typically peak during the morning and afternoon rush hours. Minimal ozone concentrations in urban areas on weekday mornings are common and are attributed to commuter traffic NO emissions that chemically remove ozone, as described previously. Ozone has also been observed to be as high or higher on weekend days than on weekdays in some urban areas, which is known as the weekend ozone effect. (See recent review by Heuss et al. [2003], and analyses by Pun et al. 2003, and Fujita et al. [2003], Blanchard and Tanenbaum [2003, 2005]). These analyses have also found that NOx and, in some cases, CO concentrations are significantly lower on weekends than weekdays. One explanation for reduced precursor concentrations on weekends is reduced emissions on weekends, particularly mobile-source NOx (Chinkin et al. 2003). Because NOx can result in both ozone formation and removal as well as secondary PM
formation, there is some debate as to the effectiveness of NOx emissions reduction for ozone and PM control (Croes et al. 2003; Lawson 2003).
HAZARDOUS AIR POLLUTANTS
HAPs (also called air toxics) are compounds or compound groups that may cause serious health effects, even at low concentrations. Unlike criteria pollutants, HAPs do not have NAAQS. In the 1990 CAA, Congress mandated that EPA regulate a list of approximately 190 HAPs. The CAA amendments further direct EPA to assess the need and feasibility for emissions standards of HAPs from mobile sources and to regulate these emissions as necessary (CAA section 202(l)). In 2001, EPA issued a rule that identifies 21 HAPs associated with mobile sources, including benzene, 1,3-butadiene, formaldehyde, acetaldehyde, and total PM from diesel exhaust. The EPA rule projects that current mobile emissions standards and fuel formulations that address criteria pollutants are sufficient mitigation strategies for HAPs. Thus, there are no separate federal standards for mobile-source HAPs; however, reducing HAP benefits regulation of criteria pollutants and their precursor emissions from mobile sources. Ambient concentrations of HAPs have not been monitored for as long as criteria pollutants. Ambient concentrations of benzene, an important mobile-source HAP, from 95 urban locations decreased by 47% on average from 1994 to 2000 (EPA 2003a). It should be noted that indoor sources also contribute to exposure of some HAPs.
AIR QUALITY HEALTH EFFECTS FROM EXPOSURE TO MOBILE SOURCES
Effects on health resulting from exposure to air pollutants depend on a large number of variables, including the contaminants present during the exposure, the toxicity of the contaminants, their concentrations and durations of exposure, the dose, and the health status of the person exposed. Exposure to mobile-source air pollutants typically occurs within the context of exposure to a host of air pollutants from a host of sources, and health effects are probably due to exposure to the mixture and not to any one contaminant or source. However, health effects related to exposure to several key constituents of the mobile-source emis-
sions mixture are well understood. There also is research correlating air pollution health impacts to proximity to major roadways, although an assessment of the research is beyond the scope of this committee.
Carbon Monoxide
The toxic properties of CO have been extensively characterized and are directly related to the ability of CO to competitively bind to the heme group of hemoglobin. The binding mechanism of CO is identical to that of O2, but the affinity of CO for heme is 234 times as great as that of O2. As a result, when CO is present, it is more likely to bind and remain attached to hemoglobin, creating the potential for hypoxia if the concentrations are high enough (Townsend and Maynard 2002). The acute toxic effects of CO are well known and range from headache and shortness of breath at low percentage of hemoglobin bound to CO (%COHb) to death when the %COHb reaches 50% to 90%. Typical ambient concentrations of CO generally do not produce acute toxic effects; however, in the NAAQS nonattainment area of Southern California, a relationship between chronic exposure to CO and birth outcomes was reported (Ritz et al. 2002). CO at ambient concentrations is also hypothesized to affect the health of persons suffering from cardiovascular disease. For persons with preexisting heart disease, exposure to CO at low concentrations has been shown to have an impact on cardiac function (Allred et al. 1989). Although the evidence is inconsistent, studies of the relationship between exposure to ambient air pollutants and cardiovascular disease have suggested an association between some outcomes and CO (Morris et al. 1995; Schwartz and Morris 1995).
CO is unique among the criteria air pollutants because of its significance for both ambient air quality management and public safety. Outdoor exposures to CO at very high and lethal concentrations were reported from motor boat exhaust (CDC 2004), and from farm equipment (CDC 1997). Control of CO through new-vehicle emissions standards has had a significant collateral public-safety benefit through the reduction of accidental CO poisoning (Cobb and Etzel 1991; Shelef 1994; Marr et al. 1998). For example, Mott et al. (2002) discussed how exposure to motor vehicle CO emissions results in a substantial number of accidental deaths and estimates the number of accidental CO poisonings that have been prevented as a result of more stringent CO emissions standards.
Oxides of Nitrogen
Evidence for health effects associated with exposure to NO2 remains inconclusive. The health effects of exposure to NOx are largely related to exacerbation of symptoms of respiratory disease. Short-term exposures (for example, less than 3 hr) to low concentrations of NO2 might result in changes in airway responsiveness and lung function in persons with preexisting respiratory illnesses. Such exposures might also increase respiratory illnesses in children. Long-term exposures to NO2 might result in increased susceptibility to respiratory infection and might cause irreversible alterations in lung structure (EPA 2004d).
Hydrocarbons
A broad range of VOCs have been identified in both diesel and gasoline emissions. Individual VOCs found in the emissions mixture are themselves toxic. Although health effects of exposure to the entire mixture have not been characterized, the toxicities of many of the components of the mixture are well understood. The health effects of a few mobile-source organic compounds that are considered HAPs are described below.
1,3 Butadiene
1,3-Butadiene is generated by incomplete combustion of gasoline and diesel fuel. Butadiene is a mildly irritating gas that can cause neurological symptoms at high exposure concentrations. Epidemiological studies of workers exposed to butadiene in rubber plants found an increased risk for cardiovascular disease (ATSDR 1993). Animal studies found developmental and reproductive effects related to inhalation exposure (EPA 2002a). Butadiene exposures were also associated with the development of leukemia and other lymphomas in both epidemiological and animal studies, and EPA has classified butadiene as a human carcinogen (EPA 2002a).
Benzene
Both on-road and nonroad gasoline-powered mobile sources contribute benzene to the ambient air. Benzene is a known human carcinogen and is associated with the development of leukemia. Neurological symptoms of inhalation exposure to benzene include drowsiness, dizziness, headaches, and unconsciousness in humans (EPA 2005e).
Formaldehyde
Formaldehyde is a nearly colorless gas with a pungent, irritating odor even at concentrations below 1 ppm. Formaldehyde is an eye, skin, and respiratory tract irritant. Inhalation of vapors can produce narrowing of the bronchi and an accumulation of fluid in the lungs. The systemic effects of formaldehyde may include metabolic acidosis, circulatory shock, respiratory insufficiency, and acute renal failure. Formaldehyde is a potent sensitizer at high concentrations and a probable human carcinogen (ATSDR 2004).
Benzo(a)pyrene
Acute effects of benzo(a)pyrene at increased concentrations potentially include red-blood cell damage, resulting in anemia and a suppressed immune system. Long-term exposure to benzo(a)pyrene might result in developmental and reproductive effects. It was classified as a carcinogen by the International Association of Cancer Research (IARC 1973).
Particulate Matter
Epidemiological studies over the last several years consistently demonstrated a statistical relationship between exposure to particles and cardiopulmonary morbidity and mortality (Pope et al. 1991; Dockery et al. 1993; Samet et al. 2000; Pope et al. 2002; Metzger et al. 2004). Toxicological studies exploring specific mechanisms of injury from exposure to PM supported the epidemiological findings (Ghio et al. 2000; Framp-
ton et al. 2002; Utell et al. 2002; Devlin et al. 2003). For persons suffering from chronic obstructive pulmonary disease (COPD), which includes chronic bronchitis, emphysema, and some cases of chronic asthma, exposure to PM can induce inflammatory responses resulting in exacerbation of symptoms. Adverse physiological effects in individuals diagnosed with cardiovascular disease have been associated with increased PM exposure. These effects include increased blood pressure, cardiac arrhythmias, increased oxidative stress and inflammation, and progression of atherosclerosis. Pope et al. (2002) also found a statistically significant increase in the risk of developing lung cancer associated with exposure to particulate air pollution.
Studies examining health effects related to exposure to PM from mobile sources have primarily focused on diesel exhaust. Diesel exhaust, which includes hundreds of organic compounds and includes particles in the ultrafine size range, was designated as probable human carcinogen by IARC (1989) and EPA (2003c). Some studies suggested that ultrafine particles, which do not contribute substantially to the total particle mass, might carry a greater risk per weight than particles of other sizes (HEI 2002). Several specific components of mobile-source particles were shown to be toxic. A large number of polycyclic aromatic hydrocarbons (PAHs) have been identified in the exhaust of both diesel- and gasoline-powered vehicles, including benzo(a)pyrene. Additional carcinogenic compounds, such as dioxins, have also been identified in the exhaust stream from both diesel and gasoline vehicles. Measurements of TCDD (2,3,7,8-tetrachlorodibenzo-p-dioxin) ranged from about 2 picograms (pg) of toxicity equivalent quotient per kilometer (TEQ/km) to 5,100 pg TEQ/km for a diesel light-duty vehicle (HEI 2002). A recent study of exhaust particles plus semi-VOCs showed no difference in the toxicity of gasoline and diesel exhaust from light-duty vehicles, and more potent on an equivalent mass basis from high-emitter vehicles than normal emitters (Seagrave et al. 2002).
Ozone
Although ozone is not a component of mobile-source emissions, components of the emission mixture result in the formation of ozone. Ozone is the product of photochemical processes involving VOCs and NOx, and is formed in greatest abundance during summer months when sunlight is strongest. Ozone is a known respiratory irritant and can cause
inflammation of the airways resulting in breathing restrictions. For persons suffering from respiratory illnesses, such as COPD and asthma, exposure to ozone can be especially problematic. Significant association between daily variations in ambient ozone concentrations and adverse health outcomes, such as lung function decrements, aggravation of preexisting disease, increases in hospital admissions and emergency room visits for respiratory symptoms, and increases in mortality have been found by a large number of epidemiological studies (Thurston and Ito 1999). A recent study has also found an association between short-term changes in ozone and short-term mortality for 95 large urban areas in the United States, although the potential for statistical confounders is a concern (Bell et al. 2004).
CONCLUSIONS
Substantial progress has been made over the past few decades in reducing air pollutant emissions from many sources, including mobile sources. However, some locations in the Unites States continue to experience ambient concentrations of criteria pollutants above the NAAQS. Further improvements in air quality will be needed, particularly to attain the recently adopted standards for fine particulate matter and ozone. Evidence presented in the chapter suggests that mobile-source emissions contribute to poor air quality and have important health effects. The following conclusions are drawn based on the evidence:
-
Mobile sources, both on-road and nonroad, are major sources of precursors for ground-level ozone and PM2.5. Estimates of emissions suggest that mobile-source emissions are composed of approximately 50% anthropogenic NOx and VOC emissions inventories and approximately 75% anthropogenic CO inventories. On-road light-duty vehicles are still the largest contributor to total mobile emissions, even though their emissions have been decreasing despite increases in vehicle activity. Nonroad emissions have remained relatively constant since 1970. As a result, the relative amount of nonroad to on-road emissions has been increasing over this period.
-
There are many uncertainties in the methods and data used to estimate mobile- source emissions and thus in the estimates themselves. The technical, research, and regulatory community continue to fill data gaps, thereby improving the methods.
-
The contribution of mobile-source emissions to air pollution varies from area to area. Ambient concentrations of pollutants depend on several factors, such as the relative mix of sources, the extent of pollutant transport, the meteorology, and the topography of the area. The result is that different levels of controls on mobile and nonmobile sources are typically required for different areas in the Unites States.


