
2
Vehicle Dynamics
Vehicle rollover is a complex event that has been the subject of many investigations since the 1950s.1 The term “rollover” describes the condition of at least a 90-degree rotation about the longitudinal axis of a vehicle.2 When lateral forces create a large enough roll moment about the vehicle’s center of gravity for a sufficient length of time, the vehicle will roll over. These lateral forces can be generated under a variety of conditions, such as contact with a mechanical obstacle (a curb, pothole, or furrow plowed during an off-road maneuver), or during maneuvers on the roadway.
A wide variety of testing has been performed in an effort to understand rollover. Vehicle tests and simulations typically deal with the onset of rollover rather than a full 90-degree roll. Testing generally falls into one of two categories:
-
Static testing is performed in the laboratory. It may involve the measurement of vehicle parameters (e.g., center of gravity height, track width) that are then combined to yield static metrics related to a vehicle’s rollover propensity—for example, static stability factor (SSF). Alternatively, static tests of entire vehicles, such as the tilt table and side pull tests described later in this chapter, may be performed to obtain data that can be correlated with a vehicle’s rollover propensity.
-
Dynamic testing is performed on a test track and involves driving maneuvers. Although dynamic tests are potentially helpful in understanding the events immediately preceding rollover, they are expensive and require safety precautions for test drivers. Furthermore, repeatability may be difficult to achieve. In view of the challenges associated with dynamic testing, computer stimulations have been undertaken using mathematical models to predict vehicle behavior associated with rollover.
This chapter responds to the congressional request for “a comparison of the static stability factor test versus a test with rollover metrics based on dynamic driving conditions that may induce rollover events.” Following some brief background, the chapter provides a review of static measures of rollover
|
1 |
For a review of the literature on rollover, see Lund and Bernard (1995a). |
|
2 |
The Crashworthiness Data System (see Chapter 3) also classifies “end over end” rotation about the lateral axis of a vehicle as a rollover, contrary to the normal vehicle dynamics definition of the term. However, end-over-end rollovers typically constitute a very small proportion (on the order of 2 percent) of the total number of rollovers. |
propensity, with particular emphasis on SSF. Discussion of the different phases of a rollover crash then illustrates the complementary nature of static measures and dynamic tests, and makes the case for dynamic testing. Next, some general comments are provided on dynamic testing and the associated challenges facing the National Highway Traffic Safety Administration (NHTSA) in its task, mandated under the Transportation Recall Enhancement, Accountability, and Documentation (TREAD) Act, of developing dynamic tests pertinent to consumer information on rollover. The chapter concludes with the committee’s findings and recommendations in the area of vehicle dynamics.
BACKGROUND
With few exceptions, vehicles that may roll over during a vehicle test are constrained by outriggers that prevent rollover. Test engineers define the onset of roll in a variety of ways. Most conservatively, the onset of roll is defined as at least one wheel leaving the ground during the course of a test; less conservative definitions require two-wheel liftoff or contact of the outriggers with the test pad.
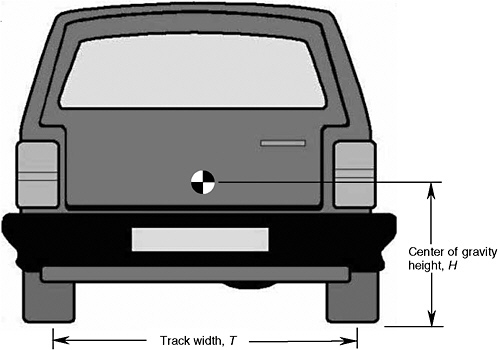
From the viewpoint of simulation, the onset of rollover may also be determined in a variety of ways. The vehicle model leading to SSF characterizes the onset of rollover as a scenario in which the lateral forces become large enough that, if they continue long enough, rollover must result. As Figure 2-1 indicates, T is the track width (strictly, the average of the front and rear track widths), and H is the height of the vehicle’s center of gravity. SSF is defined as the track width divided by twice the center of gravity height; i.e., SSF = T/2H. The theoretical basis for SSF calls for rollover if the sum of the lateral forces on the tires, divided by the weight of the vehicle, is greater than T/2H for a sufficient length of time (Gillespie 1992).
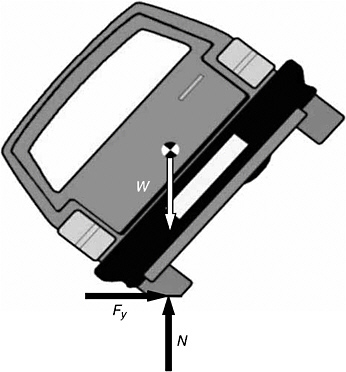
Using more complex models, analysts focus on the instant when both of the normal forces between the tire and the road on one side of the vehicle drop to zero in the course of a given maneuver. Alternatively, incipient roll can be categorized by the instant in time when the vehicle’s center of gravity moves beyond the balance point above the leading side tires, as illustrated in Figure 2-2.
Rollover events are sometimes classified as either tripped or untripped. A rollover that occurs as a result of forces on the tire created by a mechanical obstacle, such as a curb or other surface irregularity (e.g., a furrow plowed during an off-road maneuver), is described as tripped. In contrast, a rollover is described as untripped if the vehicle rolled solely as a result of the lateral forces created at a smooth tire–road interface. As discussed in Chapter 3, the National Automotive Sampling System Crashworthiness Data System categorizes rollovers as either tripped or untripped on the basis of interpretation of crash scene and vehicle inspections, as well as other supporting evidence. However, the physics governing the motion of vehicles reveals that it is the magnitude and duration of the forces on the vehicle that determine whether
a rollover will occur (see the later discussion of SSF). Therefore, the present discussion focuses on the magnitude of the forces rather than the mechanism of force generation, and is not concerned with making the distinction between tripped and untripped rollovers.
STATIC MEASURES OF ROLLOVER PROPENSITY
Several static measures and tests have been developed to characterize a vehicle’s rollover propensity (see, for example, Lund and Bernard 1995b). The commonly cited measures fall into two categories:
-
Quantities such as SSF and critical sliding velocity (CSV) that are calculated from measured vehicle parameters; and
-
Quantities derived from tests of entire vehicles—notably the tilt table test, side pull test, and centrifuge test—that depend on experimental results instead of measurements of vehicle dimensions and inertial properties.
The following discussion addresses the advantages and disadvantages of these different static measures, with particular emphasis on SSF—the metric that forms the basis for NHTSA’s star ratings for rollover resistance.
Static Stability Factor
When a vehicle has a velocity vector at a large angle from the direction in which it is aligned, the tire–road interface can generate large lateral forces on the tires, as illustrated in Figure 2-3. Assuming a rigid-body model, that is, a model that does not deflect under the influence of the applied forces, straightforward physics yields the insight that if the sum of the lateral forces on all four tires is large enough for a sufficiently sustained period of time, the vehicle will roll over. Note that the rigid-body model cannot predict time-dependent details of the rollover, which are scenario-specific. Simulation of time-dependent rollover requires a much more complex model (see, for example, Chrstos and Heydinger 1997).
In particular, the vehicle model predicts rollover if, for a sufficiently sustained period of time
(1)
where W is the weight of the vehicle, ∑F indicates the sum of the lateral forces on all four tires, and T/2H is the vehicle’s SSF.
Relationship 1 is often viewed another way. Fundamental physics states that
(2)
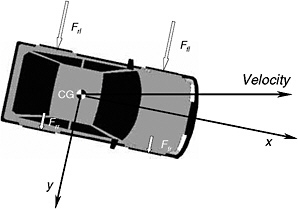
FIGURE 2-3 Lateral forces leading to rollover: plan view with steered wheels to the front. (NOTE: xy axis = vehicle coordinate axis; Frl = lateral force on the rear left tire; Ffl = lateral force on the front left tire; Frr = lateral force on the rear right tire; Ffr = lateral force on the front right tire; and CG = center of gravity.)
where a is the lateral acceleration, and m is the mass of the vehicle (= W/g, where g is the gravitational constant).
It follows directly from Relationship 1 and Equation 2 that if, for a sustained period of time,
(3)
the vehicle model will predict rollover. This relationship is a scientifically valid statement of the physics of the motion of this vehicle model and the cornerstone of the utility of SSF. In particular, the model predicts that rollover will occur when the lateral acceleration in g’s exceeds the SSF for a sustained period of time.
Consider now Relationship 3 in the context of a smooth road surface. For the scenario depicted by Figure 2-3, it is common to characterize the relationship between the lateral forces on the tires and the normal load upward on the tires by a coefficient of friction, µ. This can be stated as
(4)
That is, the sum of the lateral forces is equal to the product of a tire–road friction coefficient, µ, and the weight of the vehicle. In this case, Relationship 1 yields the information that if, for a sustained period of time,
(5)
rollover will occur. For a good dry paved surface, µ may be in the neighborhood of 0.9; for a wet or icy surface, µ is considerably less.
The importance of Relationship 5 is that if situations such as that depicted in Figure 2-3 continue for a long enough period of time, the model yields rollover if the friction coefficient characterizing the tire–road interface exceeds the SSF. If µ is relatively low, as on a wet or icy road, the vehicle will slide rather than roll because the lateral forces will be small, and the lateral accelerations will be far less than T/2H. In other scenarios not involving a smooth road surface, the large lateral forces resulting in rollover can be generated by interactions between the tire(s) and a curb, a pothole, a roadside slope, a furrow plowed during an off-road maneuver, or some other tripping mechanism.
The model that leads to Relationships 3 through 5 presumes that the vehicle is a rigid body. For real vehicles, rollover is expected in maneuvers that are less severe than called for by Relationships 3 through 5 because T is reduced as a result of lateral compliance of the suspension and tires, suspension kinematics (geometry changes), and body roll. In addition, for large roll angles, H can be increased by suspension kinematics. In particular, the lateral acceleration that, in time, produces rollover is lower than the level called for by Relationship 3. Thus for a real vehicle, Relationship 5 indicates that rollover is expected even if µ is less than T/2H. In each case, a 15 percent lower rollover threshold is a reasonable expectation, with the variation among particular vehicles being significant (Lund and Bernard 1995b).
More detailed mathematical models can yield information about the decrease in lateral acceleration that causes rollover compared with the value indicated by SSF. In a generic sense, simple additions to the model that yields SSF give an indication of the likely decrease (see, for example, Bernard et al. 1989). However, the provision of information applicable to specific vehicles requires far more detail. Furthermore, implementing vehicle-specific details in a complex simulation involves a great deal more time and expense than testing the vehicle itself. Thus the compelling feature of SSF, as seen in Relationships 3 through 5, is that it provides a clearly defined bound: if the sustained lateral acceleration exceeds this bound, rollover occurs. Follow-up analysis, not obvious from the preceding discussion, indicates that although the lateral acceleration in g’s can exceed T/2H for a short time without causing rollover, the more this acceleration exceeds T/2H, the less will be the time to rollover. Rollover events involving very large lateral accelerations far in excess of T/2H g are sometimes classified as tripped rollovers.
Critical Sliding Velocity
Like SSF, CSV is calculated using measurements of vehicle parameters. CSV is an estimate of the minimum sideways velocity required for a vehicle to just barely tip over as a result of sliding sideways into a curb, as illustrated
schematically in Figure 2-4. [A simple derivation of CSV is presented by Meriam (1959) and Jones (1973), with slightly more complicated versions presented by Lund and Bernard (1995a).] Like SSF, CSV increases when track width increases and decreases when center of gravity height increases. A criticism of this measure is that it is based on the presumption of no energy loss after the collision with the curb, thus ignoring important losses in the suspensions (Gillespie 1992). Furthermore, in contrast to SSF, which is about equally sensitive to changes in T and H, CSV is much more sensitive to T than to H. This greater sensitivity derives from CSV’s focus on curb trip as opposed to the more general focus of SSF—a vehicle sliding out of control on a smooth surface (Lund and Bernard 1995b).
Tilt Table Ratio
To determine tilt table ratio (TTR), the vehicle is positioned at rest on a table. As indicated by Figure 2-5, the table is tipped up until the (restrained) vehicle attempts to roll downhill. TTR is the tangent of the angle of the table when the front and rear wheels on the uphill side of the vehicle first lift up. If the suspension of the vehicle and its tires were rigid rather than compliant, the measurement of TTR would be the same as SSF.
Some believe TTR is a better measure than SSF and CSV because it includes some of the effects of the compliance of the suspensions and tires. Thus, TTR yields a lower threshold of minimum lateral acceleration needed to pro-
FIGURE 2-4 Configuration for use of critical sliding velocity.
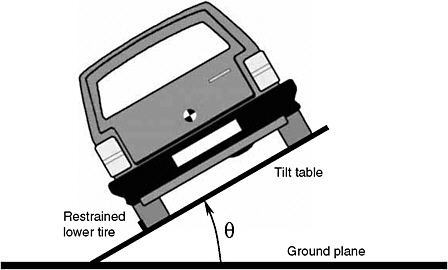
FIGURE 2-5 Tilt table test—tilt table ratio equals tangent of angle theta (θ).
duce a rollover than is the case with SSF. The flaw in the test is that as the table is tipped up, the total weight supported by the tires (perpendicular to the tilt table) drops, and the suspension tends to move into rebound (i.e., the suspension loads drop) and away from the curb equilibrium position. This in turn causes the vehicle center of gravity to move away from the tilt table, and thus makes the car more prone to rollover than it would be on a horizontal surface.
There is also a potential undesirable consequence of using TTR to assess rollover propensity. In some cases, measured TTR values can be increased by altering suspensions in a way that degrades vehicle directional response. In particular, best test results are obtained by having front and rear uphill wheels lift at the same time. This means vehicles with balanced front and rear roll stiffness will yield better TTR test results than otherwise similar vehicles with unequal roll stiffness, even though unequal roll couple distribution often produces improved dynamic performance (Federal Register 2001). Thus, a vehicle rating system that used TTR to rank rollover propensity could encourage undesirable design trade-offs and vehicles with inferior directional response characteristics.
Side Pull Test
The side pull test provides another static measure of vehicle rollover propensity; Figure 2-6 shows a schematic of a side pull test facility. In this case, test engineers pull the vehicle sideways with a horizontal force at the height of the vehicle’s center of gravity. If there were no compliance in the suspensions and tires, the force required to tip the vehicle over, divided by the weight of the vehicle, would be the same as the SSF. Because of suspension and tire
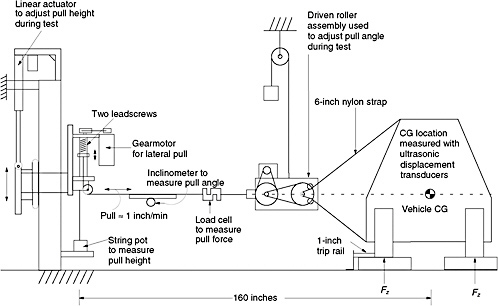
compliance, however, the side pull test yields results lower than SSF; in other words, it predicts a lower sustained lateral acceleration level required for vehicle rollover. As in the case of TTR, some believe the inclusion of suspension and tire compliances makes the side pull test superior to SSF. Detractors point out that the side pull test has one of the same flaws as TTR: it is possible in some cases to obtain improved results by making suspension changes that degrade the vehicle’s directional response. Furthermore, the side pull test is difficult to perform.
Centrifuge Test
Another vehicle-based static measure of rollover propensity derives from the centrifuge test, illustrated in Figure 2-7. The centrifuge device uses an arm attached to a powered vertical shaft. The test vehicle is parked on a horizontal platform at the end of the arm. As the platform rotates, the parked vehicle is subjected to lateral acceleration. When the lateral acceleration is high enough, the vehicle will tip up against its restraints. If there were no compliance in suspensions and tires, the acceleration required to tip the vehicle up would be the same as that predicted by SSF. A positive aspect of this test is that, as with TTR and side pull, compliance in the tires and suspensions influences the measurements. This test also shares an important flaw with TTR and side pull: it is possible in some cases to obtain improved results by making suspension changes that degrade the vehicle’s directional response (Federal Register 2001).
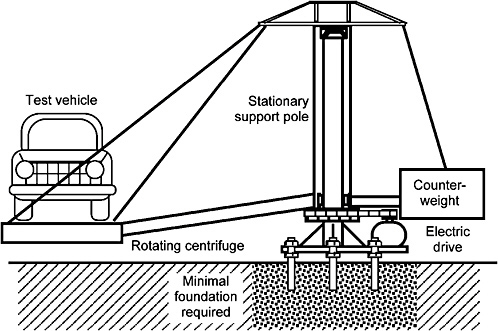
FIGURE 2-7 Schematic of centrifuge test. (SOURCE: Federal Register 2001.)
Summary
In summary, SSF is an important indicator of vehicle rollover propensity. Based on a rigid-body model of a vehicle, it relates easily measured vehicle parameters to a level of sustained lateral acceleration that leads to vehicle rollover. Real vehicles roll over at lower sustained levels of lateral acceleration than the accelerations predicted by SSF.
There are comparable static metrics derived from measurement of vehicle parameters (CSV, TTR) or from tests of entire vehicles (side pull and centrifuge tests). All things considered, SSF is preferable to CSV because its underlying model is better, and it has a wider range of applicability. Furthermore, unlike the tilt table, side pull, and centrifuge tests, SSF does not encourage vehicle designs that could, in some circumstances, lead to undesirable trade-offs affecting directional response.
There remains the concern that SSF is overly broad-brush because it does not address the question of how the vehicle might have gotten into situations such as that illustrated in Figure 2-3. In short, why did the vehicle start sliding sideways in the first place? And if the out-of-control vehicle had been equipped with a stability control system, would the vehicle have remained under control? These questions cannot be addressed by static measures; to resolve them, dynamic testing is required.
NEED FOR DYNAMIC TESTING
Both vehicle design and driver skill influence the way a vehicle handles in any maneuver. During transient maneuvers involving high lateral acceleration, many vehicle design parameters have been shown to have an effect on vehicle handling behavior (e.g., front-to-rear roll couple distribution, roll axis location, tire behavior, suspension characteristics, and roll resonant frequency, to name a few). The handling characteristics of the vehicle during such a maneuver have a significant influence on the ability of the driver to maintain control of the vehicle in an emergency situation. Under such circumstances, and before control of the vehicle is lost, there are significant differences among vehicles. These differences cannot be understood on the basis of static metrics.
Consider, for example, Figure 2-8. At the left side of the figure (Phase 1) the vehicle is under control. In the left section of the middle portion of the figure (Phase 2), both driver control inputs and vehicle characteristics determine the outcome of the maneuver. In this region, particularly at its very start where loss of control begins, all vehicle braking, acceleration, and handling characteristics could be important, depending on the control inputs selected by the driver. The driver inputs are limited to three: use of the steering wheel, the brake pedal, and the accelerator pedal. As loss of control progresses from mild to severe (the right section of the middle portion of Figure 2-8), driver inputs and vehicle design parameters become less important. Finally, the right
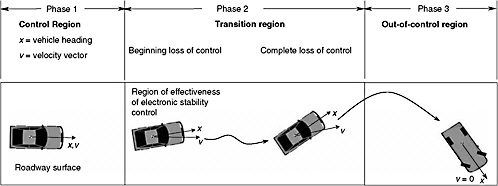
side of the figure (Phase 3) shows the vehicle out of control, in a situation analogous to that of Figure 2-3. Once the vehicle is in this configuration, SSF and the terrain over which the vehicle is moving are the dominant determinants of whether rollover will occur. The main motivation for dynamic testing is the need to understand the transition region of Figure 2-8, where driver actions, vehicle design, and such features as electronic stability control are important.
Electronic Stability Control
Some manufacturers are now offering computer-controlled systems that attempt to stabilize the vehicle early in the transition region of Figure 2-8. There are several trade names for these systems, but they all fall into the category of electronic stability control.
Electronic stability control systems monitor a vehicle’s movement and the direction the driver is steering by measuring such items as steering wheel position, vehicle speed, and rate of rotation of the vehicle about its vertical axis (yaw rate). If the driver inputs and the vehicle response do not correspond, a computer attempts to enhance the driver’s ability to maintain control of the vehicle by selectively braking individual wheel(s) or changing power applied to the wheels. These computer-adjusted control inputs3 cause the vehicle to conform more closely to a trajectory estimated from vehicle sensors as that desired by the driver.
Electronic stability control systems are able to stabilize a vehicle only if there is sufficient reserve frictional capacity between the selected wheel or tire and pavement to generate a force at the tire in the right direction to stabilize the vehicle. The merit of these systems lies in preventing a vehicle from entering a situation leading to the out-of-control region in which rollover occurs (Phase 3 in Figure 2-8).
Static measures such as SSF do not provide information about the performance of electronic stability control systems. Such an assessment requires dynamic testing.4
Complementarity of Static Measures and Dynamic Testing
On the basis of discussions with a wide range of interested parties (see Appendix B), the committee concluded that there is broad agreement among informed constituencies that static metrics such as SSF are valuable in assessing a vehicle’s rollover propensity. Nevertheless, because SSF does not provide
insights into how vehicles get out of control, it cannot yield an understanding of a rollover crash in its entirety, from initiation to final outcome. Gaining this understanding requires investigation of the transition region illustrated in Figure 2-8.
DYNAMIC TESTING: FEATURES AND CHALLENGES
Important Features
The characteristics that distinguish dynamic testing from other vehicle tests are the transient nature of the controls applied to the vehicle and the vehicle’s subsequent transient response. Dynamic tests can address one of three possible regimes: the normal driving range, which includes lateral accelerations up to about 0.3 g on a smooth, dry surface; the midrange of lateral acceleration, usually up to about 0.5 g on a smooth, dry surface; or the very high range of lateral acceleration. Typically, tests well above the range of 0.5 g of lateral acceleration on a dry surface are referred to as limit maneuvers, that is, maneuvers that test the limits of vehicle performance.
There is an important difference between testing in the range of normal driving and testing near the limits of vehicle performance. In the normal driving range, a few tests can provide information applicable to other scenarios in that range. In contrast, near the limits of vehicle performance, vehicle response to input controls is scenario-specific. In short, results from one test conducted near the limit of vehicle performance are not necessarily a reliable indicator of the results to be expected from another such test.
Dynamic testing, from the normal driving range through limit maneuvers, is pursued by every major automobile and truck manufacturer, various government and consumer agencies, and popular enthusiast magazines. The tests performed take different forms, reflecting the variety of interests of the test designers. Those interests determine why the tests are conducted, and include vehicle design, comparative evaluation of vehicles, regulatory development, and research.
Challenges
Section 12 of the TREAD Act directs NHTSA to “develop a dynamic test on rollovers by motor vehicles for a consumer information program; and carry out a program conducting such tests.”5 These tests will be limit maneuvers.
Since the results of all limit maneuvers depend on the particular scenario used for the test, the development of dynamic tests for rollover is challenging.
The challenge is to choose scenarios that have broad applicability, with the understanding that the results do not cover all situations that could lead to rollover. An additional challenge is that vehicle manufacturers and consumer groups have experience with the tests they currently use.6 They likely will be required to duplicate any new tests mandated at their own facilities. Such tests either will replace or will be added to current test protocols, and in either case, manufacturers, consumer groups, and others involved in vehicle testing will incur additional expense.
A further difficulty is that any test chosen and incorporated into regulations will influence manufacturers’ designs. Given the complex trade-offs associated with vehicle design, NHTSA will be challenged to select one or more dynamic tests that will not have unintended detrimental consequences as manufacturers pursue a competitive advantage by designing to the test(s).
The tests recommended by NHTSA in response to the TREAD Act will need to be repeatable. That is, it will be expected that the tests can be repeated at the same track on the same day under nearly identical conditions with highly similar results. Furthermore, it will be desirable, though not expected, that the tests can be repeated with similar results from one test track to another. Reproducibility from track to track is problematic, however, because limit ma-neuvers are affected by environmental conditions. In particular, the coefficient of friction between the tires and the track varies from place to place.
In any discussion of the repeatability of the results of limit maneuver tests, an additional challenge arises: the need to choose between closed-loop and open-loop tests, each of which has its proponents. Some favor closed-loop tests, in which human drivers encounter situations that test roll stability. Others favor open-loop tests, in which the control inputs to the vehicle are predetermined and delivered to the vehicle in a highly repeatable way, often with a computer-based controller.
An advantage of closed-loop testing is that there can be a satisfying intuitive match between the tests and the challenges faced by human drivers. An example of such a test is the Consumers Union double-lane-change short-course avoidance maneuver, which is designed to simulate real-world situations in which a driver needs to avoid an obstacle in the road. This test is used to determine the maximum speed at which a test driver can navigate a course involving a series of sharp turns. On the other hand, closed-loop tests are sometimes criticized because the drivers have too great an influence on the outcome.
An advantage of open-loop testing is that the outcome of the test is not driver-dependent. An example of an open-loop test is the fishhook test now under development by NHTSA (Federal Register 2001). In fishhook tests, vehicles under computer control execute a precisely controlled steering input
|
6 |
During its visits to the Ford, General Motors, and DaimlerChrysler facilities (see Appendix B), the committee established that each company uses an extensive suite of static and dynamic tests in developing its vehicles, but that different companies use different tests. |
one way, followed, at a time signaled by the on-board computer, by a precisely controlled steering input the other way. Such tests are sometimes criticized on the grounds that the maneuvers are not similar to those made by drivers on the road (Federal Register 2001).
From the perspective of the controls input to the vehicle, it is clear that open-loop testing is more repeatable than closed-loop testing and, in that sense, more objective. Debate remains, however, as to whether open-loop tests provide information that pertains to real-world driving experiences. The committee regards this as an area in which legitimate differences of opinion can exist. Should NHTSA rely on open-loop testing, it will be incumbent on the agency to provide the rationale linking the open-loop scenarios selected to actual driver experiences.
Summary
In summary, SSF is a scientifically based static measure that provides information on a vehicle’s rollover propensity in out-of-control situations. Dynamic testing provides information on a vehicle’s crash-avoidance characteristics; it discriminates among vehicles with a similar SSF but a different likelihood of getting into out-of-control situations. Both static measures and dynamic testing are needed to investigate a rollover crash in its entirety, from initiation to final outcome. A suitable dynamic test protocol should, at a minimum, make it possible to segregate driver or vehicle systems that are susceptible to loss of control from those that are more robust.
FINDINGS AND RECOMMENDATION
Findings
|
2-1. |
Through a rigid-body model, SSF relates a vehicle’s track width, T, and center of gravity height, H, to a clearly defined level of the sustained lateral acceleration that will result in the vehicle’s rolling over. The rigid-body model is based on the laws of physics and captures important vehicle characteristics related to rollover. |
|
2-2. |
SSF is preferable to other static measures as an indicator of a vehicle’s rollover propensity. |
|
2-3. |
Dynamic testing is needed to understand the loss-of-control phase of a crash in which driver actions, vehicle design, and such features as stability control are important. The development of one or more appropriate dynamic tests will require complex choices and extensive evaluation of test options. |
|
2-4. |
Dynamic testing is required to assess the performance of electronic stability control systems and their potential for reducing the likelihood of a loss of control before rollover. |
Recommendation
|
2-1. |
NHTSA should vigorously pursue the development of dynamic testing to supplement the information provided by SSF. |
REFERENCES
Bernard, J.E., J. Shannan, and M. Vanderploeg. 1989. Vehicle Rollover on Smooth Surfaces. SAE 891991, Society of Automotive Engineers.
Chrstos, J.P., and G.J. Heydinger. 1997. Evaluation of VDANL and VDM RoAD for Predicting the Vehicle Dynamics of a 1994 Ford Taurus. SAE 970556, Society of Automotive Engineers.
Federal Register. 2000. Consumer Information Regulations; Federal Motor Vehicle Safety Standards; Rollover Prevention; Request for Comments. Vol. 65, No. 106, June 1, pp. 34,998–35,024.
Federal Register. 2001. Consumer Information Regulations; Federal Motor Vehicle Safety Standards; Rollover Resistance; Request for Comments. Vol. 66, No. 128, July 3, pp. 35,179–35,193.
Gillespie. 1992. Fundamentals of Vehicle Dynamics. Society of Automotive Engineers.
Jones, I.S. 1973. Road Accident Studies with Particular Reference to the Handling and Stability Characteristics of Cars. Ph.D. thesis. University of London.
Lund, Y.I., and J.E. Bernard. 1995a. Highway Vehicle Simulation. In SVM-13 Shock and Vibration Computer Programs (Pilkey and Pilkey, eds.), Shock and Vibration Analysis Center (SVAC), Falls Church, Va.
Lund, Y.I., and J.E. Bernard. 1995b. Analysis of Simple Rollover Metrics. SAE 950306, Society of Automotive Engineers.
Meriam, J.L. 1959. Mechanic, Part II: Dynamics. 2nd ed. John Wiley and Sons, Inc., New York, pp. 298–299.


