
CHAPTER 2
THE CONTEMPORARY MATERIALS SCENE
THE NATURE OF MATERIALS
This report is concerned primarily with industrial materials that are used to make things—products like machines, devices and structures. Such materials are ubiquitous, so pervasive we often take them for granted. Yet they play a central role in much of our daily lives, in practically all manufacturing industries, and in much research and development in the physical and engineering sciences. Materials have a generality comparable to that of energy and information, and the three together comprise virtually all technology.
Materials are basic to manufacturing and service technologies, to national security, and to national and international economies. The housewife has seen her kitchen transformed by progress in materials: vinyl polymers in flooring; stainless steel in sinks; Pyroceram and Teflon in cookware. The ordinary telephone contains in its not-so-ordinary components 42 of the 92 naturally-occurring elements. Polyethylene, an outstanding insulator for radar equipment, is but one of myriad materials vital to national defense. By one of several possible reckonings, production and forming of materials account for some 20% of the nation’s Gross National Product, but the number is deceptive; without materials we would have no Gross National Product.
Man tends to be conscious of products and what he can do with them, but to take the materials in those products for granted. Nylon is known far better in stockings than as the polyamide engineering material used to make small parts for automobiles. The transistor is known far better as an electronic device, or as a pocket-size radio, than is the semiconducting material used in the device and its many relatives.
Some materials produce effects far out of proportion to their cost or extent of use in a given application. Synthetic fibers, in the form of easy-care clothing, have worked startling changes in the lives of housewives. Certain phosphor crystals, products of years of research on materials that emit light when bombarded by electrons, provide color-television pictures at a cost of less than 0.5% of the manufacturing cost of the set.
The properties of specific materials often determine whether a product will work or not. In manned space flight, ablative materials of modest cost are essential to the performance of the heat shield on atmospheric reentry vehicles. New or sharply improved materials are critical to progress in
energy generation and distribution. At the other extreme are home-building materials, whose properties, though important, need not be markedly improved to meet society’s goals in housing.
Materials commonly serve a range of technologies and tend to be less proprietary than are the products made of them. Materials, as a result, are likely to offer more fruitful ground for research and development, including cooperative research and development, than are specific products. One example is fiberglass, which can be used for making pleasure boats, housing construction, and automobile bodies. Another example is certain “textured” materials, polycrystalline structures in which the alignment of neighboring crystals is determined by the processing steps employed. The ability thus to control crystal orientation grew out of research by physicists, metallurgists, and even mathematicians. The resulting improvements in properties are proving useful in a widening spectrum of applications. They include soft magnetic alloys for memory devices, oriented steels for transformers, high-elasticity phosphor bronze for electrical connectors, and steel sheet for automobile fenders, appliance housings and other parts formed by deep drawing.
THE NATURE OF MATERIALS SCIENCE AND ENGINEERING
Materials science and engineering is a multidisciplinary activity that has emerged in recognizable form only during the past two decades. More specifically:
Materials science and engineering is concerned with the generation and application of knowledge relating the composition, structure, and processing of materials to their properties and uses.
The multidisciplinary character of materials science and engineering is evident in the educational backgrounds of the half-million scientists and engineers who, to varying extents, are working in the field. Only about 50,000 of them hold materials-designated degrees*; the rest are largely chemists, physicists, and nonmaterials-designated engineers. Many of these professionals still identify with their original disciplines rather than with the materials community. They are served by some 35 national societies and often must belong to several to cover their professional and technical needs. This situation is changing, if slowly. One recent indication was the formation of the Federation of Materials Societies in 1972. Of the 17 broadly-based societies invited to join, nine had done so by October, 1973.
Materials are exceptionally diverse. Correspondingly, the scope of materials science and engineering spans metals, ceramics, semiconductors, dielectrics, glasses, polymers, and natural substances like wood, fibers,
sand, and stone. For COSMAT purposes, we exclude certain substances that in other contexts might be called “materials.” Typical of these are food, drugs, water, and fossil fuels. Materials as we define them have come increasingly to be classified by their function as well as by their nature; hence biomedical materials, electronic materials, structural materials. This blurring of the traditional classifications reflects in part our growing if imperfect ability to custom-make materials for the specific functions required of them.
MATERIALS IN THE U.S. ECONOMY
The United States, with about 6 percent of the world’s population, consumes from 25 to 50 percent of the world’s output of resources. The American people have become accustomed to a great variety and quantity of material goods from a resource base which may be diminishing. Private industry, our society’s instrument for providing these material goods, has evolved a remarkably successful producing system to keep pace with ever growing product demand. World trade and improved technology are both parts of this system. Our country must export products to pay for the raw materials imports. And it is through continued scientific and technological progress to improve the efficiency of materials use that we compete successfully in world product markets.
About 20 percent of our Gross National Product originates in the extraction, refining, processing, and forming of materials into finished goods other than food and fuel. All materials pass through a number of stages in their economic utilization. At each stage, value is added and cost is incurred to pay for energy, production and research, manpower, administration, and finally disposal and recycling costs. The primary instrument generally used in our society for implementing this utilization of materials is private industry. Competing in the market place under ground rules established by society through its governmental bodies, private industry attempts to minimize the cost of materials utilization in order to produce quality goods that satisfy its customers, and to provide a reasonable return on investment to its owners.
The consumption of basic materials in the U.S. has been growing steadily (Table 2.1), along with the population and standard of living. Another measure of the impact of materials on the economy is manufacturing employment related to materials, which was just over 16 million in 1970, or about 21% of total employment.
A third measure of the importance of materials in the nation is their contribution to the National Income or to the Gross National Product1. Table 2.2 indicates the main industrial categories contributing to the former and
TABLE 2.1 Consumption of Selecteda Basic Materials in the U.S. (Millions of Tons)
|
|
1950b |
1971b |
|
1950b |
1971b |
|
Aluminum |
1.3 |
5.5 |
Clays |
39.5 |
55.1 |
|
Calcium |
N.A. |
90.3 |
Gypsum |
11.4 |
15.7 |
|
Copper |
2.0 |
2.4 |
Pumice |
0.7 |
3.5 |
|
Iron |
94.5 |
122.2 |
Sand and gravel |
370.9 |
987.7 |
|
Lead |
1.4 |
1.3 |
Stone, crushed |
N.A. |
823.0 |
|
Magnesium |
N.A. |
1.1 |
Stone, dimension |
N.A. |
1.8 |
|
Manganese |
1.1 |
1.2 |
Talc |
0.6 |
1.1 |
|
Phosphorus |
1.7 |
5.1 |
… |
|
|
|
Potassium |
1.2 |
4.5 |
Agricultural fibers |
N.A. |
2.1 |
|
Sodium |
N.A. |
19.0 |
Forest products |
N.A. |
237.0 |
|
Sulfur |
6.8 |
12.4 |
Plastics |
1.0 |
10.0 |
|
Zinc |
1.1 |
1.2 |
|
||
|
aCommodities used in excess of 1 million tons in 1971. Totals include government stockpiling, industry stocks, and exports. Foods and fuels are not included. b1950 actual; 1971 estimated. Source: First Annual Report of the Secretary of the Interior under the Mining and Minerals Policy Act of 1970, March 1972. Figures for agricultural fibers, forest products, and plastics compiled by COSMAT from various sources. |
|||||
TABLE 2.2 Distribution of National Incomea of the United States by Industry Category–1965
their distribution in 1965. The two categories of Mining and Manufacturing relate primarily to materials, and it can be seen that they contribute some 31.6% to the National Income. An additional amount arises from the 3.76% represented by Agriculture, Forestry,and Fisheries. The specific contribution of materials in the above categories is strongly concentrated in particular subcategories. Table 2.3 and the corresponding Table 2.4 for GNP in 1971 show the distribution among the principal subcategories; those relating primarily to materials are metal-mining, mining and quarrying of nonmetallic materials, paper and allied products, rubber and miscellaneous plastic products, leather and leather products, lumber and wood products, stone, clay and glass products, primary metal industries, and fabricated metal products. These operations on materials account for perhaps one-tenth of the nation’s consumption of fuels.
While the above groups alone constitute a significant portion—some 9%–of the National Income, there are additional and major materials contributions in most of the other manufacturing subcategories which cannot be separated in terms of their share of the National Income. The difficulty stems from the nature of this measure of economic activity, which is the aggregate earnings of labor and property that arise in the current production of goods and services by the nation’s economy, i.e. the total factor costs of the goods and services produced by the economy.
An alternative economic approach that might be adapted to give better insight into the contributions of materials is the modeling of the structure of an economic system by “input-output” or “inter-industry” analysis originated by W.W.Leontief of Harvard University. The technique describes the production process in a given industry in terms of a detailed accounting of its purchases from other industries, i.e. its inputs of raw and semifinished materials, components, and services. The complete record of inter-industry transactions described in this way within the entire economy is displayed as a square-matrix or input-output table. This method has been used to identify the primary materials component of the economy in the sense discussed above, but only partially separates materials in the various manufacturing areas. In any case, the analysis is still concerned with economic value, whereas many of the questions and problems associated with materials flow are concerned with mass or volume rather than value alone.
Despite these limitations for the present purpose, some results of particular interest concerning materials have arisen from the application of the technique carried out by Carter2 in which structural changes in the U.S. economy arising from changes in technology were analyzed by comparing input-output tables prepared for two different years–1947 and 1958. The results show strikingly the relative increase over this period in “nonmaterial” or “general” inputs (these include energy, communications, trade, packaging, maintenance construction, real estate, finance, insurance and other services, printing and publishing, business machines and information technologies) that are largely balanced by relative decreases in the input of
TABLE 2.3 Distribution of National Income of the United States within Selected Industry Categories–1965
|
A. |
MINING CATEGORY ($6,432 million=1.15% National Income) |
|||
|
|
SUBCATEGORY |
SHARE OF CATEGORY (PERCENTAGE) |
||
|
|
Metal Mining |
15.93 (0.18)a |
|
|
|
|
Coal Mining |
21.16 (0.24) |
|
|
|
|
Crude Petroleum and Natural Gas |
43.14 (0.50) |
|
|
|
|
Mining and Quarrying of Nonmetallic Materials |
19.76 (0.23) |
|
|
|
|
100.0 |
|
||
|
B. |
MANUFACTURING CATEGORY ($170,408 million=30.48% National Income) |
|||
|
|
SUBCATEGORY |
SHARE OF CATEGORY (PERCENTAGE) |
||
|
|
Nondurable Goods: |
|||
|
|
|
Food and Kindred Products |
8.50 (2.59) |
|
|
|
|
Tobacco Manufacturers |
0.70 (0.21) |
|
|
|
|
Textile Mill Products |
3.44 (1.05) |
|
|
|
|
Apparel and Other Fabricated Textile Products |
3.85 (1.17) |
|
|
|
|
Paper and Allied Products |
3.36 (1.02) |
|
|
|
|
Printing, Publishing, and Allied Industries |
5.06 (1.54) |
|
|
|
|
Chemicals and Allied Products |
7.24 (2.20) |
|
|
|
|
Petroleum Refining and Related Industries |
2.97 (0.71) |
|
|
|
|
Rubber and Miscellaneous Plastic Products |
2.34 (0.71) |
|
|
|
|
Leather and Leather Products |
1.07 (0.33) |
|
|
|
38.53 (11.74) |
|||
|
|
Durable Goods: |
|||
|
|
|
Lumber and Wood Products, except Furniture |
2.42 (0.74) |
|
|
|
|
Furniture and Fixtures |
1.67 (0.51) |
|
|
|
|
Stone, Clay, and Glass Products |
3.40 (1.04) |
|
|
|
|
Primary Metal Industries |
8.65 (2.64) |
|
|
|
|
Fabricated Metal Products |
6.65 (2.03) |
|
|
|
|
Machinery, except Electrical |
10.77 (3.82) |
|
|
|
|
Electrical Machinery |
8.34 (2.54) |
|
|
|
|
Transportation Equipment and Ordnance, except Motor Vehicles |
6.78 (2.07) |
|
|
|
|
Motor Vehicles and Motor Vehicle Equipment |
8.53 (2.60) |
|
|
|
|
Instruments |
2.58 (0.78) |
|
|
|
|
Miscellaneous Manufacturing Industries |
1.68 (0.51) |
|
|
|
61.47 (18.74) |
|||
|
|
100.0 |
|||
|
a Figures in parentheses indicate the subcategory share as a percentage of the total National Income. |
||||
TABLE 2.4 Selected Industry Components of the Gross National Product (1971) (1971 GNP=$1,050,356 million)
|
|
Millions |
% of GNP |
|
Metal Mining |
$ 1,290 |
0.12 |
|
Mining and Quarrying of Nonmetallic Metals |
1,654 |
0.16 |
|
Stone, Clay, and Glass Products |
8,710 |
0.83 |
|
Primary Metal Industries |
18,923 |
1.80 |
|
Fabricated Metal Products |
16,427 |
1.56 |
|
Machinery, except Electrical |
26,066 |
2.48 |
|
Electrical Machinery |
22,388 |
2.13 |
|
Transportation Equipment, except Motor Vehicles |
14,582 |
1.39 |
|
Motor Vehicles and Motor Vehicle Equipment |
22,824 |
2.17 |
|
Instruments |
6,456 |
0.61 |
|
Miscellaneous Manufacturing Industries |
4,144 |
0.39 |
|
Chemicals and Allied Products |
20,387 |
1.94 |
|
Rubber and Miscellaneous Plastic Products |
7,371 |
0.70 |
|
Lumber and Wood Products, except Furniture |
6,395 |
0.61 |
|
Furniture and Fixtures |
3,984 |
0.38 |
|
Paper and Allied Products |
9,357 |
0.89 |
|
Textile Mill Products |
8,234 |
0.78 |
|
Apparel and Other Fabricated Textile Products |
9,293 |
0.88 |
|
Leather and Leather Products |
2,219 |
0.21 |
|
|
$210,704 |
20.03 |
|
Source: U.S. Department of Commerce |
||
materials and semifinished goods. Thus, the iron and steel sectors declined relatively some 27% (despite substantial growth in absolute terms), reflecting substitution by aluminum and plastics together with design changes to reduce the total amount of metal used by taking advantage of the improvements developed in steel properties and performance. A relative decline of 23% in nonferrous metals is the balance resulting from increased use of aluminum and the decreased use of other nonferrous metals. In addition to the relative decline of the materials inputs (which basically represents a more efficient use of materials), Carter shows that
“the classical dominance of single kinds of material—metals, stone, clay and glass, wood, natural fibers, rubber, leather, plastics and so on—in each kind of production has given way by 1958 to increasing diversification of the bill of materials consumed by each industry. This development comes from interplay between keenly competitive refinement in the qualities of material and design backward from end-use specifications.”
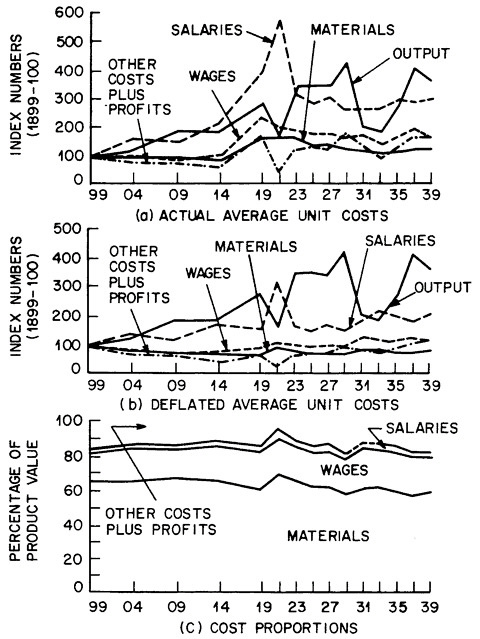
These interpretations of the influence of technological change appear to be in keeping with the results of a different type of economic analysis involving materials flows reported recently for an earlier period by Gold.3 For a variety of manufacturing industries, the influence of technological innovation over the 40-year period through 1939 was found not to be directly detectable in the proportioning among deflated unit costs (materials, wages, and salaries, and other costs plus profits) over this long-time series. The horizontal trend exhibited by the data (for steel-mill products in Figure 2.1) shows that the proportions of the cost components have remained approximately constant, despite the introduction of specific technological advances at known points in time. These observations do not mean an absence of benefits from technological progress, but rather that such progress was so pervasive in the economy at large that advances in a given industry simply maintained its competitive position with other industries. On this basis, the innovations have directly benefited consumers of a given industry’s products (in effect, much of the economic gain has been passed on to them), but have not provided much competitive advantage beyond that of effective survival in a given market.
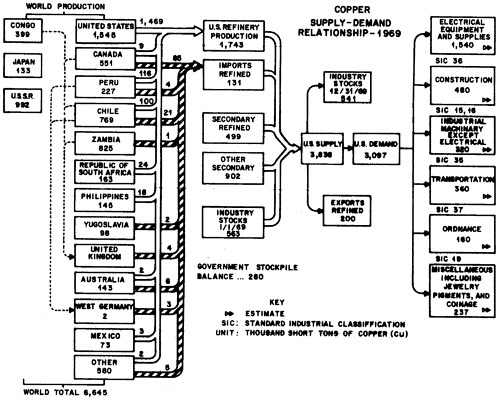
The preceding discussion has indicated some of the principal economic measures and models for materials flows. An important contribution in relating these economic factors to the associated bulk flows is provided by the U.S. Bureau of Mines in an Analysis of the supply-demand relationships for mineral resources and commodities. In their 1970 report4 which covers
88 commodities, the emphasis of the analysis was broadened from an essentially “supply” orientation to include intermediate forms and end-uses. This change is especially important for the problem of predicting the evolution of future demand—such as is done in the analyses to the year 2000–but is also critical for the monitoring of materials flows at the present time. It, and the subsequent reports from the Secretary of U.S. Interior, provide specific information on a large group of resources that supplement still broader discussions of resource adequacy, such as those presented by Landsberg5 and the National Academy of Sciences study, Resources and Man6.
An example of the supply-demand data is shown for copper in Figure 2.2. The significant features of the data are that (a) the flow at any stage is expressed in terms of the mass of elemental metal, whether or not the commodity exists in that form at that stage, (b) the world sources of the metal that contribute to the total U.S. supply are delineated by country of origin, and (c) the resulting U.S. supply is broken down into industry stocks and exports as well as into the proportions going into specific industries (identified in terms of the Standard Industrial Classification developed by the U.S. Department of Commerce).
Data of the type provided by the Bureau of Mines analyses should permit the setting up of a bulk-flow model involving the 88 different commodities as elemental materials, although the present information does not appear to be sufficiently comprehensive with respect to the industrial classifications used. Thus, a square-matrix analog of the inter-industry type would be less complete and interpretable than for the economic model developed by Leontief. Furthermore, it is important to be able to identify the actual bulk flow at various stages rather than simply the elemental flow, and knowledge is also needed relative to the residuals developed at all stages as well as the extent of recycling and final disposal. Reliable statistical information on residuals in the form of both new scrap material (resulting during manufacture and processing stages) and old scrap (from the discarded unit or component after use by the consumer) is now becoming available through the efforts of various federal agencies and interested trade associations. However, such data are still incomplete, especially with respect to old scrap and its long-term accumulation from past activity. Furthermore, information on nonsolid discharges is particularly limited.
In the preceding discussions, the question of competition between variants of the same material (e.g. different alloys) and between different materials (e.g., plastics and metals) is visible as a significant factor in determining changes in materials flow with time. Such competition is one
aspect of the broader concept of substitution, which has emerged from an earlier restricted connotation of the use of an inferior material in a given application for a superior one that is limited in availability or higher in cost. Previously-used derogatory terms such as “cheap plastic” or “tinny” are indicative of that earlier meaning. However, perhaps one of the most important aspects of the revolution in the diversity of available technological materials is that the improved understanding of the science and technology of materials now offers a better basis for developing options in providing materials for specific needs, i.e. for providing substitutes that match or improve upon the performance of other materials. The continuing demand for materials in the future and the decreasing availability of specific materials as nonrenewable resources are consumed or become uneconomic, together with the restrictions imposed by the need to control environmental quality, will require a vigorous extension of this understanding of substitutions in the future. It may be even more useful to take into account the broadest interpretation of substitution. Thus, one should consider not only the materials-flow implications of substituting one material for another in the same class (e.g. aluminum for copper in electrical conductors) or for one in another class (e.g. fiberglass for ceramics in sewer pipes), but also of substituting an entire technology (e.g. transport by automobile rather than by horse or by aircraft rather than ship, electric power from nuclear fission or fusion rather than from fossil fuel).
Despite the shortcomings in the range of quantitative data available on materials flows in the United States, it appears that there is already sufficient information on past and present flows to merit assembling into an initial framework. A desirable first step in this direction has already been taken by the U.S. Bureau of Mines in the development of a computer-storage system for information on resource reserves. The expansion of such inventories to include the supply-demand data of the type in Figure 2.2, together with associated information on residuals and recycling, would be an appropriate next step. However, such inventories are essentially static models and the nature of the problems associated with our dynamic society require at least the exploration of possible dynamic models that would highlight the consequences of the complex interactions involved in materials flows on a national or international scale. One such approach would be to simplify the problem by restricting it to a consideration of mass flows between industrial sectors in an analog of the Leontief system. Here, the influence of changing technical or market opportunities or social demands would be inserted indirectly through changes in the output requirements of specific industries. This technique would permit the exploration of mathematical models for technological forecasting relating to future materials demands, such as that suggested by Fisher and Pry7. Also, with the development of appropriate input data, this method should be adaptable to accommodate more completely the full variety of flows operative in the total materials cycle.
An alternative approach is the even more ambitious and controversial systems-dynamics analysis developed by Meadows et al8 on the basis of the global model suggested by J.Forrester. Here, materials enter the model principally as natural resources and a component of pollution—which are two of the five basic factors (the other three being population, agricultural production, and industrial production) that are interacted and are considered in this model to place limits on ultimate growth on the planet. A major issue in the debate as to the validity of the conclusions reached from this global model—whether one considers the model predictive or, as the authors propose, only indicative of behavior modes to be expected if present trends continue—has been the reliability of the data-base available at the present time. Despite such controversy over the current use of the model, the approach itself does appear to offer an important new research tool for examining the interaction of major factors at play in continuing national or global development. The further exploration of this technique to study the dynamics of natural resource utilization, as has already been initiated, merits careful attention in order to improve man’s understanding of the changing characteristics of materials flows.
THE MATERIALS CYCLE AND THE ROLE OF MATERIALS SCIENCE AND ENGINEERING
All materials move in a “total materials cycle” (Frontispiece) which in this report we will simply call the “materials cycle.” From the earth and its atmosphere, man takes ores, hydrocarbons, wood, oxygen, and other substances in crude form and extracts, refines, purifies, and converts them into simple metals, chemicals, and other basic raw materials. He modifies these raw materials to alloys, ceramics, electronic materials, polymers, composites, and other compositions to meet performance requirements; from the modified materials he makes shapes or parts for assembly into products. The product, when its useful life is ended, returns to the earth or the atmosphere as waste. Or it may be dismantled to recover basic materials that reenter the cycle.
The materials cycle is a global system whose operation includes strong three-way interactions among materials, the environment, and energy supply and demand. The condition of the environment depends in large degree on how carefully man moves materials through the cycle, at each stage of which impacts occur. Materials traversing the cycle may represent an investment of energy in the sense that the energy expended to extract a metal from ore, for example, need not be expended again if the metal is recycled. Thus, a pound of usable iron can be recovered from scrap at about 20% of the “energy cost” of extracting a pound or iron from ore. For copper the figure is about 5%, for magnesium about 1.5%.
Materials scientists and engineers work most commonly in that part of the materials cycle which extends from raw materials through dismantling
and recycling of basic materials. Events in this (or any other) area typically will have repercussions elsewhere in the cycle or system. Research and development, therefore, can open new and sometimes surprising paths around the cycle with concomitant effects on energy and the environment. The development of a magnetically-levitated transportation system could increase considerably the demand for the metals that might be used in the necessary superconducting or magnetic alloys. Widespread use of nuclear power could alter sharply the consumption patterns of fossil fuels and the related pressures on transportation systems.
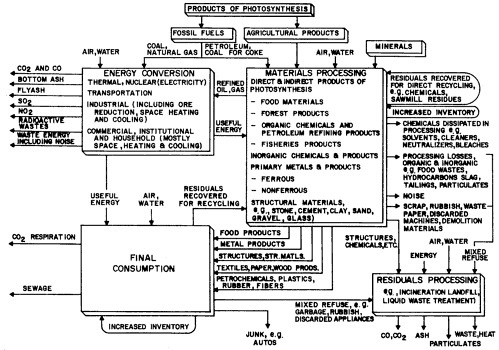
The materials cycle can be perturbed in addition by external factors such as legislation. The Clean Air Act of 1970, for example, created a strong new demand for platinum for use in automotive exhaust-cleanup catalysts. The demand may be temporary, since catalysis has been questioned as the best long-term solution to the problem, but whatever platinum is required will have to be imported, in large measure, in the face of a serious trade deficit. Environmental legislation also will require extensive recovery of sulfur from fuels and from smelter and stack gases; by the end of the century, the tonnage recovered annually could be twice the domestic demand. Such repercussions leave little doubt of the need to approach the materials cycle systematically and with caution. Some of the general characteristics of materials flows and interactions that would have to be taken into account in a model of the materials cycle are indicated in Figure 2.3 which was developed as a qualitative concept by Ayres and Kneese for dealing with the problem of residuals and recycling in relation to environmental quality.
It is readily apparent from an examination of Figure 2.3 that the currently limited knowledge concerning the materials flows operating on a world scale make it impractical to apply any comprehensive quantitative model except extremely crudely. However, on the scale of a single country, especially one such as the United States for which rather extensive statistical records of commodity flows are maintained, there is a greater likelihood that a satisfactory quantitative model for the overall materials cycle might be developed. The delineation of the critical information needed as inputs to provide a working quantitative description of the materials fluxes would be helpful not only for improving the model for highly industrialized countries, but also for indicating the minimum information needed from developing countries in order to develop more global models.
A quantitative model of the flux (rate of flow expressed in terms of mass per unit of time) of materials in the United States should be capable of giving valuable information for:
-
assessing the importance of materials in the national economy and their changes with time;
-
assessing the consequences of changes in the availability or demand for specific resources in the future;
-
examining the impact of changes in the materials flow in various sectors resulting from substitution of specific materials (whether for competitive, international, or environmental reasons) on the demand for materials in other sectors; and
-
estimating the changes in type and quantity of residuals that may result from changes in the materials used for given applications or from changes in the technology adopted for preparing and processing the materials.
INNOVATION IN THE MATERIALS FIELD
The Materials Revolution
Man historically has employed materials more or less readily available from nature. For centuries he has converted many of them, first by accident and then empirically, to papyrus, glasses, alloys, and other functional states. But in the few decades since about 1900, he has learned increasingly to create radically new materials. Progress in organic polymers for plastics and rubbers, in semiconductors for electronics devices, in strong, lightweight alloys for structural use has bred entire industries and accelerated the growth of others. Engineers and designers have grown steadily more confident that new materials somehow can be developed, or old ones modified, to meet unusual requirements. Such expectations in the main have been justified, but there are important exceptions. It is by no means certain, for example, that materials can be devised to withstand the intense heat and radiation that would be involved in a power plant based on the thermonuclear fusion, although the fusion reaction itself is not primarily a materials problem.
This expanding ability to create radically new materials stems largely from the explosive growth that has occurred during this century in our scientific understanding of matter. Advances in knowledge also have contributed much to the unifying ideas of materials science and engineering—wave mechanics, phase transitions, structure/property relationships, dislocation theory, and other concepts that apply to many classes of traditionally “different” materials. Certain semiconductor materials are perhaps the archetypal example of the conversion of fundamental knowledge to materials that meet exacting specifications. Our basic understanding of most materials, however, falls short of the level required to design for new uses and environments without considerable experimental effort. Hence, it is important to keep adding to the store of fundamental knowledge through research, although much empirical optimization will probably always be needed to deal with the complex substances of commerce.
An example of the latter is graphite which recently has solved important problems in missiles for rocket nozzles and as structural components in nuclear—power reactors. Yet, the necessary development was achieved by an enlightened empirical approach in a company which was very much material-source oriented. Graphite is a most complex material whose physical properties depend on the nature and processing of raw materials, on the quality of the initial carbon-containing material, on binder pyrolysis, and on a variety of processing variables. The most practical approach to development of a special graphite to withstand high temperature and pressure was a systematic study, therefore, of the dependence of properties on processing parameters. The starting point was an initial observation that hot pressing of normal-density carbon yields a body of high density and high strength. Science was able to provide only a very general framework for the planning
and execution of this program. This case history also illustrates a governing feature of the traditional approach to materials development. Without a complete science framework and lacking even a few broad unifying concepts, the practitioner in graphite development necessarily needed to know a very large collection of facts based on past experience in graphite. For that reason, he was material-source oriented and tended to be more affiliated with the material-supplier than with the material-consumer.
In recent decades, however, the interest in materials properties has been broadening from that of the supplier to include that of the consumer. In some programs, such as aerospace and solid-state electronics, the material user has not been able to meet all his objectives with presently existing materials. This, in turn, has often caused the user to become involved in the discovery and development of completely new materials. It has also resulted in a closer working relationship between the material developer and the material user. Further, the programs which have run into materials limitations of the kind that determine success or failure tend, in general, to be those which are straining for the utmost out of sophisticated science and technology throughout the program.
The Systems Approach
Thorough systems analysis has been used to a moderate extent in materials science and engineering, but it must become basic to the field in view of the complexity of modern materials problems and of the fact that the materials cycle itself is a vast system. The need for the systems approach is apparent in the ramifications of replacing copper wire with aluminum in many communications used where the substitution would not have worked well until a few years ago. The move was triggered by changing relative prices and supply conditions of the metals. A research and development program produced aluminum alloys with the optimum combination of mechanical and electrical properties. The aluminum wire still had to be somewhat larger in diameter than copper wire, however. Thus, wire-drawing machines had to be redesigned, in part to avoid residual strain in the aluminum wire. Thicker wire, in addition, requires larger conduits, which take more space. And new joining techniques were necessary to avoid corrosion mechanisms peculiar to the aluminum wire.
Products like nuclear reactors, jet engines, and integrated circuits are systems of highly interdependent materials, each carefully adapted to its role in the total structure. The reaction of such a system to a breakdown at one point is evident in the intended use of a promising graphite-epoxy composite for the compressor blades of a British engine for an American jet airliner. The material was not developed on schedule, to the required degree of service reliability. The repercussions reached well beyond the resulting redesign of the engine. The respective governments were compelled to extricate both companies involved from financial crises, in an atmosphere of sharp debate over domestic and foreign policy.
Science-Intensive and Experience-Based Technologies
Science-intensive technology is used to designate those activities in which specific performance is at a premium and in which the generation of new fundamental understanding of materials is necessary before the desired performance can be achieved. Hence, the descriptor, science-intensive technology or sometimes high technology, usually denotes an emerging area where knowledge and practice are changing rapidly and where a widely based fund of experience and practical knowledge has not yet accumulated.
A familiar example illustrating high technology is the space program where it is mandatory that a component should function in the desired manner at the proper time. Because the entire success of an expensive mission may depend upon the proper functioning of this component, it is natural to expend whatever research and development is required to assure success. The actual cost of the materials making up the component becomes a secondary consideration. Another example is found in nuclear-power reactors. Fuel cladding must be of sufficient integrity to guarantee against hazardous release of radioactive by-products. In the design and fabrication of the fuel cladding, substantial effort at a sophisticated scientific and engineering level is justified to achieve reliability. In the solid-state electronics industry, we have an example in which highly sophisticated and costly effort on materials is warranted in terms of the overall product value; both the processing of semiconductor material and the assembly into discrete devices or integrated circuits require a degree of control which would be incredulous in most industrial situations.
Experienced-based technology, or low technology, refers to programs which are not science intensive—in other words, which rely on more empirical approaches or which may be relatively forgiving of manufacturing processing variations. Typically, large material quantities are involved so that unit material costs are important. Examples are the manufacturing of dishes and structural steels; many tires are assembled in traditional ways involving much hand work; long-standing approaches prevail in the construction of roads and highways where unit cost is of great importance; and the paper industry continues to use empirically-derived processes.
Pace of Innovation
There is a familiar pattern in the growth, development, and diffusion of a technology. At the birth and in the early stages of a technology, such as solid-state electronics or nuclear-power reactors, the pace of invention is high and the innovating company or nation may well achieve a commanding position in the market for its new technology. In this pre-marketing stage, cost is of secondary importance, or rather, is an administrative decision related to some perception of the eventual pay-off. Later, the inventive pace begins to slacken while, at the same time, other companies or nations with necessary educational level and technical competence are acquiring the knowledge and skills so that they may catch up. The formerly-commanding position of the original innovator is gradually eroded as the relevant technological capability diffuses nationally and internationally. In this
stage, where the technology is termed as becoming mature, commercial advantage is kept by, or passes to, that company or nation which can most effectively minimize production and marketing costs while safeguarding the integrity of the product. Process innovation can then assume more importance than further product innovation.
The early stage of a technology, when the inventive pace is high, is often science-intensive. It seems that the high technologies in which the U.S. has been in the forefront, e.g. aerospace, computers, and nuclear reactors, have also been generally associated with international trade surpluses for the U.S. In the more mature stages, the science content of further developments in the technology is usually lessened, and the technology can be referred to as experience-intensive. Such technologies are more readily assimilated than high technologies by developing countries and are more likely to be associated with trade deficits for the U.S. inasmuch as the developing countries tend to enjoy lower costs, primarily through lower labor rates. When a technology reaches this phase, the U.S. runs the risk of becoming quite dependent for further developments in that technology on foreign enterprise. This may be acceptable for some technologies but not for others critical to national economic and military security. The primary metals industries are prime examples of such experience-based technologies facing severe foreign competition. Other industries in which technological leadership may have been lost by the U.S. are tires, and various consumer goods such as shoes and bicycles. Still other technologies, some of which are regarded as high technologies, are moving in the same direction, e.g., automobiles, consumer electronics, and certain aircraft products.
The implications for materials technology in the U.S. in order to meet foreign competition and maintain viable domestic industries are that high inventive pace must be created or maintained in certain fields so as to generate new high technologies and safeguard existing ones, and that the technological level must be raised and production costs lowered in selected, critical, mature industries. This must be done within the structure of U.S. industry which can be roughly classified, for our purposes, into the materials-producing and the materials-consuming industries. The former tend to be in the low-technology category, and the latter in the high-technology category. The high-technology industries, if their commercial bases are sufficiently large, are more accustomed to maintaining a balanced, but product-oriented, R and D effort than are the low-technology industries.
Disciplinary to Interdisciplinary
In the materials field, university departments have typically evolved along disciplinary lines—physics, chemistry, metallurgy, ceramics, polymers, with each discipline tending to specialize (as its name often indicates) in a particular class of materials or in a special approach to materials. Similar segmentation is apparent in the industrial sphere, with some industries specializing in metals, others in ceramics, in glass, in chemicals, or in crystalline materials for electronics. In addition, there has tended to be some separation in another direction, between materials science on the one hand, embracing the traditional scientific disciplines, and materials
engineering on the other, embracing those parts of the engineering disciplines concerned with the processing and application of materials.
Such segregation is feasible only when the technical objectives, scientific or engineering, are relatively straightforward. For example, metallurgists may have all the requisite knowledge, both of the engineering requirements as well as the scientific and materials aspects, to cope with the problem of developing improved alloys for use as electrical conductors. In such a case, the customary, disciplinary approach can be quite adequate for pursuing a problem from the research phase to the production phase. But nowadays the trend in technology is towards ever more complex performance requirements, product and device designs, and dependence on more sophisticated knowledge of the physical phenomena that can be produced in an increasing diversity of materials. The areas of knowledge required to develop, say, an integrated circuit or a biomedical material are not at all coincident with the traditional disciplinary boundaries. It is obvious that many complex technologies call for knowledge and skills that cut across several disciplines, including science and engineering. Thus, we see an increasing need for interdisciplinary approaches in order to achieve technical objectives.
But the interdisciplinary approach is by no means limited to applied research and development programs. The same is happening in basic research in materials. The very core of materials science, the relation of properties to structure and composition, implies a need for the combined efforts of physicists, metallurgists, chemists, etc. In the past, the physicist has too often made unrealistic assumptions about the composition, purity, and quality of his research materials; the metallurgist has too often not understood sufficiently how the physical phenomena exhibited by a solid relate to its structure and composition.
Materials research provides a natural meeting-ground for professionals from the various scientific and engineering disciplines, from basic research to applied research, development and engineering. Clearly, the pressure for such interdisciplinary collaboration can only grow in the future.
MATERIALS IN A CHANGING CONTEXT
Materials and the associated science and engineering exist in a social and economic context that has changed markedly during the past decade. A pertinent indicator is the National Colloquy on Materials Science and Engineering held in April 1969: the proceedings9 took virtually no notice of the field’s close ties to the environment, an omission that could hardly occur today. Materials are involved also in other kinds of change: the energy crisis, the nation’s problems with the balance of trade, federal efforts to stimulate and to assess technology; changing patterns in spending on basic and applied research and between civilian-oriented and defense- or space-oriented research and development; and the growing federal awareness of the importance of materials.
Two fundamental parameters in these matters are population growth and higher incomes. Between 1900 and 1970, the population of the U.S. rose 270%, to just under 205 million. For the year 2000 the Bureau of the Census projects a minimum population of 251 million and a maximum of 300 million. Percapita Gross National Product in constant 1958 dollars, meanwhile, has risen steadily, from $1351 in 1909 to $3572 in 1971. Both population and percapita GNP are expected to continue to grow, making ever more urgent the solution of materials-related problems.
Changing National Priorities
The materials system was shaped during World War II by diverse groups of commodity-oriented industries, educational disciplines, and technical societies, in response to the defense requirements for materials-limited hardware. This system was sharpened in the postwar era. It took the form of industrial faith in the profitability of materials research and development, an anticipated shortage of professionals in the materials field, and the materials needs of national programs for nuclear, aerospace, and defense hardware. During this period, commercial jet-powered air transportation, nuclear-power plants, space trips to the moon, and military operations in Korea and Viet Nam placed further emphasis on materials requirements.
Newly emerging national goals related to social needs, the state of the economy, and a de-emphasis of space, nuclear, and defense priorities led to a retrenchment in industrial research and development, a surplus of technical manpower in certain sectors, and the authorization of government-financed programs on housing, health and safety, energy, environmental control, transportation, recreation, and urban renewal.
Industries which were once commodity-oriented then diversified into market-oriented or integrated conglomerates; uncertainties arose as to whether or not materials science and engineering might be a technology or an educational discipline; governmental agencies became interested in technologies which were limited more by economics than by materials; and technical societies sought to re-group in response to the needs of interdisciplinary fields such as construction, pollution control, health and safety, etc. Since materials were available for hardware related to these requirements (except electronics), attention was focussed on the costs of housing, pollution control, health and safety, etc.—with emphasis on the processing of materials into the necessary hardware and its performance.
Operational research evaluating the costs of goods and services in comparison with their values as judged by the beneficiary led to reductions in industrial research in certain corporations concerned with steel, polymers, automobiles, electronics, exotic materials for aerospace, and also in free inquiry with expected but undefined rewards. The government began to focus on science and technology oriented toward national leadership in world economic competition and toward societal problems in education, energy, health, transportation, housing, and pollution abatement. The federal role stressed the need for additional mission-oriented industrial RD & E, and federal participation tended to be limited to projects of large national impact where the required resources were too large or too risky for
corporate undertaking. This participation might take the form of direct support of joint ventures, or incentives resulting from changes in taxation and regulatory restraints.
Federal, state, and local support for education is also undergoing careful scrutiny under a new set of value-judgments and an apparent lack of professionals who are knowledgeable in emerging civilian technologies. The role of technical societies as communication media for professionals vis-a-vis their effectiveness in these societal technologies is likewise being reexamined.
Materials Resources
Society is concerned with the cost, performance, and functional value of the end-product, and is only incidentally conscious of the materials being used. Walter R.Hibbard, past director of the U.S. Bureau of Mines, has said that most Americans “have no appreciation of the scientific and engineering accomplishments that have enabled them to keep receiving these benefits over the years at relatively constant costs”10.
Because of future prospects regarding decreasing supplies of traditional materials and the increasing promise of newer materials such as aluminum, plastics, semiconductors and nuclear fuels, it is more important than ever that people become familiar with the potential role of the science and engineering of materials. This evolving approach to materials, eventually affecting almost all of the goods and services with which we are familiar, will inevitably have a great influence on this nation’s economic, aesthetic, and social well-being.
Striking changes are well under way in the balance between materials needs and world trade. Qualified sources report that the United States has “rapidly deteriorating, and by now very large,” deficits in trade with minerals and raw materials, and with manufactured materials such as steel, textiles, and nonferrous metals11. But exports of finished products, which could help to offset these deficiencies, also are in a deteriorating position.
We are faced with the same question whether we are concerned with the depletion of the world-wide reserves or the deficiency of natural materials in the U.S. How can technology use our more available materials and less of scarce materials, to make improved products economically, and in quantities to keep pace with growing demand?
By 1980, our national need of materials is expected to be 40% greater than it is today, and today we require a greater supply of materials than at any previous time in our history. The U.S. already depends on foreign
supplies for most of its tungsten, chromium, manganese, platinum, mica, bauxite, cobalt, nickel, asbestos, and about a dozen other mineral commodities. Also, current engineering applications of zinc, nickel, copper, cobalt, lead, tin, and the precious metals are feared to be rapidly depleting these resources.
William J.Harris, Jr., a past executive director of the Materials Advisory Board, calls attention to the countervailing trend, however, that during the last three decades “there have been more significant advances in a wider range of materials than in any comparable period in the history of the world.”12
As an instance of how new technology has generally enabled industry to keep pace with growing demand, Hibbard13 gives the example that “output from our mines has risen almost as steadily as the mineral values in the extracted ores have diminished.” In particular, at the turn of the century, typical ore grades from copper mines were about 5% copper. The average grade of copper deposits mined today in the U.S. is less than 1% copper—about 14 pounds per ton. And new technology may make it practical to mine down to 4 pounds per ton. Although our copper grades have decreased, technology still allows us to produce copper at a reasonable price.
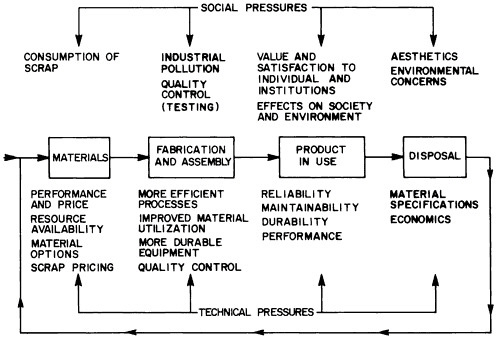
While improved extraction technology may ease our dependence on foreign sources of raw materials, improved technology in the other stages of the materials cycle will also greatly enhance our materials utilization. Figure 2.4 illustrates some of the social and technical pressures important at various stages of the economic utilization of materials. Clearly, a strong materials technology is required for industry to be responsive to these pressures in the production of goods at reasonable costs.
Besides the direct application of materials science and engineering to technology, innovation in the field can have important consequences for materials demand and consumption patterns, the consumption of energy, and the quality of the environment. Materials science and engineering can play a vital role in meeting man’s needs for better transportation equipment, prosthetic devices, and new energy generation, transmission and storage methods. By wreaking these technological changes, it can often change drastically the consumption patterns for materials and energy. New materials made from more abundant raw materials can often be developed as substitutes for old ones made from scarcer or ecologically less desirable raw materials; new ways can often be found for performing needed technological functions, e.g. transistors have replaced vacuum-tube triodes as basic amplifying elements in electronic circuits,and integrated circuits have replaced boxes of complex electronic equipment assembled from discrete components. Looking ahead with another example, present work in certain forms of levitated ground transport, if successful, could lead to greatly increased demands for new magnetic or superconducting alloys. Or again, development of suitable catalysts based on relatively abundant materials could significantly reduce the demand for platinum catalysts in treating automobile exhaust gases.
Energy, Environment
Materials, energy, and the environment are closely interrelated. The emergence of energy as a national problem of the first rank was reflected in mid-1973 in the President’s establishment of a White House Energy Policy Office and his call for drastically increased federal spending on energy R & D. At the same time the President asked Congress to authorize a Cabinet-level Department of Energy and Natural Resources and the splitting of the Atomic Energy Commission into an Energy Research and Development Administration and a Nuclear Energy Commission. The energy problem also is reflected in the formation of the Electric Power Research Institute (EPRI) by public and private utilities that account for about 80% of the nation’s generating capacity. This Institute will supervise research and development for the electric utility industry and plans to spend some $100 million in 1974, its first year of full operation. EPRI will be funded by self-assessment of member companies and will also seek to work with the federal government and equipment manufacturers.
Materials science and engineering has much to contribute in virtually all phases of the energy field; making new forms of generation possible, e.g. by finding solutions to the problem of material swelling under radiation damage in nuclear reactors; enabling new systems of electrical power distribution, e.g. through superconducting or cryogenic transmission lines; finding more efficient ways to store energy, e.g. through solid-electrolytic batteries or fuel cells; and developing more effective ways of using and conserving energy, e.g. through optimized materials processing and manufacturing operations.
National concern for the environment has been recognized in the past few years by extensive federal legislation as well as by the creation of the Environmental Protection Agency and the Council on Environmental Quality. Environmental matters also achieved international status with the Stockholm Conference on the Human Environment, held in mid-1972 under the aegis of the United Nations General Assembly. This concern was formalized in December 1972 when the General Assembly established a new unit, the U.N. Environmental Programme.
In the field of environmental quality, materials science and engineering has much to offer in the development of cleaner materials processes, effective uses for waste materials, materials and designs more adaptable to recycling, and in instrumentation to monitor and control pollution.
The U.S. Trade Balance
Materials are important factors in this country’s balance of trade. The National Commission on Materials Policy has stated that, in 1972, the U.S. imported $14 billion worth of minerals (including petroleum) and exported $8 billion worth, for a net deficit of $6 billion. If the trends of the past 20 years persist according to the Commission, the deficit could top $100 billion annually by the year 2000. In 1970, the U.S. imported all of its primary supplies of chromite, columbium, mica, rutile, tantalum, and tin; more than 90% of its aluminum, antimony, cobalt, manganese, and platinum;
more than half of its asbestos, beryl, cadmium, fluorspar, nickel, and zinc; and more than a third of its iron ore, lead, and mercury. Certain science-intensive materials, on the other hand, including organic chemicals and plastics and resins, have produced, consistently, a positive balance of trade (Table 2.5).
The country’s balance of trade has suffered from growing imports of manufactured products. This has happened particularly with low-technology (experience-intensive) goods and, to a lesser extent, with high-technology (science-intensive) goods (even allowing for a degree of controversy over which is which). It appears, in fact, that the U.S. has lost its technological leadership in some product areas, although cause-and-effect relationships among research and development budgets, technological initiative, and foreign trade are difficult to establish clearly (and lie, in any case, beyond the purpose of COSMAT).
The federal government has initiated modest efforts to stimulate civilian research, development, and innovation, so as to help recover technological initiative (which may have been lost, for example, in steel and titanium). The goal is to make U.S. products more competitive at home and abroad, and much of the emphasis will be on manufacturing technology, including materials shaping, forming, assembly, and finishing. The federal efforts include the Experimental Technology Incentives Program of the National Bureau of Standards in the Department of Commerce and the Experimental R&D Incentives Program of the National Science Foundation.
Technology Assessment
Technology assessment has long been practiced, in varying degree, in both industry and government, but a formal federal apparatus was established only recently, by the Technology Assessment Act of 1972. The Office of Technology Assessment and other mechanisms created by the Act are designed to give the Congress a stronger in-house grasp of the relative merits and side effects of alternative technologies. The Act did not establish a formal technology assessment function in the Executive Branch. The birth of the Office of Technology Assessment appears nevertheless to be stimulating similar efforts in parts of the Executive Branch.
The increasing diversity and complexity of technological products and the materials, often unfamiliar, from which they are made have posed increasingly severe burdens on the average consumer. As a result, consumers have become more concerned with the reliability, durability, safety, flammability, and toxicity of products. These pressures, in turn, translate into new challenges to materials science and engineering, introducing additional performance specifications alongside the more traditional ones.
The Federal Approach to Materials
The federal government has not yet developed a comprehensive national policy on materials. Materials-related responsibilities are diffused among a variety of formal and ad hoc committees and advisory groups, such as the
TABLE 2.5 U.S. Trade Balances in Illustrative Product Categories
|
|
1960 |
1965 |
1970 |
|
Aircraft and Parts |
$1187 |
$1226 |
$2771 |
|
Electronic Computers and Parts |
44 |
219 |
1044 |
|
Organic Chemicals |
228 |
509 |
715 |
|
Plastic Materials and Resins |
304 |
384 |
530 |
|
Scientific Instruments and Parts |
109 |
245 |
407 |
|
Air Conditioning and Refrigeration Equipment |
135 |
207 |
374 |
|
Medical and Pharmaceutical Products |
191 |
198 |
333 |
|
Rubber Manufacture |
108 |
119 |
–28 |
|
Textile Machinery |
104 |
54 |
–37 |
|
Copper Metal |
–62 |
–132 |
–171 |
|
Phonographs and Sound Reproduction |
15 |
–36 |
–301 |
|
Paper and Paper Products |
–501 |
–481 |
–464 |
|
Footwear |
–138 |
–151 |
–619 |
|
TV’s and Radios |
–66 |
–163 |
–717 |
|
Iron and Steel |
163 |
–605 |
–762 |
|
Petroleum Products |
–120 |
–464 |
–852 |
|
Textiles and Apparel |
–392 |
–757 |
–1542 |
|
Automotive Products |
642 |
972 |
–2039 |
|
Source: U.S. Department of Commerce |
|||
Interagency Council for Materials. The Government is assisted also by groups like the National Materials Advisory Board and the Committee on Solid State Sciences in the National Research Council. The gradual emergence of a more coherent federal approach to materials questions, however, would appear to be implicit in certain developments of the past few years.
The Resource Recovery Act of 1970 created a National Commission on Materials Policy, whose charge was “to enhance environmental quality and conserve materials by developing a national materials policy to utilize present resources and technology more efficiently, to anticipate the future materials requirements of the nation and the world, and to make recommendations on the supply, use, recovery, and disposal of materials.” The Commission reported to the President and to the Congress in June 1973.
The Mining and Minerals Policy Act of 1970 requires the Department of the Interior to make annual reports and recommendations for action in relation to a national minerals policy. The Second Annual Report under this Act was published in June 1973.
The creation of a Materials Research Division in the National Science Foundation brought into clearer focus the existence of a multidisciplinary materials-research community.
Recent years have also seen considerable interest in the idea that the earth’s finite content of resources for industrial materials (including fuels) restricts severely the industrial growth that traditionally has been considered the basis of economic and societal health14. This concept of “limits to growth,” and the related idea of a “steady-state society,” are not within the scope of this study. They are, however, further indications of the changing context in which materials science and engineering exists and in which, we believe, the field has vital contributions to make.
NATIONAL AND INSTITUTIONAL CAPABILITY
Materials activities are clearly sizable in this country, where 6 percent of the world’s population accounts for somewhere between a quarter and a half of the world’s annual consumption of natural resources. The U.S. is very strong in materials science and engineering, but certain weaknesses, if unattended to, could progressively erode the nation’s capability to meet the materials needs of its people. These weaknesses are due in part to the diffusion of responsibility for materials plans and programs at the federal level. To a considerable degree, the same diffusion of responsibility is found in the universities, in both education and research. Contributing also to weaknesses in materials are shortcomings in the generation and application of basic knowledge.
National capability in materials science and engineering relies on the trained manpower and basic knowledge produced by the universities and on the application of basic knowledge by industry and other mission-oriented institutions. An organization is better able to assess and exploit new knowledge
generated elsewhere when it is able itself to generate new knowledge. Thus, knowledge moves more readily from the universities to industry when companies do an appropriate amount of well-chosen basic research. It moves more efficiently also when universities conduct an appropriate amount of applied research. Current difficulties on both scores are pointed out later in this chapter under Universities and Industrial Research and Development.
The importance of materials suggests that materials science and engineering should be a prolific producer of knowledge. That this is so is indicated by the literature as abstracted in Chemical Abstracts. In 1970, 276,674 papers and patents were abstracted, of which 45 percent were in materials science and engineering. Over the past two decades, the world-wide literature in materials science and engineering has maintained an annual growth rate of 9 percent, whereas the annual growth rate for Chemical Abstracts as a whole has dropped from 8.8 percent in 1950–60 to 6.7 percent in 1960–70. Materials literature originating in the U.S. has been growing in recent years at 11 percent annually as compared with 13 percent for the U.S.S.R. The latter country overtook the U.S. in materials publications as far back as 1957. The U.S. produced about 25 percent of the materials papers in 1970; the U.S.S.R. 33 percent; and Japan 5.8 percent. In the U.S., educational institutions were the chief source (50%) of the materials literature, followed by industry (25%),and government (15%). The U.S. Accounted for 40 percent of the patents in 1970, and Japan 12.9 percent.
Manpower
Existing data on scientific and engineering manpower generally are not categorized along the multidisciplinary lines of materials science and engineering. We have used a list of specialties characterizing the field, therefore, to extract manpower data from prime sources. On this basis, it appears that materials science and engineering involves some 500,000 of the 1.8 million scientists and engineers in the U.S. We estimate (Table 2.6) that there is a full-time equivalent of 315,000 scientists and engineers in the field, including about 115,000 full-time practitioners. Within the latter group are approximately 50,000 professionals holding materials-designated degrees. Engineers, even without counting the materials-designated professionals, constitute the largest manpower group in materials science and engineering; they number 400,000 individuals, and correspond to a full-time equivalent of some 200,000. The situation with respect to women and minority groups in the materials field appears to be no different from that in science and engineering generally.
The current state of manpower data for materials science and engineering, and our knowledge of the relevant patterns of manpower flow, are such that nothing exceptional can be said of the field in comparison with the traditional disciplines, provided that external factors remain essentially unchanged. However, as the role of materials science and engineering in meeting societal needs becomes more widely understood, particularly in connection with energy and environmental problems, it is quite likely that there will be an increasing demand for scientists and engineers in the materials field.
TABLE 2.6 Estimates of Manpower in Principal Disciplinary Sectors of Materials Science and Engineering
|
|
Full-Time Equivalent |
||
|
Discipline |
Total Manpower |
MSE Manpower |
|
|
|
Total |
Doctorates |
|
|
Chemists |
150,000 |
50,000 (16%) |
19,000 (51%) |
|
Physicists |
45,000 |
15,000 (5%) |
8,000 (22%) |
|
Metallurgists |
40,000 |
40,000 (13%) |
5,000 (13%) |
|
Ceramists |
10,000 |
10,000 (3%) |
1,000 (3%) |
|
Other Engineers |
1,200,000 |
200,000b (63%) |
4,000 (11%) |
|
|
1,445,000a |
315,000 (100%) |
37,000 (100%) |
|
Note: A detailed profile of scientists and engineers in the field of materials is presented in Appendix 2A of this chapter (pp. 2–58 to 2–93). a The total number of scientists and engineers in the U.S. is about 1.8 million b Approximately 400,000 engineers are involved significantly in materials science and engineering. We estimate, conservatively, that they divide their efforts equally between materials and other engineering activities and thus are equivalent to 200,000 engineers working full time in materials. |
|||
It should be emphasized that the boundaries of materials science and engineering are blurred and continually evolving. The central disciplines and subdisciplines include solid-state physics and chemistry, polymer physics and chemistry, metallurgy, ceramics, and portions of many engineering disciplines. In a broad sense, the field also includes segments of mechanics; of organic, physical, analytical, and inorganic chemistry; and of chemical, mechanical, electrical, electronic, civil, environmental, aeronautical, nuclear, and industrial engineering (Table 2.7).
Trends in Basic and Applied Research
The relative economic austerity of the past few years has been felt in basic and applied research in both industry and government. Nonfederal spending on research and development has virtually leveled off (in constant dollars), while federal spending has been declining (Figure 2.5). In current dollars, total federal spending on research and development has been rising slowly since 1970, but the emphasis has been shifting away from defense and space toward civilian-oriented areas (Figure 2.6). Expenditures on space have been falling, while spending on domestic programs has been rising slightly faster than on defense research and development (although starting from a much smaller base). In constant dollars, federal spending on both basic and applied research leveled off in the late 1960’s; more recently, spending on basic research has declined slightly, while that on applied research has risen slightly (Figure 2.7).
Government Support of Materials Science and Engineering
Materials science and engineering has been shaped in a major way during the past two decades by federal research and development programs that evolved in response to national needs and goals. Direct federal funding of materials R&D (which amounted to 1.7 percent of the total federal R&D budget) totaled some $260 million* in fiscal 1971, according to the Interagency Council for Materials; in constant dollars this figure is about equivalent to the $185 million spent in fiscal 1962 (Figure 2.8). (Indirect federal funding of materials R&D through hardware contracts is conservatively estimated to equal direct funding, giving a total of some $0.5 billion in federal materials R&D in 1971. A breakdown of how the federal funding of materials R&D has changed from 1967 to 1971 is given in Tables 2.8 to 2.12.
More detailed data on how the federal support of materials R&D by Agency, Type of Research, and Performer are given in Table 2.13, and by Agency and Class of Materials in Table 2.14. Only one agency, the National Science Foundation, has an identified mandate to support science and technology
TABLE 2.7 Distribution of Materials Scientists and Engineers by Category of Activity
|
Category |
% of Professionals in Category Who Are in MSE |
% of Total MSEa |
|
|
FROM THE SCIENCE REGISTER |
|
||
|
Polymer and Organic Chemistry |
51 |
6.7 |
|
|
Physical Chemistry |
76 |
3.4 |
|
|
Analytical Chemistry |
60 |
2.6 |
|
|
Solid-State Physics |
93 |
2.0 |
|
|
Inorganic Chemistry |
85 |
1.8 |
|
|
Other Physics |
17 |
1.6 |
|
|
Other Chemistry |
15 |
1.5 |
|
|
Atomic and Molecular Physics |
96 |
0.7 |
|
|
Optics |
38 |
0.5 |
|
|
Earth Sciences |
2 |
0.2 |
|
|
|
21% |
||
|
FROM THE ENGINEERS REGISTER |
|
||
|
Structural Engineering |
42 |
12.6 |
|
|
Metallurgical Engineering |
100 |
11.0 |
|
|
Electromagnetic Engineering |
42 |
10.2 |
|
|
Chemical Engineering |
92 |
9.5 |
|
|
Work Management and Evaluation |
18 |
8.8 |
|
|
Dynamics and Mechanics |
40 |
7.7 |
|
|
Engineering Processes |
60 |
5.4 |
|
|
Heat, Light, and Applied Physics |
75 |
5.4 |
|
|
Automation & Control Instrumentation |
45 |
4.7 |
|
|
Ceramic Engineering |
100 |
1.9 |
|
|
Information and Mathematics |
20 |
1.8 |
|
|
Other Engineering |
30 |
0.1 |
|
|
|
79% |
||
|
|
100% |
||
|
a The distributions between the science and engineering portions of this listing have been adjusted to 21% and 79% respectively, in accordance with the physics plus chemistry percentages shown in Table 2.6. Source: 1968 National Register of Scientific and Technical Personnel (National Science Foundation) and 1969 National Engineers Register (Engineering Manpower Commission) . |
|||
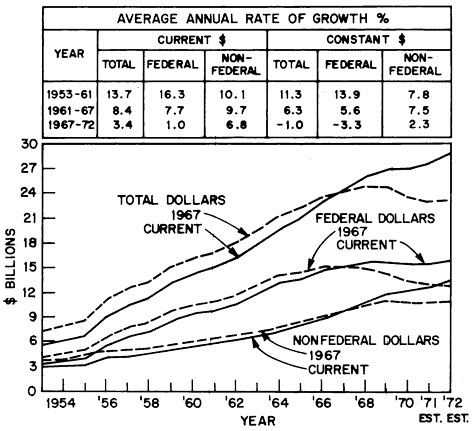
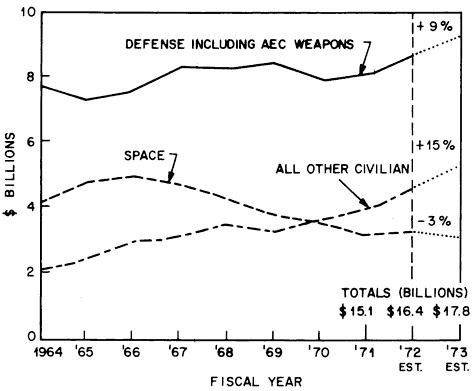
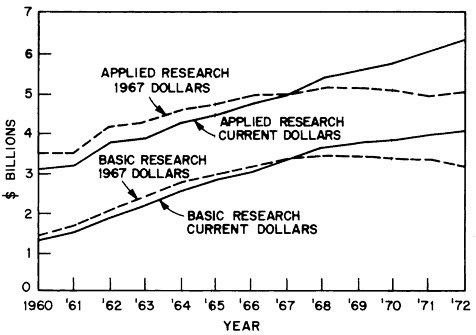
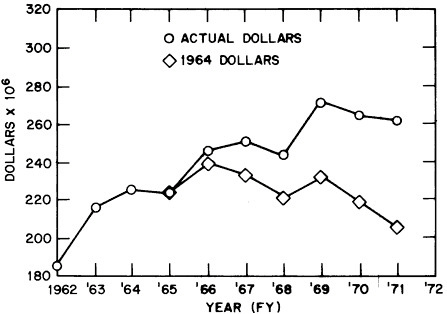
TABLE 2.8 Distribution of Federal Materials R&D Effort by Class of Materials
|
|
Percentage Effort |
|
|
Material |
1967 |
1971 |
|
Metallic |
39.3 |
37.5 |
|
Inorganic nonmetallic |
23.6 |
23.8 |
|
Organic |
20.3 |
20.6 |
|
Composite |
8.5 |
9.9 |
|
Fuels, lubricants, fluids |
2.4 |
2.0 |
|
Other |
5.9 |
6.1 |
|
|
100. |
100. |
|
|
($248.05M) |
($260.2M) |
TABLE 2.9 Distribution of Federal Materials R&D Effort by Research Activity
|
|
Percentage Effort |
|
|
Activity |
1967 |
1971 |
|
Basic Research |
41.0 |
37.5 ($ 97.6M) |
|
Applied Research |
54.7 |
53.8 ($140.0M) |
|
Experimental Development |
4.3 |
8.7 ($ 22.6M) |
|
|
100. |
100. ($260.2M) |
TABLE 2.10 Distribution of Federal Materials R&D Effort by Performing Organization
|
|
Percentage Effort |
|
|
Performing Organization |
1967 |
1971 |
|
University |
22.1 |
20.0 ($ 52.15M) |
|
Industry |
19.8 |
19.2 ($ 49.85M) |
|
Government In-House |
31.0 |
35.5 ($ 92.4M) |
|
Federal Contract Research Centers |
24.1 |
22.6 ($ 58.7M) |
|
Other Non-Profit |
3.0 |
2.7 ($ 7.1M) |
|
|
100. |
100. ($260.2M) |
|
The data in Tables 2.8 to 2.11 are derived from the following two sources: a CCMRD Survey of Federal Directly Supported Materials R&D, May 1964 (for FY 1962 through FY 1964) b ICM Survey of Federal Directly Supported Materials R&D, August 1971 (for FY 1965 through FY 1971) |
||
TABLE 2.11 Distribution of Federal Materials R&D Effort by Supporting Agency
|
|
Percentage Effort |
|||||
|
Supporting Agency |
|
1965 |
|
1967 |
|
1971 |
|
AEC |
|
34.4 |
|
34.4 |
|
31.6 |
|
DOD: |
|
38.6 |
|
36.9 |
|
38.5 |
|
ARPA |
5.6 |
|
9.0 |
|
7.7 |
|
|
Air Force |
16.5 |
|
14.3 |
|
14.9 |
|
|
Army |
7.7 |
|
6.0 |
|
6.6 |
|
|
Navy |
8.8 |
|
7.6 |
|
9.3 |
|
|
NASA |
|
10.0 |
|
8.9 |
|
8.6 |
|
NSF |
|
3.4 |
|
4.1 |
|
4.1a |
|
Dept. Interior |
|
1.9 |
|
1.6 |
|
1.3 |
|
NBS |
|
3.1 |
|
3.1 |
|
4.0 |
|
Agriculture |
|
5.9 |
|
7.3 |
|
8.7 |
|
DOT |
|
2.1 |
|
1.4 |
|
1.7 |
|
HEW |
|
0.5 |
|
2.1 |
|
1.4 |
|
HUD |
|
– |
|
– |
|
– |
|
|
|
100. |
|
100. |
|
100. |
|
a Does not include transfer of IDL's from ARPA. |
||||||
TABLE 2.12 Distribution of Federal Materials R&D Effort by Agency and Material for FY 1967 and 1971
|
Supporting Agency |
Metallic |
Inorganic Non—Metals |
Organic |
|||||||||
|
|
1967 |
|
1971 |
|
1967 |
|
1971 |
|
1967 |
|
1971 |
|
|
AEC |
|
47.6 |
|
39.4 |
|
51.7 |
|
55.1 |
|
1.2 |
|
8.8 |
|
DoD: |
|
36.8 |
|
40.9 |
|
28.2 |
|
30.8 |
|
33.8 |
|
32.1 |
|
ARPA |
8.9 |
|
8.3 |
|
15.5 |
|
15.0 |
|
4.2 |
|
4.1 |
|
|
Air Force |
11.7 |
|
12.3 |
|
6.1 |
|
5.2 |
|
14.7 |
|
13.6 |
|
|
Army |
6.1 |
|
7.5 |
|
3.4 |
|
3.2 |
|
9.5 |
|
7.2 |
|
|
Navy |
10.1 |
|
12.8 |
|
3.2 |
|
7.4 |
|
5.4 |
|
7.2 |
|
|
NASA |
|
8.9 |
|
12.8 |
|
9.0 |
|
2.7 |
|
10.3 |
|
7.7 |
|
NSF |
|
1.7 |
|
2.1 |
|
–* |
|
–* |
|
0.7 |
|
1.0 |
|
Dept. Interior |
|
3.1 |
|
2.2 |
|
0.9 |
|
0.5 |
|
1.0 |
|
1.8 |
|
NBS |
|
1.3 |
|
1.9 |
|
3.3 |
|
4.0 |
|
2.7 |
|
3.4 |
|
Agriculture |
|
– |
|
– |
|
– |
|
– |
|
35.7 |
|
42.4 |
|
DOT |
|
– |
|
0.2 |
|
|
– |
|
0.3 |
|||
|
HEW |
|
0.5 |
|
0.6 |
|
1.3 |
|
0.2 |
|
4.0 |
|
2.5 |
|
HUD |
|
– |
|
– |
|
– |
|
– |
|
– |
|
– |
|
|
100.0 |
|
100.0 |
|
100.0 |
|
100.0 |
|
100.0 |
|
100.0 |
|
|
TOTAL FUNDING ($ thousands) |
|
97,450 |
|
97,550 |
|
58,600 |
|
61,900 |
|
50,400 |
|
53,650 |
|
* NSF support for inorganic nonmetallic materials is contained in “solid state.” |
||||||||||||
|
Supporting Agency |
Composite |
Fuels, etc. |
Other |
|||||||||
|
|
1967 |
|
1971 |
|
1967 |
|
1971 |
|
1967 |
|
1971 |
|
|
AEC |
|
4.8 |
|
13.1 |
|
– |
|
– |
|
11.8 |
|
10.0 |
|
DoD: |
|
80.7 |
|
70.8 |
|
66.4 |
|
71.7 |
|
– |
|
– |
|
ARPA |
11.9 |
|
1.7 |
|
– |
|
– |
|
– |
|
– |
– |
|
Air Force |
56.2 |
|
54.8 |
|
16.0 |
|
8.5 |
|
2.7a |
|
1.9a |
|
|
Army |
1.4 |
|
5.8 |
|
31.9 |
|
45.3 |
|
– |
|
– |
|
|
Navy |
11.2 |
|
8.5 |
|
18.5 |
|
17.9 |
|
8.2c |
|
9.7c |
|
|
NASA |
|
5.2 |
|
10.0 |
|
33.6 |
|
28.3 |
|
– |
|
– |
|
NSF |
|
|
– |
|
– |
|
55.6a |
|
50.9a |
|||
|
Dept. Interior |
|
– |
|
– |
|
– |
|
– |
|
– |
|
|
|
NBS |
|
– |
|
– |
|
– |
|
– |
|
21.8b |
|
27.4b |
|
Agriculture |
|
– |
|
– |
|
– |
|
– |
|
– |
|
|
|
DOT |
|
– |
|
– |
|
– |
|
– |
|
– |
|
|
|
HEW |
|
9.3 |
|
6.0 |
|
– |
|
– |
|
– |
|
|
|
HUD |
|
– |
|
– |
|
– |
|
– |
|
– |
|
|
|
|
100. |
|
100. |
|
100. |
|
100. |
|
100.0 |
|
100.0 |
|
|
TOTAL FUNDING ($ thousands) |
|
21,000 |
|
25,900 |
|
5,950 |
|
5,300 |
|
14,650 |
|
15,900 |
|
a NSF and Air Force support for “materials, physics, solid state.” b NBS support for “analytical chemistry, physical chemistry, reactor radiation.” c Navy support for “energy conversion materials.” |
||||||||||||
TABLE 2.13 Direct Federal Funding of Materials Research and Development by Agency, Type of Research, and Performer. (Fiscal Year 1971; millions)
|
|
|
|
|||||||
|
Agency |
Basic Research |
Applied Research |
Experimental Development |
University |
Federal Contract Research Centers |
Other Non-profit |
Industry |
Government InHouse |
Total |
|
Agriculture |
$ 9.6 |
$ 11.8 |
$ 1.3 |
$ 0 |
$ 0 |
$ 0 |
$ 0 |
$22.6 |
$ 22.6 |
|
AEC |
39.3 |
42.9 |
0 |
18.5 |
57.7 |
2.5 |
2.6 |
0.8 |
82.2 |
|
NBS |
2.1 |
8.4 |
0 |
0 |
0 |
0 |
0 |
10.5 |
10.5 |
|
ARPA |
14.0 |
6.0 |
0 |
10.7 |
0 |
0.7 |
6.6 |
1.9 |
20.0 |
|
Army |
3.3 |
13.9 |
0 |
1.7 |
0 |
0.3 |
2.3 |
12.9 |
17.2 |
|
Navy |
10.3 |
9.7 |
4.4 |
2.6 |
0 |
1.2 |
5.1 |
15.4 |
24.4 |
|
Air Force |
3.9 |
23.4 |
11.5 |
2.5 |
0 |
0.3 |
26.6 |
9.4 |
38.8 |
|
HEW |
1.4 |
2.2 |
0 |
1.4 |
0 |
1.2 |
0.9 |
0 |
3.6 |
|
HUD |
0 |
0 |
0 |
0 |
0 |
0 |
0 |
0 |
0 |
|
Interior |
0.1 |
3.4 |
0 |
0.3 |
0 |
0 |
1.8 |
1.3 |
3.5 |
|
NASA |
4.7 |
14.7 |
3.2 |
0.8 |
0 |
0.8 |
3.9 |
17.3 |
22.6 |
|
NSF |
8.9 |
1.7 |
0 |
10.7 |
0 |
0 |
N.A. |
0 |
10.6 |
|
DOT |
0 |
2.0 |
2.2 |
3.0 |
1.0 |
0 |
0 |
0.5 |
4.2 |
|
Totalsa |
$97.6 |
$140.0 |
$22.6 |
$52.2 |
$58.7 |
$ 7.1 |
$49.9 |
$92.4 |
$260.0 |
|
|
|
|
|||||||
|
a Totals may not add exactly because of rounding in the several compilations used for these figures. Source: Interagency Council for Materials Note: Other data suggest that the $260M total shown above may be as high as $300M and the University total as high as $75M, depending on definition of terms. Some agencies, and COSMAT, consider research in solid-state physics to be materials research, for example, while others do not. |
|||||||||
TABLE 2.14 Direct Federal Funding of Materials Research and Development by Agency and Field of Materials. (Fiscal Year 1971; millions)
|
Agency |
Metallic Materials |
Organic Materials |
Inorganic Nonmetallic Materials |
Composite Materials |
Fuels, Lubes, Fluids |
Other Materials |
|
Agriculture |
$ 0 |
$22.8 |
$ 0 |
$ 0 |
$0 |
$ 0 |
|
AEC |
38.4 |
4.7 |
34.1 |
3.4 |
0 |
1.6 |
|
NBS |
1.8 |
1.9 |
2.5 |
0 |
0 |
4.3 |
|
ARPA |
8.1 |
2.2 |
9.3 |
0.5 |
0 |
0 |
|
Army |
7.3 |
3.9 |
2.0 |
1.5 |
2.4 |
0 |
|
Navy |
12.5 |
3.9 |
4.6 |
2.2 |
0.9 |
0.3 |
|
Air Force |
12.0 |
7.3 |
3.2 |
14.2 |
0.5 |
1.5b |
|
HEW |
0.6 |
1.6 |
0.1 |
1.5 |
0 |
0 |
|
HUD |
0 |
0 |
0 |
0 |
0 |
0 |
|
Interior |
2.2 |
1.0 |
0.3 |
0 |
0 |
0 |
|
NASA |
12.6 |
4.2 |
1.7 |
2.6 |
1.5 |
0 |
|
NSF |
2.1 |
0.6 |
0 |
8.1c |
||
|
DOT |
0.2 |
0.2 |
4.2 |
0 |
0 |
0 |
|
Totalsd |
$97.6 |
$53.6 |
$61.9 |
$25.9 |
$5.3 |
$15.9 |
|
Total: $260 M |
||||||
|
a Not reported under materials R&D b Materials physics, solid state c $7.6 solid state, 0.5 biomaterials d Totals may not add exactly because of rounding in the several compilations used in these figures. Source: Interagency Council for Materials Note: Other data suggest that the $260 M total shown above may be as high as $300 M, depending on the definitions of terms. Some agencies, and COSMAT, consider research in solid-state physics to be materials research, for example, while others do not. |
||||||
generally. All of the others, commanding 90 percent of the budget, support the science and technology related to their missions.
Governmental materials laboratories, which received about a third of the federal R&D funds in materials in 1971, concentrate primarily on identified, mission-oriented problems. To support this work, they do exploratory research at a level that appears to vary from laboratory to laboratory in the range of 5 to 15 percent of their total funding. Some federal laboratories have become centers of excellence in specific areas. These include the Air Force Materials Laboratory, Wright-Patterson Air Force Base, Dayton, Ohio, in composite materials; the Atomic Energy Commission’s Oak Ridge National Laboratory in radiation damage and neutron diffraction; and the National Bureau of Standards in polymeric materials.
The government also operates the National Standard Reference Data System, which is administered and coordinated by the National Bureau of Standards. This program provides critically-evaluated numerical data on the physical and chemical properties of well-characterized substances and systems. The Bureau, in addition, operates the Standard Reference Materials program, which now can provide standard samples of more than 800 materials.
Universities
Some areas of materials science and engineering, such as metallurgy and ceramics, are full-fledged academic disciplines. Areas emerging as formal degree programs include materials science, polymer science, solid-state science, and materials engineering. Despite such programs, the nature and uses of materials are so broad and pervasive as to continue to require close interaction among many disciplines
At least half of the identifiable research on materials in universities is done on the 28 campuses where materials research centers have been established in the past decade. Twelve of these schools were selected in the early 1960’s as the sites of Interdisciplinary Laboratories (IDL’s). The IDL’s were sponsored by the Advanced Research Projects Agency (ARPA) as an experiment in improving the sophistication of materials research and increasing the number of materials specialists. A notable feature of these university laboratories has been the availability of block funding for locally-selected research programs and central facilities. In July 1972, responsibility for the IDL program was assumed by the Materials Research Division of the National Science Foundation; the IDL’s were then renamed Materials Research Laboratories. In the Spring of 1973 the Foundation announced plans for two new Materials Research Laboratories, one to focus on the technology of joining, the other on polymers.
The National Aeronautics and Space Administration (NASA) set up three block-funded programs at universities in the 1960’s, but at lower levels of support than for the IDL’s. In the same period, the Atomic Energy Commission (AEC) established block-funded materials research centers at three universities, one of them already an ARPA-IDL school. Since the start of these programs by ARPA, NASA, and AEC, 11 additional universities have formed analogous materials research centers, mainly on their own initiative. They use the concept of central facilities, but are mostly without block funding.
A COSMAT study found that, typically, these materials centers ranked high in education and individual basic research, the traditional functions of the university. Most of the centers ranked low in interaction with industry and in innovative methods of operation. Some centers have done a relatively significant amount of interdisciplinary work, one measure of which is the authorship of the resulting scientific papers. In three quarters of the centers, 10 to 15 percent of the papers covered by our evaluation were written jointly by faculty from two or more departments. This contrasts with an average of 2 percent for papers from materials-designated departments.
Because of the difficulty of obtaining comparable data from different schools, this evaluation does not pretend to be fully accurate and complete. It is true, nevertheless, that universities have produced relatively little so far in the way of new materials per se. An important reason, we believe, is that the academic community traditionally has resisted interdisciplinary and applied research. We have noted already that the reward structure within the university is tilted strongly toward the disciplines; likewise, no funding agencies have clearly rewarded excellence in interdisciplinary activities at universities. All of the materials research centers indicated that they plan to shift their emphasis somewhat toward applied research. The area mentioned most often was biomaterials. This field is highly interdisciplinary and intellectually stimulating, but the corresponding body of technology is much smaller than in other areas, such as ceramics, polymers, and electronic materials.
Materials Degrees: Formal undergraduate curricula in materials appear to be confined to materials-designated degree programs, which are located almost entirely in engineering schools. Some 60 programs of this kind are accredited in the country’s 250 engineering schools. These and 30 unaccredited programs award annually somewhat more than 900 materials-designated baccalaureate degrees, or about 2 percent of the total engineering baccalaureates conferred annually. Currently, more than half of the materials-designated departments average fewer than 10 baccalaureates per year, a situation which will become increasingly difficult to justify.
About 50 institutions in the U.S. offer graduate degrees in materials. The 270 materials-designated doctorates awarded in 1971–72 amounted to about 7 percent of the total engineering doctorates conferred. In solid-state physics, which provides a major component of the professional manpower in materials science and engineering, doctorates awarded annually appear to number about 370. Annual output of materials-research doctorates awarded in chemistry and in nonmaterials-designated engineering programs is at least double the number in solid-state physics. Thus we estimate that the annual output of doctorates in the field of materials is about 1400, but there is much uncertainty in this figure because of difficulties in the “materials identification.”
Research Funding: University research in materials is supported almost entirely by federal funds at an annual level (in 1971) of about $52.2
million* (Table 2.13). This was 20 percent of the $260 million** in total, direct federal support for materials research and development in 1971 and about 3 percent of total federal support for research and development in the universities. Some 35 percent of the support for university research in materials was provided by the Atomic Energy Commission and about 20 percent each by the National Science Foundation and the Advanced Research Projects Agency in the Department of Defense. (In fiscal 1973 the Foundation estimates its materials research support at $35 million, more than triple the $10.7 million of 1971, but the major part of the increase arises from internal regrouping into the “materials research” category.) Relatively little identified support is available as yet from agencies like the Departments of Health, Education and Welfare; Housing and Urban Development; and Transportation.
Almost 60 percent of the federal support for university research in materials goes to the 12 universities where the original NSF Materials Research Laboratories are located. About 15 percent of the support goes to the 16 additional schools that have materials research centers of other kinds, On the 12 campuses where the original NSF Materials Research Laboratories are located, slightly more than 25 percent of materials-research funds are received by materials-designated departments, slightly less than 15 percent by other engineering departments, and about 60 percent by physics and chemistry departments.
A useful source of information for analyzing federal support of university research on materials is the compilation of “Federal R&D Obligations to Universities and Colleges for Fiscal Year 1970” prepared by NSF. The distribution of the total obligation of the $1.395 billion for that year is shown in Table 2.15.
There is a disparity between the figure of $17.6 M for the identified materials topic of “metallurgy and materials” in Table 2.15 and the $52.2 M reported by ICM as the federal support to universities for materials R&D (Tables 2.10 and 2.12). The difference presumably arises from a more restricted definition of materials research in the NSF tabulation; it is likely that the latter corresponds to support to departments of “metallurgy and materials,”*** whereas the ICM data included materials support through physics, chemistry and other categories. Assuming this to be the prime source of the difference, it is useful to examine the ICM figure against that of the total for physical sciences and engineering in Table 2.15, i.e. those fields where almost all materials research will be conducted (although
|
* |
The figure could be as high as $75 million, depending on definitions of terms. COSMAT and some agencies, for example, consider research in solid-state physics to be materials research, while others do not. |
|
** |
The figure could be as high as $300 million, for the reason given in the preceding footnote. |
|
*** |
The fact that the proportion of funding (12.4% for “metallurgy and materials” in Table 2.15 to that for all engineering is close to the percentage of advanced degrees awared in that field relative to all engineering supports this interpretation. |
TABLE 2.15 Distribution by Field of Science of Federal R&D Support to Universities for FY 1970
|
Field |
Amount (Dollars in Thousands) |
Percent of Total |
|
Physical Sciences: |
283,114 |
20.28 |
|
Astronomy |
32,111 |
2.3 |
|
Chemistry |
70,205 |
5.03 |
|
Physics |
176,629 |
12.65 |
|
Physical Science |
4,169 |
0.30 |
|
Mathematics: |
44,582 |
3.19 |
|
Environmental Sciences: |
106,722 |
7.65 |
|
Engineering: |
141,533 |
10.14 |
|
Aeronautical |
16,217 |
1.16 |
|
Astronautical |
18,002 |
1.29 |
|
Chemical |
8,167 |
0.59 |
|
Civil |
9,981 |
0.72 |
|
Electrical |
31,963 |
2.29 |
|
Mechanical |
11,904 |
0.85 |
|
Metallurgy and Materials |
17,603 |
1.26 |
|
Engineering |
27,696 |
1.98 |
|
Life Sciences: |
565,094 |
40.48 |
|
Psychology: |
62,298 |
4.46 |
|
Social Sciences: |
47,144 |
3.43 |
|
Other Sciences: |
144,748 |
10.37 |
|
|
$1,395,923 |
100. |
|
Courtesy Dr. Charles Falk, NSF |
||
some may also be done under “environmental sciences” and the “life sciences”). The proportion of materials funding against that total of about $425 M is 13.9 percent. Bearing in mind that the NSF data appears to relate primarily to funds for “metallurgy and materials” departments, it is of interest to note the distribution of agency sources of funds for that category in Table 2.16 compared to that shown in Table 2.13 for total federally supported materials R&D.
Table 2.17 shows the proportions of federal agency funds for materials R&D in universities, as reflected by the NSF data (interpreted as applying mainly to materials departments). The differences between these figures and the agency totals in Table 2.18 provide the best current estimate of the federal funds for materials R&D universities going outside the materials departments. This tabulation indicates that federal support of university materials research allocated outside the materials department is more than twice as large as that for materials research within such departments (apart from the questionable data available for NASA and Department of Interior).
Industrial Research and Development
Accurate figures are not available for materials research and development in industry. Data for industrial R&D in general (Table 2.19) indicate that All Industries planned a 4 percent increase in spending in 1972 including federally-funded industrial R&D. The metals-producing industries—steel, monferrous metals, fabricated metals—were expected to remain essentially level in 1971–72 in current dollars. This would have meant an 8 to 10 percent decrease in research and development actually performed, because of rising costs. Decreases in work performed were also indicated in paper and in stone, clay, and glass. All Manufacturing showed an estimated increase of only 2 percent in 1972, again amounting to a decrease in R&D actually performed. Even in high technologies like aerospace (no change in 1972) and electrical machinery and communications (up 2 percent), R&D spending has not kept up with rising costs. Industrial research and development as a percent of sales (Table 2.20) held level or declined in 1972 in all areas except aerospace. Federally-funded research and development in All Manufacturing (Table 2.21) is declining, both in dollars and as a percentage of total industrial R&D.
More recent figures (Table 2.22) have shown a brightening picture for company-funded research and development, although substantial differences exist among individual industries. Spending on basic research in All Industries is projected to rise 25 percent in 1972–75, to $650 M; spending on research and development overall is expected to rise 22 percent in the same period, to just under $14 billion. The source of these figures, the National Science Foundation, notes the changing nature of industrial basic research. Companies generally are shifting toward “shorter-term, more relevant, and hence more economically-justifiable projects.”
Industry in this country and abroad has produced many of the outstanding achievements of materials science and engineering. They include nylon; the transistor; the high-field superconductor; the laser; phosphors for television, radar, and fluorescent lamps; high-strength magnetic alloys; magnetic ferrites;
TABLE 2.16 Distribution of Federal Agency Support for “Metallurgy and Materials” R&D at Universities for FY 1970*
|
Agency |
Support (Dollars in Thousands) |
Percent |
|
AEC |
2,461 |
14.0 |
|
DoD |
7,825 |
44.5 |
|
NASA |
1,380 |
7.8 |
|
NSF |
3,547a |
20.2 |
|
Interior |
1,992 |
11.3 |
|
NBS (Commerce) |
– |
– |
|
Agriculture |
240 |
1.4 |
|
DOT |
– |
– |
|
HEW |
158 |
0.9 |
|
HUD |
– |
– |
|
|
$17,603 |
100. |
|
* Courtesy Dr. Charles Falk, NSF. a The size of the NSF figure suggests that it is only for “engineering materials” in the NSF Engineering Division in FY 1970. |
||
TABLE 2.17 Proportion of Federal Agency Materials R&D Funds Allocated to Universities—FY 1970*
TABLE 2.18 Comparison of Federal Materials R&D Support at Universities Between “Materials Departments” and “Other Departments” —FY1970
|
Agency |
Total University Federal Materials R&Da (Dollars in thousands) |
“Materials Departments”b (Dollars in thousands) |
“Other Departments” (by difference) |
|
AEC |
19,400 |
2,461 |
16,939 |
|
DoD |
18,800 |
7,825 |
10,975 |
|
NASA |
800c |
1,380 |
–580 |
|
NSF |
10,150 |
3,547 |
6,603 |
|
Interior |
350 |
1,992 |
–1,642 |
|
NBS (Commerce) |
0 |
0 |
0 |
|
Agriculture |
2,100 |
240 |
1,860 |
|
DOT |
3,650 |
0 |
3,650 |
|
HEW |
3,800 |
158 |
3,642 |
|
HUD |
0 |
0 |
0 |
|
|
59,050 |
17,603 (29.8% of total) |
|
|
a Data from ICM Survey, August 1971. b Data from NSF Survey. c Listed as “estimated” in the ICM Survey. |
|||
TABLE 2.19 Industrial Research and Development (Includes federally-funded industrial R&D)
|
|
Expenditures |
|
Change |
|||||
|
|
1970 |
Est. |
Planned |
|
||||
|
|
Actual |
1971 |
1972 |
1975 |
1971–72 |
1972–75 |
||
|
|
(Millions) |
(Percent) |
||||||
|
Steel |
$ 131 |
$ 122 |
$ 132 |
$ 149 |
8 |
13 |
||
|
Nonferrous Metals |
134 |
165 |
155 |
234 |
–6 |
51 |
||
|
Machinery |
1,727 |
1,831 |
1,923 |
2,173 |
5 |
13 |
||
|
Electrical Machinery and Communications |
4,324 |
4,410 |
4,498 |
5,353 |
2 |
19 |
||
|
Aerospace |
5,173 |
4,914 |
4,914 |
5,061 |
0 |
7 |
||
|
Autos, Trucks, and Parts, and Other Transportation Equipment |
1,475 |
1,475 |
1,504 |
1,609 |
2 |
7 |
||
|
Fabricated Metals and Ordnance |
183 |
176 |
183 |
210 |
4 |
15 |
||
|
Professional and Scientific Instruments |
694 |
756 |
824 |
972 |
9 |
18 |
||
|
Lumber and Furniture |
24 |
31 |
36 |
38 |
16 |
6 |
||
|
Chemicals |
1,809 |
1,827 |
1,882 |
2,145 |
3 |
14 |
||
|
Paper |
119 |
133 |
133 |
166 |
0 |
25 |
||
|
Rubber Products |
238 |
281 |
295 |
366 |
5 |
12 |
||
|
Stone, Clay, and Glass |
188 |
169 |
169 |
198 |
0 |
17 |
||
|
Petroleum Products |
608 |
492 |
522 |
606 |
6 |
16 |
||
|
Food and Beverages |
198 |
208 |
225 |
263 |
8 |
17 |
||
|
Textile Mill Products and Apparel |
64 |
60 |
66 |
81 |
10 |
23 |
||
|
Other Manufacturing |
98 |
117 |
124 |
161 |
6 |
30 |
||
|
ALL MANUFACTURING |
$17,187 |
$17,167 |
$17,585 |
$19,755 |
2 |
12 |
||
|
Nonmanufacturing |
669 |
723 |
1,063 |
1,711 |
47 |
61 |
||
|
ALL INDUSTRIES |
$17,856 |
$17,890 |
$18,648 |
$21,466 |
4 |
15 |
||
|
Source: National Science Foundation (1972). |
||||||||
TABLE 2.20 Industrial Research and Development as Percent of Sales*
|
|
1970 |
1971 |
1972a |
1975a |
|
Steel |
0.34% |
0.31% |
0.28% |
0.26% |
|
Nonferrous Metals |
0.76 |
0.90 |
0.79 |
0.93 |
|
Electrical Machinery |
8.51 |
8.17 |
7.72 |
7.23 |
|
Machinery, Other |
3.08 |
3.08 |
2.96 |
2.61 |
|
Aerospace |
19.02 |
20.05 |
20.88 |
17.92 |
|
Autos, Trucks, and Parts, and Other Transportation Equipment |
2.73 |
2.23 |
2.05 |
1.71 |
|
Stone, Clay, and Glass |
1.06 |
0.81 |
0.74 |
0.70 |
|
Fabricated Metals |
0.44 |
0.41 |
0.40 |
0.37 |
|
Instruments |
5.71 |
6.39 |
6.27 |
5.52 |
|
Chemicals |
3.71 |
3.54 |
3.41 |
3.16 |
|
Paper |
0.74 |
0.51 |
0.47 |
0.45 |
|
Rubber |
1.36 |
1.49 |
1.43 |
1.34 |
|
Petroleum |
2.29 |
1.76 |
1.73 |
1.66 |
|
Textiles |
0.29 |
0.26 |
0.26 |
0.24 |
|
Food and Beverages |
0.20 |
0.20 |
0.20 |
0.19 |
|
Other Manufacturing |
0.13 |
0.14 |
0.14 |
0.13 |
|
ALL MANUFACTURING |
2.63 |
2.47 |
2.32 |
2.08 |
|
* Sales figures are based on company data classified by major product line. a 1972 estimated; 1975 planned. Source: 1972 McGraw-Hill Survey of Industry Research and Development. |
||||
TABLE 2.21 Federally-Financed Industrial Research and Development (Amounts and percent of total R&D spending by industry)
|
|
1971 |
1972b |
1975b |
|||
|
INDUSTRY |
Percent |
Million Dollars |
Percent |
Million Dollars |
Percent |
Million Dollars |
|
Steel |
|
|
|
|||
|
Nonferrous Metals |
5 |
$ 8 |
6 |
$ 9 |
6 |
$ 14 |
|
Machinery |
12 |
220 |
10 |
192 |
8 |
174 |
|
Electrical Machinery and Communications |
50 |
2,205 |
48 |
2,159 |
42 |
2,248 |
|
Aerospace |
80 |
3,931 |
76 |
3,735 |
72 |
3,644 |
|
Autos, Trucks, and Parts, and Other Transportation |
13 |
192 |
12 |
180 |
10 |
161 |
|
Fabricated Metals and Ordnance |
3 |
5 |
3 |
5 |
3 |
6 |
|
Professional and Scentific Instruments |
25 |
189 |
23 |
190 |
21 |
204 |
|
Lumber and Furniture |
|
|
|
|||
|
Chemicals |
10 |
183 |
10 |
188 |
11 |
236 |
|
Paper |
1 |
1 |
1 |
1 |
1 |
2 |
|
Rubber Products |
15 |
42 |
14 |
41 |
12 |
40 |
|
Petroleum Products |
5 |
25 |
5 |
26 |
5 |
30 |
|
Food and Beverages |
1 |
2 |
1 |
2 |
1 |
3 |
|
Textile Mill Products and Apparel |
|
|
|
|||
|
Other Manufacturing |
|
|
|
|||
|
ALL MANUFACTURING |
41 |
$ 7,008 |
38 |
$6,731 |
34 |
$6,770 |
|
Nonmanufacturing |
68 |
492 |
65 |
691 |
60 |
1,027 |
|
ALL INDUSTRIES |
42 |
$ 6,500 |
40 |
$7,422 |
36 |
$7,797 |
|
a Less than $500,000. b 1972 estimated; 1975 planned. Source: National Science Foundation (1972). |
||||||
TABLE 2.22 Company-Funded Industrial Research and Development (Millions)
|
|
Total R&D |
Basic Research |
||||
|
|
1971 |
1972 |
1975 (Est.) |
1971 |
1972 |
1975 (Est.) |
|
All Industries |
$10,643 |
$11,400 |
$13,950 |
$ 494 |
$ 520 |
$ 650 |
|
Drugs and Medicine |
505 |
560 |
750 |
95 |
105 |
140 |
|
Industrial Chemicals |
864 |
890 |
1,025 |
100 |
105 |
125 |
|
Petroleum |
488 |
495 |
525 |
22 |
23 |
25 |
|
Electrical Equipment |
2,230 |
2,400 |
3,000 |
109 |
115 |
145 |
|
Aircraft and Missiles |
1,012 |
975 |
1,150 |
34 |
30 |
40 |
|
All Other |
5,544 |
6,080 |
7,500 |
134 |
142 |
175 |
|
Source: National Science Foundation (1973). |
||||||
and polyethylene. These developments occurred in industries that conducted long-range research to expand the basic knowledge on which the industry ultimately relied. By thus supplementing their experience-based approach to materials research and development, these industries established technological leadership for themselves and for their countries. The resulting cumulative national payoff, though difficult to measure, is substantial.
Our current shift from aerospace, atomic energy, and defense toward more civilian-oriented technologies offers industry a wide variety of fresh technical challenges: in the environment, in energy, in the quality and safety of consumer goods. Many such challenges will be met only with the help of sustained basic and applied research. Yet, industry has been cutting back its relatively basic programs in the past few years. The science-intensive industries have retrenched significantly; the experience-based industries in many cases have virtually eliminated their basic research.
Competitive pressures and the cost of research and development are rising steadily. A not-uncommon view is that the penalties of failure in R&D and the liability of high engineering risk have grown too great, while the rewards of success and the achievement of advanced product-performance are too easily appropriated by others. Some companies now are reluctant to undertake programs that do not promise to begin to pay for themselves in five to ten years at the most. The payoff period for basic research in materials, in contrast, although it tends to be shorter than in other areas, may sometimes exceed 10 years. A company that is not a technological leader may find that new technology is obtained most sensibly from other companies, by cross-licensing or by royalty agreements. But the company striving to achieve or maintain technical leadership will find a balanced research and development program essential to its success.
More broadly, were basic research in materials science and engineering to be eliminated, the rate of introduction of new technology might not slow noticeably for several years. But then the nation’s capability would decline-precipitously in some high-technology areas, more slowly in low-technology areas. The country could sink to a seriously inferior position internationally in ten to twenty years. Many industrial managements and, perhaps, the general public are not prepared to wait that long for the fruits of research. But industry should recognize more widely, we believe, that research in materials characteristically has returned good value and that the payoff is more assured than in many other fields. Progress in materials may not depend on public support to the same extent as does astronomy, let us say, but for government, as for industry, materials science and engineering represents a sound investment. As in other fields, the decisions to be made often relate to the appropriate roles of government and private initiative in undertaking research. These can be hard decisions, but they must be made.
OPPORTUNITIES FOR MATERIALS SCIENCE AND ENGINEERING
In this chapter, we have noted that the shifting of national priorities for technology in no way lessens, and generally increases, the demands on materials science and engineering. These demands are sharply revealed by
concerns over possible shortages of critical materials and of energy, and over the harmful effects on the environment by man’s operations with materials. Merely to sustain our standard of living, let alone advance it, has dramatic impact on international trade, and so adds further dimensions to the challenge. Moreover, there is in the background society’s ambivalent view of technology—a love-hate relationship—never quite knowing whether to embrace it or to reject it. As a result, the challenges to materials science and engineering are exquisitely complex. But just as in the past when properly manned and supported, materials science and engineering has met the demands of national defense, space, and other high technologies, so can it address successfully the problems of the newer societal concerns.
A specially important opportunity for materials science and engineering in the present context is conservation. The materials community is now challenged to find positive ways to conserve natural resources and energy, to conserve the environment, to conserve man’s standard of living and the quality of life. The latter relates particularly to interactions between people and nations with different backgrounds and cultures.
APPENDIX 2A
PROFILE OF MANPOWER IN MATERIALS SCIENCE AND ENGINEERING
Method of Analysis
The National Science Foundation has maintained an activity directed to the collection and statistical analysis of data concerning scientists and engineers in the U.S. for many years. The files of the NSF are a principal source of statistical information about technical manpower. With the generous cooperation of the NSF and the National Research Council, COSMAT was able to analyze the 1968 National Register of Scientific and Technical Personnel and the 1969 National Engineers Register.
The National Register of Scientific and Technical Personnel (frequently referred to hereafter as the Science Register) is a body of data on scientists in the U.S. that is maintained by NSF through contacts with a group of scientific societies. Data were obtained by periodically (biannually) sending questionnaires to all scientists who could be identified by the societies involved.
The National Engineers Register is a file of data on engineers in the U.S. that is accumulated by the Engineers Joint Council and NSF through questionnaires sent to a sample of engineers who are members of societies associated with the Engineers Joint Council. It is the principal data-base available concerning the engineering profession in the U.S.
An early problem faced by COSMAT in attempting to study materials scientists and engineers was that of identifying the population involved. That is, it was necessary to answer the question, “Whom shall we call a materials scientist or engineer?” Opinions on this subject differed widely and it was decided that a pragmatic way to resolve the question of defining a materials professional was to refer to the COSMAT Committee itself, supplemented by other groups of knowledgeable scientists and engineers, including members of the technical staffs of the Bell Telephone Laboratories and the Ford Scientific Laboratories, university department heads, and members of the National Materials Advisory Board and of the Interagency Council on Materials. The operational device consisted of circulating the Specialties List from the National Register of Scientific and Technical Personnel and the National Engineers Register List of Areas of Technology and Science to the above groups. These lists were then used by respondents to describe their employment profiles and professional competences. All told, 96 useful responses were analyzed. As expected, a diversity of opinion among the respondents was found, but there was also considerable agreement. Thus, an MSE score (in essence, a measure of the percentage of respondents who believed that a
specialty area properly belonged to the MSE field) was defined to describe quantitatively the degree to which each such area was regarded to be in the province of MSE.* The spectrum of scores so obtained ranged continuously from practically universal agreement on inclusion of some areas in MSE to general agreement that many other areas were clearly outside MSE. Obviously, there was a certain arbitrariness in our choice of where to draw the line bounding MSE for the purposes of this study. We usually adopted a cutoff score of 45, but will discuss on occasion how choice of a different score would have affected our results. The names of the specialties used and their MSE scores are given in Attachments 2A.1 (page 2–85) and 2A.2 (page 2–88).
The effect of increasing the stringency of the criterion for inclusion of a specialty field in MSE is shown in Figure 2.9. Here the percentage of all respondents to the 1968 and 1969 Registers who are to be included in MSE is plotted as a function of the MSE cutoff score—the higher the latter, the smaller the population included in MSE. Ideally, of course, the plot of Figure 2.9 should be a horizontal line; then all respondents to the poll would agree on the fields to be included in MSE, all fields would have an MSE score of 100 or 0, and the number of people in MSE would be independent of the cutoff score. The more nearly horizontal the line, the more nearly this ideal is attained.
Apparently, then, the ideal is more closely approached in the case of the Science Register than in the case of the Engineers Register. It is felt that the polling via the specialties lists is a more accurate and useful procedure for scientists than for the engineers because the specialties list used in the survey of scientists happened to be much more detailed and technically descriptive than the list of areas of technology and science used to survey the engineers.
The Engineers Register
The National Engineers Register List of Areas of Technology and Science was also circulated to a second group of specialists in materials engineering and a somewhat different set of rankings of the areas were obtained for inclusion in MSE. The most populous fields appeared high in both cases, however, and we believe that our profile of the materials engineer is not unduly affected by the choice of group polled or the exact cutoff point.
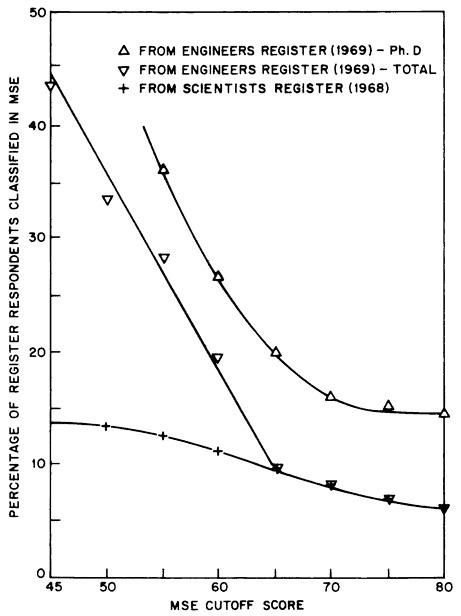
Having identified a group of areas of technology and science to characterize MSE, surveys were made of the ways in which engineers in the Engineers Register, whose employment profile indicated that they were employed in one of these areas, responded to the various questions of the Engineers Register. The accompanying tables are based on these counts. In most instances, the results are described by percentages. In a few cases, however, it is most appropriate to present numbers of engineers. It must be remembered in such cases that the data represent only a relatively small sample of the engineering profession. The data on the Engineers Register used in this study refer to a population with a size equal to 6.9×size of our sample. The factor 6.9 then can be applied to estimate total numbers in the Register from the numbers presented in this study. The population registered by the Engineers Joint Council does not, however, include all engineers, but only those who are members of a society affiliated with EJC; it can be estimated that the total population of engineers is 3.5 times larger. Thus, rough estimates of total numbers of engineers can be obtained by multiplication by 24 (i.e. 6.9×3.5), although it must be emphasized that large errors can be made by application of this factor in detail, since engineers affiliated with EJC societies may not be typical of those not so affiliated.
In most instances, the figures for materials engineers are compared with similar ones for all engineers.* Furthermore, it turns out that there are striking differences in many respects between the Ph.D.’s in an engineering field and the nondoctoral engineers. Thus, although the doctoral engineers are few in number compared to the total engineers, results for them are tabulated separately.
Table 2.23 compares gross statistics, educational curricula, and type of employer of those identified as materials engineers with all engineers. A few salient observations concerning the differences may be made. Apparently, the larger areas or specialties of technology and science fall into the materials field, since, although only 29 percent of the specialties are included, these specialties contain about half of all of the engineers. The materials engineers, so defined, are slightly more highly educated than the average engineer; 8.8 percent of them have their Ph.D. as compared to 7.7 percent of all the engineers. There is a significantly smaller percentage of graduates from electrical curricula among the materials engineers, than among the total engineers. Metallurgical training is particularly prominent among the Ph.D.’s in the materials field. The materials engineers are slightly more concentrated in industry and business than the average engineer, and the reverse in the federal government.
Table 2.24 shows the leading societies represented among the materials engineers. These are the same societies that lead in membership among all engineers and in size of society, although there are some significant differences in the ordering of the societies among the different groups. The higher concentration of materials engineers in ASM and ASME and the lower concentration in IEEE as compared to all engineers are noteworthy.
TABLE 2.23 Comparison of Materials Engineers with All Engineers
|
|
Materials Engineers |
All Engineers |
|
Total Number in Survey* |
21879 |
44800 |
|
Percent Ph.D. |
8.8 |
7.7 |
|
Areas of Technology and Science |
58 |
200 |
|
Leading Curricula (all degrees [%]) |
||
|
Electrical/Electronic |
11.8 |
20.8 |
|
Mechanical |
24.8 |
18.0 |
|
Civil |
15.4 |
13.7 |
|
Chemical/Chemistry |
10.0 |
8.9 |
|
Metallurgical |
6.7 |
4.0 |
|
Leading Curricula (Ph.D. [%]) |
||
|
Chemical/Chemistry |
21.3 |
19.1 |
|
Metallurgical |
16.1 |
10.2 |
|
Engineering Mechanical |
9.5 |
6.1 |
|
Civil |
9.8 |
8.6 |
|
Mechanical |
13.7 |
11.0 |
|
Electrical/Electronic |
6.9 |
11.0 |
|
Type of Employer (%) |
||
|
Industry and Business |
75 |
72 |
|
Education and Non-Profit |
9 |
7 |
|
Federal Government |
7 |
10 |
|
* Multiply the numbers by 6.9 to obtain figures corresponding to the total number of registrants, and then by another factor of 3.5 to scale up to the total engineering population in the U.S. |
||
TABLE 2.24 Society Membership (%)
|
Leading Societies |
% Materials Engineers (Ph.D.) Who Are Members. |
% Materials Engineers Who Are Members |
% All Engineers Who Are Members |
|
ASME |
24.6 |
21.5 |
18 |
|
ASCE |
13.0 |
17.1 |
18 |
|
IEEE |
11.4 |
12.6 |
18 |
|
AIME |
21.8 |
11.4 |
10 |
|
NSPE |
6.6 |
11.3 |
11 |
|
ASM |
18.6 |
10.6 |
5 |
|
AIChE |
18.0 |
9.7 |
8 |
|
AIAA |
16.3 |
7.2 |
11 |
|
ASEE |
27.9 |
4.6 |
5 |
The differences among societies in percentage of Ph.D. materials engineers who are members as compared to percentage of all engineers and all materials engineers who are members is suggestive of differing degrees of sophistication in the use of materials in different segments of the engineering enterprise. Table 2.25 has been prepared to study this topic further. The Engineers Register arranges the areas of technology and science into “product groups.” In Table 2.25 the percentage of Ph.D. level materials engineers that the COSMAT survey found in each large and well-defined product group is presented. The total number of materials engineers in each group is also given as an indication of the significance of the statistic. It will be seen that there are three kinds of product groups. One group comprises Construction and Civil Engineering, Machinery and Mechanical Equipment, and Utilities; Ph.D.’s constitute less than a percent of the materials engineers employed in this group. The second group, including Electrical Equipment, Transportation, and Motor Vehicle Transportation, contains a few percent of Ph.D.’s among its materials engineers. The third group, including Aircraft and Space, Ceramics, Chemicals, Computers, Electronic Equipment, and Basic Metals, employs of the order of 10 percent Ph.D.’s among its materials engineers.
It is also important to comment at this point on the way in which choice of sample affects the results of Table 2.24 and, perhaps, of other tables in this series. Only members of a limited selection of societies associated with the EJC are included in the list from which the EJC sample was drawn. There is naturally a tendency for membership in these societies to be emphasized in the results. A case in point is the Society of Plastics Engineers (SPE). Only 152 respondents to the Register indicated membership in SPE in the 1969 Survey. However, in a comparable survey in 1964, 952 memberships in SPE were reported by respondents. The difference is a reflection of the fact that the SPE membership list was included in constructing the 1964 sample.
On the other hand, the completeness with which our specialty selection does cover the materials areas among the engineers is illustrated by the following statistic; of 2380 respondents to the survey who indicated membership in the ASM, 2286 are included in our classification of materials engineers.
Table 2.26 presents the principal employment functions of materials engineers. It is seen that these are not very different from the functions of all engineers. A similar statement can be made about supervisory responsibilities of materials engineers; they are essentially the same as most engineers as a whole.
A question concerning professional identification revealed that materials engineers have a slightly more scientific orientation than engineers as a whole. 6.4 percent of materials engineers identified themselves with a scientific discipline (physicist, chemist, geologist, metallurgist) as compared to 4 percent of all engineers.
Table 2.27 shows that 37 percent of all materials engineers received some federal government support for their work. This is somewhat less than the percentage reported by all engineers, 45 percent. Table 2.27 also shows the national programs to which this support is related.
TABLE 2.25 Percentage of Ph.D.’s Among Materials Engineers by Product Group
|
Product Group |
Number of Materials Engineers |
Percent Ph.D. |
|
Aircraft and Space |
1779 |
9 |
|
Ceramics |
234 |
11 |
|
Chemicals |
1910 |
12 |
|
Computers |
266 |
10 |
|
Construction and Civil Engineering |
3726 |
0.3 |
|
Electrical Equipment |
1246 |
3 |
|
Electronic Equipment |
875 |
10 |
|
Machinery and Mechanical Equipment |
3323 |
0.3 |
|
Transportation |
301 |
3 |
|
Metals, Basic |
1638 |
15 |
|
Metal Products |
790 |
4 |
|
Motor Vehicle Transportation |
756 |
2 |
|
Utilities |
858 |
0.3 |
The product or service to which the work of engineers is related is presented in Table 2.28. Again, the materials engineer is similar to the other engineers, the notable exception being a heavier concentration of materials engineering in Machinery and Mechanical Equipment and in Basic Metals areas. The high concentration of Ph.D. materials engineers in educational services is also noteworthy.
Tables 2.29 and 2.30 indicate the areas of technology and science which contribute most of the members of our materials group. The amorphous character of the materials field may be seen by the vagueness with which many of the titles included describe the work of the engineer. Thus, the largest contributor to the statistics is simply called Engineering. The reason that our restricted set of areas includes half of the engineering profession is a result of the inclusion by the respondents to our poll of the various large, vaguely-defined fields, such as Engineering, Electrical Engineering, and Mechanical Engineering in the survey. It may be noted that the 12 areas listed in Table 2.29 account for about 80 percent of the materials engineers. These areas only account for about 40 percent of all engineers. Thus, sharp contrasts between materials engineers and the average engineer of the survey cannot be expected.
Because the total population of the areas of technology and science chosen to represent materials engineering is diluted with a substantial number of nonmaterials engineers, especially in the broadly inclusive areas such as “Engineering,” we also studied a more rigorously defined group of materials engineers, by counting responses for the 16 highest ranking areas of our poll. All these areas received MSE scores of 75 or greater on the poll of COSMAT participants; there is a large measure of agreement that they are part of materials engineering, and it can be stated with confidence that most of the individuals are indeed materials engineers. These areas are listed in Table 2.31.
It will be seen that these specialties, which are recognized by most of our respondents as belonging essentially to materials engineering, do not include the more vaguely-defined areas that contribute so much to the main group of materials engineers, and, indeed, of all engineers in the Register. We call the areas in Table 2.31 “agreed” materials engineering areas, but stress that materials engineers in other areas are equally materials engineers.
Selected characteristics of the engineers in the 16 high-ranking areas are shown in Table 2.32. A greater concentration of this “agreed” group in a few categories and more striking differences with engineers as a whole are revealed by comparison of Table 2.32 with previous tables. Tables 2.31 and 2.32 also show that these “agreed” specialties are mainly metallurgical. This is indicated not only by areas of technology in Table 2.31, but by the leading curricula, strong concentration of society membership in ASM and AIME, and by employment in metals-producing fields in Table 2.32.
It is also found that the employment of materials engineers in the selected 16 areas is slightly more-heavily concentrated in industry and business and in educational and nonprofit enterprises than is the average engineer. These materials engineers are also much more heavily oriented toward research than engineering as a whole, and less toward design, planning, and directing. Although the government support for the “agreed” areas is
TABLE 2.28 Product or Service Related to Employment (%)
|
|
Materials Engineers |
||
|
|
(Ph.D.) |
(All) |
All Engineers |
|
Construction and Civil Engineering |
5.7 |
17.0 |
16 |
|
Machinery and Mechanical Equipment |
5.7 |
15.2 |
10 |
|
Chemicals and Allied Products |
11.4 |
8.7 |
7 |
|
Aircraft and Space |
8.7 |
8.1 |
11 |
|
Metals, Basic (except Mining) |
12.5 |
7.5 |
4 |
|
Electrical Equipment and Services |
2.2 |
5.7 |
7 |
|
Educational and Information Services |
32.1 |
5.2 |
5 |
|
Electronic Equipment and Service |
4.5 |
4.0 |
7 |
TABLE 2.29 Leading Employment Specialties of Materials Engineers (%)
|
Name |
Number of Materials Engineers |
Percent of All Materials Engineers |
|
Engineering |
3598 |
16.4 |
|
Mechanical Engineering |
3375 |
15.4 |
|
Structures |
1993 |
9.1 |
|
Electrical Engineering |
1971 |
9.0 |
|
Product Engineering |
1072 |
4.9 |
|
Electronic Applications |
960 |
4.4 |
|
Instrumentation |
909 |
4.2 |
|
Manufacturing Technology |
780 |
3.6 |
|
Chemical Applications |
778 |
3.6 |
|
Mechanical Applications, Applied Mechanics |
697 |
3.2 |
|
Metallurgy (General) |
657 |
3.0 |
|
Materials Applications |
616 |
2.8 |
|
|
79.6 |
|
TABLE 2.30 Leading Employment Specialties of Materials Engineers (Ph.D., [%])
|
Name |
Number of All Ph.D. Materials Engineers |
Percent of All Ph.D. Materials Engineers |
|
Mechanical Engineering |
175 |
9.1 |
|
Metallurgy, Physical |
162 |
8.4 |
|
Structures |
158 |
8.2 |
|
Engineering |
153 |
8.0 |
|
Chemical Applications |
135 |
7.0 |
|
Mechanics |
119 |
6.2 |
|
Electrical Engineering |
110 |
5.7 |
|
Heat Transfer |
96 |
5.0 |
|
Metallurgy (General) |
81 |
4.2 |
|
Processes |
73 |
3.8 |
|
|
65.6 |
|
TABLE 2.31 Some “Agreed” Areas of Technology and Science (MSE Score = 75) in Materials Engineering
|
Name |
|
Metallurgy (general) |
|
Metallurgy (physical) |
|
Metallurgy (powder) |
|
Materials Properties |
|
Crystals, Crystallography |
|
Materials Applications |
|
Metallurgy (process) |
|
Corrosion |
|
Solid State |
|
Casting |
|
Metallurgy (extractive) |
|
Thermodynamics |
|
Coating, Plating, Cladding |
|
Dielectrics |
|
Forming, Shaping |
|
Friction |
TABLE 2.32 Characteristics of Materials Engineers in Sixteen “Agreed” Areas of Technology and Science in Materials Engineering
|
|
Ph.D. Materials Engineers |
Total Materials Engineers |
|
Number |
527 |
3135 |
|
Percent Ph.D. |
— |
16.8 |
|
Leading Curricula (percent) |
||
|
Metallurgical |
52.9 |
39.8 |
|
Chemical/Chemistry |
15.4 |
13.1 |
|
Mechanical |
5.5 |
11.5 |
|
Type of Employer (percent) |
||
|
Industry and Business |
53.5 |
78.2 |
|
Education and Nonprofit |
37.2 |
12.0 |
|
Federal Government |
5.7 |
5.2 |
|
Leading Societies (percent) |
||
|
ASM |
57.9 |
52.8 |
|
AIME |
65.3 |
42.9 |
|
ASTM |
9.1 |
10.2 |
|
Principal Functions (percent) |
||
|
Research |
42.1 |
21.3 |
|
Teaching |
26.6 |
6.2 |
|
Planning, Directing |
8.9 |
12.3 |
|
Development |
7.8 |
11.8 |
|
Sales, Technical Services |
0.9 |
11.2 |
|
Receiving Government Support |
||
|
Total |
52.8 |
34.6 |
|
Defense |
30.8 |
20.9 |
|
Atomic Energy |
16.6 |
7.8 |
|
Space |
13.9 |
10.5 |
|
Transportation |
4.4 |
9.5 |
|
Leading Products or Service |
||
|
Metals, Basic (except Mining) |
41.2 |
42.3 |
|
Machinery, Mechanical Equipment |
2.7 |
8.8 |
|
Aircraft and Space |
7.0 |
8.4 |
|
Metal Fabricated Products |
3.4 |
6.4 |
|
Professional Identification (percent) |
||
|
Metallurgist |
43.8 |
29.6 |
|
Physicist, Chemist, Geologist |
8.0 |
3.3 |
|
Engineer |
39.1 |
50.6 |
|
Other |
6.9 |
13.5 |
about the same as for all engineers, it is more concentrated in the Defense, Atomic Energy, and Space fields than is the case for the average engineer. The scientific orientation of the 16 areas is also shown by the fact that only about half of their number identify themselves as engineers, in contrast to 85 percent of all those on the Register who identify themselves as engineers in response to a question concerning professional identification.
The Science Register
Our analysis of the Science Register was similar to that of the Engineers Register. A line between those regarded as materials scientists and those excluded was drawn at an MSE score of 45. Then, as in the case of the Engineers Register, a count of the responses to various questions by the materials science population was made.
The Science Register contained salary information, and, to investigate salaries, a five-dimensional table of the following variables was constructed: degree, age, salary, type of employer, work activity. Obviously, such a table contains tens of thousands of entries, and it is not feasible to reproduce it here. However, the data were available to COSMAT committees for their detailed studies and will form the basis for comments and tables in this section.
The treatment of the data for scientists is necessarily different than that for engineers since different questions were asked on the two Registers. Furthermore, the Register of Scientists is intended to be complete rather than a sample. It is, indeed, estimated that the coverage of Ph.D. scientists is quite complete, being at least 80 percent. On the other hand, the non-Ph.D. scientist group is less well defined because the criteria for inclusion in the Register vary from one participating society to another. Thus, COSMAT regards the results for the Ph.D. scientists as the most significant in the present study and it is these findings that will be emphasized.
The record provided by NSF to COSMAT containing information on all those scientists employed in one of the specialties identified as part of materials science covers about 42,000 scientists. (It will be observed that this is substantially less than the number of persons characterized as materials engineers.) Of the 42,000 materials scientists, 39 percent or about 16,500 have doctoral degrees. These numbers are not very sensitive to the exact score at which the line between materials science and other fields is drawn; they are not changed by more than 10 percent if a cutoff MSE score of 55 is used instead of 45.
A breakdown of the scientific disciplines in which the employment specialties of materials scientists are found, is given in Table 2.33. It is seen that most of the materials scientists are chemists and that the largest subfield of chemistry represented is organic chemistry. About half of all the chemists and 30 percent of all the physicists in the National Register are materials scientists by our criteria.
The heavy component of chemistry among those identified as materials scientists is shown in Table 2.34, which tabulates the leading major subjects of highest degree. This is confirmed by Table 2.35 where the leading professional identifications of the materials scientists are tabulated. Note that this table represents the response to an unstructured question; the
TABLE 2.33 Numbers of Materials Scientists, By Discipline
|
|
Ph.D. |
Percent |
Total |
Percent |
|
Chemistry |
||||
|
Analytical |
1146 |
7.1 |
5014 |
12.1 |
|
Inorganic |
1492 |
9.2 |
3328 |
8.0 |
|
Organic |
4126 |
25.4 |
13271 |
32.0 |
|
Physical |
3768 |
23.2 |
6437 |
15.5 |
|
Other Chemistry |
610 |
3.8 |
3836 |
9.2 |
|
Total Chemistry |
11142 |
69 |
31888 |
77 |
|
Physics |
||||
|
Solid State |
2211 |
13.6 |
3750 |
9.0 |
|
Other Physics |
2619 |
16.1 |
5441 |
13.1 |
|
Total Physics |
4830 |
29.8 |
9191 |
22.1 |
|
Earth Sciences |
261 |
1.6 |
503 |
1.2 |
|
Total |
16233 |
|
41582 |
|
TABLE 2.34 Leading Major Subjects of Highest Degree Among Materials Scientists
|
|
Ph.D. |
Percent |
Non-Ph.D. |
Percent |
|
Chemistry |
4159 |
25.6 |
13551 |
32.6 |
|
Physics |
3853 |
23.7 |
3628 |
8.7 |
|
Organic Chemistry |
2539 |
15.6 |
878 |
2.1 |
|
Engineering |
628 |
3.9 |
2518 |
6.1 |
|
Physical Chemistry |
2211 |
13.6 |
515 |
1.2 |
|
Chemical Engineering |
214 |
1.3 |
1522 |
3.7 |
|
Inorganic Chemistry |
712 |
4.4 |
179 |
0.4 |
|
Analytical Chemistry |
526 |
3.2 |
277 |
0.7 |
TABLE 2.35 Leading Professional Identifications of Materials Scientists
|
|
Ph.D. |
Percent |
Non-Ph.D. |
Percent |
|
Chemist |
2532 |
15.6 |
7047 |
17.0 |
|
Physicist |
2853 |
17.6 |
2307 |
5.5 |
|
Chemical Engineer |
550 |
3.4 |
3357 |
8.1 |
|
Organic Chemist |
1908 |
11.8 |
1665 |
4.0 |
|
Physical Chemist |
2084 |
12.8 |
979 |
2.4 |
|
Analytical Chemist |
543 |
3.3 |
2048 |
4.9 |
|
Inorganic Chemist |
649 |
4.0 |
489 |
1.2 |
|
Polymer Chemist |
521 |
3.2 |
460 |
1.1 |
|
Solid State Physicist |
537 |
3.3 |
282 |
0.7 |
|
Management Scientist |
172 |
1.1 |
416 |
1.0 |
respondent was asked to write in what he considered himself to be. This, of course, limits the usefulness of the statistics. For example, it should not be assumed that everyone who simply wrote down “physicist” is not a solid-state physicist or that those who simply wrote down “chemist” are necessarily not polymer chemists.
Nevertheless, it may be interesting to examine the choice of professional identification among scientists whose specialties are clearly identified with aspects of materials science. Thus, Table 2.36 is presented, with the caution, again, that for example, not all rubber chemists necessarily characterize themselves by these words; they may simply have responded with “chemist” to the question concerning their professional identification.
The obviously low representation of certain fields that straddle science and engineering, for example, metallurgy, may be thought surprising. This is primarily a reflection of the selection of the cooperating societies that identify individuals for inclusion in the Science Register. A list of these societies is given in Table 2.37, and it can be seen that no metals or metallurgical society is included; metallurgical societies are affiliated with the Engineers Joint Council and are included in the sampling for the Engineers Register.
The important results of our cross-tabulation of materials scientists according to their work activity, type of employer, salary and age, are summarized in Tables 2.38 and 2.39. Table 2.38 shows the employment of materials scientists by degree level, institution, and work activity. Half of the Ph.D materials scientists and three-fourths of the non-Ph.D.’s are employed in business and industry. Educational institutions are the next largest employer. Practically all of the applied R&D scientists are employed in industry, and a large fraction of the basic research scientists work in industry also. Naturally, teaching is dominated by the educational institutions.
Table 2.39 shows median basic annual salaries (1968) of materials scientist by age and type of employer. Apart from educational institutions, there is little variation in salary among the various types of employer. There is also little variation with age, beyond the age of 40 or 45.
COSMAT also attempted to deduce the time dependence of some of the statistical aspects of materials science. Unfortunately, the list of specialties has changed from year-to-year to reflect the evolution of scientific fields, and thus no inclusive definition of materials science of the type developed for 1968 was available. As a result, studies like those carried out for the 1968 Register were not possible. A few names of materials science specialties that appeared on the specialties list in all of the years 1964, 1966, 1968, and 1970 and certain groups of specialties that might be expected to represent the same subject during these years were, however, selected. Unfortunately, the attempt cannot be regarded as successful; changes in the specialties list affect the population of specialties whose names are unchanged. For what they are worth, the results of populations of the sample specialty groups are listed in Table 2.40. Many curious changes will be noted, and COSMAT reemphasizes its view that these are almost certainly symptons of changes in the specialties list rather than changes in materials science.
TABLE 2.36 Number of Materials Scientists with Selected Professional Identification
|
|
Ph.D. |
Percent |
Non-Ph.D. |
Percent |
|
Polymer Chemist |
521 |
3.2 |
460 |
1.1 |
|
Rubber Chemist |
12 |
0.1 |
312 |
0.8 |
|
Solid-State Physicist |
537 |
3.3 |
282 |
0.7 |
|
Materials Chemist |
68 |
0.4 |
261 |
0.6 |
|
Crystallographer |
27 |
0.2 |
13 |
– |
|
Cellulose Chemist |
3 |
– |
7 |
– |
|
Textile Chemist |
32 |
0.2 |
145 |
0.3 |
|
Ceramist |
13 |
0.1 |
1 |
– |
|
Polymer Specialist |
14 |
0.1 |
10 |
– |
|
Metallurgist |
169 |
1.0 |
301 |
0.7 |
|
Materials Specialist |
68 |
0.4 |
33 |
0.1 |
|
Mineralogist |
60 |
0.4 |
45 |
0.1 |
|
Elastomer Chemist |
3 |
– |
26 |
– |
|
Coatings Chemist |
10 |
0.1 |
177 |
0.4 |
|
Paper Chemist |
24 |
0.1 |
73 |
0.2 |
|
Corrosion Chemist |
11 |
0.1 |
67 |
0.2 |
|
Solid-State Chemist |
50 |
0.3 |
27 |
0.1 |
|
Electrochemist |
119 |
0.7 |
168 |
0.4 |
|
Semiconductor Chemist |
4 |
– |
9 |
– |
|
Plastics Chemist |
26 |
0.2 |
230 |
0.6 |
|
Surface Chemist |
43 |
0.3 |
27 |
0.1 |
|
Metallurgical Chemist |
10 |
0.1 |
9 |
– |
TABLE 2.37 Criteria for Inclusion in the Science Register
|
The cooperating societies identify individuals with “full professional standing” for inclusion in the Science Register, whether or not they are members of a professional society. The following criteria for “full professional standing” were established in 1968 by the societies: |
|
CHEMIST (American Chemical Society) —A bachelor’s degree and current employment in an area of chemistry; or 10 years of professional experience in an area of chemistry. EARTH OR MARINE SCIENTIST (American Geological Institute) —A bachelor’s degree in an area of earth or marine science; or professional identification of geological scientist; or current employment in earth or marine science; and either enrolled currently in a Ph.D. program or 1 year of professional experience. ATMOSPHERIC OR SPACE SCIENTIST (American Meteorological Society) —A degree in the atmospheric or space sciences; or professional membership in the American Meteorological Society, or 10 years of professional service. PHYSICIST OR ASTRONOMER (American Institute of Physics) —A bachelor’s degree with 2 years of additional training or work experience; or the equivalent in professional experience. MATHEMATICIAN, STATISTICIAN, OR COMPUTER SCIENTIST (American Mathematical Society) —A bachelor’s degree in mathematics, statistics, or computer science with 4 years of professional experience; or a master’s degree with 2 years of professional experience; or a Ph.D.; or the equivalent in professional experience. BIOLOGIST (American Institute of Biological Sciences) —A bachelor’s degree in an area of biology with 2 years of professional experience; or a master’s degree with 1 year of professional experience; or a Ph.D.; or the equivalent in professional experience, BIOMEDICAL SCIENTIST (Federation of American Societies for Experimental Biology) —A Ph.D. in an area of human biology and engaged in research; or a professional medical degree and engaged in research; or the equivalent in professional experience. PSYCHOLOGIST (American Psychological Association) —The completion of 2 years of graduate work in psychology and either employed in work or engaged in graduate study that is primarily psychological in character; or a master’s degree in psychology from a recognized graduate school with 1 year of professional experience; or a Ph.D. based in part upon a psychological dissertation and conferred by a graduate school of recognized standing; or the equivalent in professional experience. |
TABLE 2.37 Criteria for Inclusion in the Science Register (Continued)
|
ECONOMIST (American Economic Association) —A bachelor’s degree in economics with 2 years of professional experience; or a graduate degree in economics; or the equivalent in professional experience. SOCIOLOGIST (American Sociological Association) —A bachelor’s degree in sociology or closely related field with 2 years of graduate training and either currently employed in a sociological field or enrolled in a graduate school; or a master’s degree with either 1 year of professional experience or 1 additional year of graduate training; or a Ph.D.; or the equivalent in professional experience. POLITICAL SCIENTIST (American Political Science Association) —A master’s degree in political science or 2 years of graduate work with 1 year of professional experience; or a Ph.D. in political science; or substantial professional achievement in political science; or the equivalent in professional experience. ANTHROPOLOGIST (American Anthropological Association) —A Ph.D. in anthropology; or the equivalent in professional experience. LINGUIST (Center for Applied Linguistics) —A bachelor’s degree in linquistics with evidence of continued activity in the field; or graduate training in linguistics; or employment in the field of linguistics; or professional identification of linguist supported by linguistic specializations; or the equivalent in professional experience. |
|
Source: “American Science Manpower 1968,” A Report of the National Register of Scientific and Technical Personnel, National Science Foundation NSF 69–38, Appendix C, p. 265. |
TABLE 2.38 Employment of Ph.D. Materials Scientists by Institution and Work Activity (1968)
|
|
Basic Research |
Applied Research |
Development and Design |
Management R & D |
Management Other |
Teaching |
Totalb |
|
Educational Institutions |
1858 |
91 |
3 |
119 |
182 |
2963 |
5377 |
|
Business and Industry |
1758 |
2580 |
548 |
2202 |
310 |
2 |
7774 |
|
U.S. Government |
533 |
132 |
12 |
182 |
8 |
5 |
905 |
|
FFRCa |
515 |
218 |
18 |
127 |
4 |
6 |
917 |
|
Nonprofit |
110 |
48 |
4 |
64 |
3 |
1 |
239 |
|
Totalb |
4875 |
3125 |
602 |
2736 |
524 |
2999 |
15517 |
|
Educational Institutions |
736 |
100 |
37 |
17 |
29 |
327 |
1336 |
|
Business and Industry |
786 |
3320 |
5479 |
2631 |
1766 |
9 |
16497 |
|
U.S. Government |
412 |
563 |
371 |
253 |
83 |
0 |
1846 |
|
FFRCa |
136 |
148 |
125 |
56 |
21 |
1 |
535 |
|
Nonprofit |
64 |
96 |
21 |
36 |
8 |
5 |
245 |
|
Totalb |
2213 |
4338 |
6227 |
3070 |
1907 |
463 |
21319 |
|
a Federally funded research center. b Total may exceed sum of entries because of provision for other minor categories. |
|||||||
TABLE 2.39 Median Basic Annual Salary of Ph.D. Materials Scientists by Age and Type of Employer (1968) ($1,000)
|
|
Educational Institution |
Business-Industry |
United States Government |
FFRC |
Non-Profit |
All |
Number |
|
25–29 |
9.1 |
14.6 |
11.9 |
13.8 |
14.0 |
12.0 |
1937 |
|
30–34 |
10.8 |
15.5 |
13.6 |
15.6 |
15.0 |
14.1 |
3526 |
|
35–39 |
12.6 |
17.2 |
16.4 |
17.8 |
16.8 |
16.1 |
3265 |
|
40–44 |
15.3 |
19.0 |
18.1 |
18.7 |
18.4 |
18.0 |
2470 |
|
45–49 |
17.1 |
20.0 |
19.2 |
20.1 |
19.5 |
19.3 |
1894 |
|
50–54 |
18.0 |
21.1 |
20.4 |
20.5 |
20.0 |
20.2 |
1109 |
|
55–59 |
18.1 |
20.8 |
20.2 |
20.2 |
|
19.8 |
672 |
|
60–64 |
17.6 |
20.3 |
21.5 |
|
|
19.8 |
431 |
|
65–69 |
18.0 |
20.2 |
18.2 |
|
|
18.8 |
155 |
|
Number |
5377 |
7774 |
905 |
917 |
239 |
15517 |
|
TABLE 2.39 Median Basic Annual Salary of Non-Ph.D. Materials Scientists by Age and Type of Employer (1968) ($1,000)
|
|
Educational Institution |
Business-Industry |
United States Government |
FFRC |
Non-Profit |
All |
Number |
|
Under 25 |
4.4 |
8.8 |
8.8 |
|
|
8.3 |
830 |
|
25–29 |
5.1 |
10.2 |
10.6 |
10.1 |
9.0 |
9.7 |
3862 |
|
30–34 |
8.6 |
11.8 |
12.5 |
11.8 |
11.5 |
11.7 |
3300 |
|
35–39 |
9.7 |
13.4 |
13.1 |
13.7 |
12.4 |
13.2 |
3041 |
|
40–44 |
11.2 |
14.4 |
13.9 |
15.0 |
13.8 |
14.3 |
3280 |
|
45–49 |
12.7 |
15.3 |
14.9 |
15.6 |
14.0 |
15.2 |
2924 |
|
50–54 |
11.9 |
15.9 |
15.0 |
15.2 |
16.7 |
15.6 |
2122 |
|
55–59 |
11.6 |
15.5 |
15.4 |
|
|
15.4 |
1190 |
|
60–64 |
13.0 |
15.6 |
14.9 |
|
|
15.1 |
576 |
|
65–69 |
14.0 |
14.2 |
|
|
|
14.2 |
109 |
|
Number |
1336 |
16497 |
1846 |
535 |
245 |
21319 |
|
TABLE 2.40 Number of Materials Scientists in Specialty Areas from 1964 to 1970
|
|
Register Years |
|||
|
Topical Group |
1964 |
1966 |
1968 |
1970 |
|
Minerals and Natural Materials |
327 |
376 |
503 |
468 |
|
Coatings |
1361 |
1322 |
1512 |
1404 |
|
Polymers |
7161 |
6908 |
8363 |
5478 |
|
Crystallography |
161 |
197 |
320 |
351 |
|
Catalysis |
401 |
666 |
800 |
590 |
|
Corrosion |
224 |
266 |
360 |
355 |
|
Solid State |
3379 |
3837 |
3750 |
5331 |
|
Total |
13014 |
13572 |
15609 |
13977 |
Total Number of Materials Scientists and Engineers
The above analysis has been directed toward characterization of materials scientists and engineers, that is, answering the question: Who are the materials scientists and engineers. A natural, related question is: How many are there? The answer to this question is, like the question of characterization, beclouded by the lack of unanimity as to who should be counted as a materials engineer or scientist. Further uncertainties in the total number are also introduced by the fact that the Registers on which our study is based only include a sample of the professions. In the case of scientists, it is reliably estimated that about 3/5 of all scientists are included in the Science Register so that reasonable estimates of total science population can be obtained by multiplying by a factor 5/3. Much greater uncertainty exists in the case of total engineers. It is estimated there are 1.0–1.2 million engineers in the U.S. 308,000 of these are included in the EJC list from which the sample for the Engineers Register was drawn. There is little basis, however, for assuming that these 308,000 are typical of the total population of engineers. The sample included in the Engineers Register consists of 44,000 engineers or 1/24 of the total number of engineers in the country so that the correct total number can be obtained by multiplying by 24, but it must be understood that serious distortions of the characteristics of engineers can be introduced by multiplication by this large factor.
Still another question that must be faced in connection with the Engineers Register concerns the ill-defined nature of many of the areas of science and technology that are presented to respondents to the Engineers Register. As mentioned earlier, the names of these areas do not always clearly indicate whether the respondent is a materials engineer or not, and it is necessary to make some estimate of the fraction of the materials engineers in the various areas, notably the large areas listed in Table 2.29. Obviously, this can only be done very crudely. The best estimate of COSMAT is that about 40 percent of the engineers in the EJC sample are materials engineers. Application of this 40 percent figure to the 1.1 million engineers in the country suggests a total of 450,000 materials engineers. We further estimate that 40,000 of the materials engineers are metallurgists and 10,000 are ceramists—leaving about 400,000 other materials engineers. These totals and totals for the materials scientists are presented in Table 2.41.
TABLE 2.41 Estimated Total Number of Materials Scientists and Engineers in the United States
|
Ceramists |
10,000 |
|
Metallurgists |
40,000 |
|
Other Engineers |
400,000* |
|
Physicists |
15,000 |
|
Chemists |
50,000 |
|
TOTAL |
515,000 |
|
* On a full-time equivalent basis, the 400,000 engineers shown here would be reduced to 200,000 approximately. The other figures in this table are already full-time equivalents, making the total MSE manpower in the U.S. equal to 315,000. |
|
ATTACHMENT 2A.1 Specialty Areas in the 1969 National Engineers Register with MSE Score Greater Than 45
|
Specialty Area |
MSE Score |
||
|
I. |
Metallurgical Group |
— |
|
|
|
1. |
Metallurgy, general |
100 |
|
|
2. |
Metallurgy, physical |
99 |
|
|
3. |
Metallurgy, powder |
98 |
|
|
4. |
Metallurgy, process |
92 |
|
|
5. |
Metallurgy, extractive |
82 |
|
|
6. |
Casting |
82 |
|
|
7. |
Welding |
74 |
|
|
8. |
Benefication, ore processing |
59 |
|
II. |
Chemical and Materials Group |
— |
|
|
|
1. |
Materials properties |
96 |
|
|
2. |
Crystals, crystallography |
94 |
|
|
3. |
Materials applications |
93 |
|
|
4. |
Corrosion |
90 |
|
|
5. |
Coating, plating, cladding |
79 |
|
|
6. |
Filament technology |
68 |
|
|
7. |
Thermochemistry |
68 |
|
|
8. |
Electrochemistry |
62 |
|
|
9. |
Fuel cells |
58 |
|
|
10. |
Chemical applications |
55 |
|
III. |
Heat, Light, and Applied Physics Group |
— |
|
|
|
1. |
Solid state |
87 |
|
|
2. |
Thermodynamics |
80 |
|
|
3. |
Insulation, thermal |
74 |
|
|
4. |
Thermophysics |
70 |
|
|
5. |
High temperature |
68 |
|
|
6. |
Physics |
65 |
|
|
7. |
Applied physics |
63 |
|
|
8. |
Cryogenics |
58 |
|
|
9. |
Ultrasonics |
53 |
|
|
10. |
Heat transfer |
51 |
|
Specialty Area |
MSE Score |
||
|
IV. |
Engineering Process and Application Group |
— |
|
|
|
1. |
Forming, shaping |
76 |
|
|
2. |
Fastening, joining |
70 |
|
|
3. |
Materials handling |
62 |
|
|
4. |
Refining |
57 |
|
|
5. |
Processes |
45 |
|
V. |
Work Management and Evaluation Group |
— |
|
|
|
1. |
Nondestructive tests |
70 |
|
|
2. |
Testing, laboratory |
61 |
|
|
3. |
Radiography, x-rays |
54 |
|
|
4. |
Specifications, standards |
49 |
|
|
5. |
Product engineering |
43* |
|
|
6. |
Production methods |
43* |
|
|
7. |
Quality control |
41* |
|
VI. |
Dynamics and Mechanics Group |
— |
|
|
|
1. |
Friction |
75 |
|
|
2. |
High pressure |
66 |
|
|
3. |
Lubrication |
60 |
|
|
4. |
Vacuum technology |
57 |
|
|
5. |
Kinetics |
54 |
|
|
6. |
Mechanical applications |
54 |
|
|
7. |
Mechanics |
51 |
|
|
8. |
Mass transfer |
49 |
|
|
9. |
Propulsion |
49 |
|
VII. |
Electromagnetic Group |
— |
|
|
|
1. |
Dielectrics |
79 |
|
|
2. |
Magnetics, magnetism |
74 |
|
|
3. |
Insulation, electrical |
73 |
|
|
4. |
Superconductivity |
72 |
|
|
5. |
Photoelectricity |
52 |
|
|
6. |
Electronic applications |
51 |
|
|
7. |
Electrical applications |
43* |
|
* These specialties were regarded as sufficiently important to be included even though their MSE scores were somewhat below 45. |
|||
ATTACHMENT 2A.2 Specialty Areas in the 1968 National Register of Scientific and Technical Personnel with MSE Score Greater Than 45
|
Specialty Area |
MSE Score |
|||
|
I. |
Atmospheric, Earth, Marine, and Space Sciences |
— |
||
|
|
A. |
Geochemistry |
||
|
|
|
1. |
Mineral synthesis and stability relations of minerals |
66 |
|
|
B. |
Geology |
||
|
|
|
1. |
Mineralogy and crystallography |
77 |
|
|
C. |
Solid-Earth Geophysics |
||
|
|
|
1. |
Physical properties of natural materials |
77 |
|
II. |
Chemistry |
— |
||
|
|
A. |
Analytical |
||
|
|
|
1. |
Electron microscopy |
91 |
|
|
|
2. |
Mass spectroscopy |
77 |
|
|
|
3. |
Fluorimetry, phosphor imetry, and infrared and Raman spectroscopy |
74 |
|
|
|
4. |
Magnetic resonance spectroscopy |
74 |
|
|
|
5. |
Electrochemical analysis |
67 |
|
|
|
6. |
Spectrochemical analysis |
66 |
|
|
|
7. |
Absorption spectroscopy |
64 |
|
|
|
8. |
Microchemical analysis |
64 |
|
|
|
9. |
Neutron activation |
63 |
|
|
|
10. |
Chemical microscopy |
61 |
|
|
|
11. |
Chromatography |
58 |
|
|
|
12. |
Extraction analysis |
50 |
|
|
|
13. |
Nucleonics and radiochemistry |
49 |
|
|
B. |
Inorganic |
— |
|
|
|
|
1. |
Inorganic materials useful as solid-state electronic devices, semiconductors, etc. |
99 |
|
|
|
2. |
Structure of inorganic compounds, crystallography, spectroscopy, etc . |
94 |
|
|
|
3. |
Inorganic polymers |
91 |
|
|
|
4. |
Synthesis of inorganic materials |
91 |
|
|
|
5. |
Boron and silicon compounds; asbestos, clay, glass, etc. |
89 |
|
Specialty Area |
MSE Score |
|||
|
|
|
6. |
Equilibrium and thermo dynamic relationships in inorganic systems |
89 |
|
|
|
7. |
Theoretical inorganic chemistry, ligand field theory, molecular orbital theory, ionic model, theory of metals, etc. |
82 |
|
|
|
8. |
Electropositive elements and their compounds (alkalies and alkaline earths, building products, etc.) |
80 |
|
|
|
9. |
Mechanisms of inorganic reactions; reaction kinetics |
79 |
|
|
|
10. |
Transition elements |
79 |
|
|
|
11. |
Inner transition elements |
70 |
|
|
|
12. |
Coordination compounds |
68 |
|
|
|
13. |
Electron deficient compounds; boron hydrides, metal alkyles, etc. |
64 |
|
|
|
14. |
Organometallic compounds |
60 |
|
|
|
15. |
Nonmetals; halogen, oxygen, and nitrogen families; high-energy oxidizers |
53 |
|
|
|
16. |
Nuclear chemistry and radio chemistry |
52 |
|
|
|
17. |
Hydrogen and hydrides, high-energy fuels |
50 |
|
|
C. |
Organic |
— |
|
|
|
|
1. |
Polymers |
92 |
|
|
|
2. |
Protective coatings |
88 |
|
|
|
3. |
Plastics and synthetic resins |
85 |
|
|
|
4. |
Rubber |
85 |
|
|
|
5. |
Elastomers and related products |
80 |
|
|
|
6. |
Wood, paper, cellulose |
74 |
|
|
|
7. |
Adhesives |
72 |
|
|
|
8. |
Cellular plastics |
71 |
|
|
|
9. |
Nuclear magnetic resonance |
68 |
|
|
|
10. |
Transition and noble metals in synthesis, catalysis, etc. |
65 |
|
|
|
11. |
Mass spectroscopy |
63 |
|
|
|
12. |
Reaction mechanisms, additions, eliminations, substitutions |
63 |
|
|
|
13. |
Organometallics; boron, aluminum, tin, lead, etc. |
61 |
|
|
|
14. |
Reaction mechanisms; rearrangements |
61 |
|
|
|
15. |
Textiles and related products |
57 |
|
|
|
16. |
Structure of organic molecules |
55 |
|
Specialty Area |
MSE Score |
|||
|
|
|
17. |
Organometallics; alkali and alkaline earth derivatives |
52 |
|
|
|
18. |
Fluorine compounds |
50 |
|
|
|
19. |
Organosilicon chemistry |
45 |
|
|
D. |
Physical |
— |
|
|
|
|
1. |
Crystallography |
98 |
|
|
|
2. |
Polymers in bulk; morphology, phase transitions, rheology, and mechanical properties |
95 |
|
|
|
3. |
Solid-state chemistry |
91 |
|
|
|
4. |
Chemical and phase equilibria |
88 |
|
|
|
5. |
Thermodynamics and thermochemistry |
85 |
|
|
|
6. |
Catalysis and surface chemistry |
83 |
|
|
|
7. |
Electrochemistry |
82 |
|
|
|
8. |
High-temperature chemistry |
82 |
|
|
|
9. |
Molecular structure |
78 |
|
|
|
10. |
Energy transfer and relaxation processes |
74 |
|
|
|
11. |
Quantum and valence theory |
72 |
|
|
|
12. |
Statistical mechanics |
71 |
|
|
|
13. |
Fused salts |
69 |
|
|
|
14. |
Chemical kinetics; liquid phase |
61 |
|
|
|
15. |
Colloid chemistry |
60 |
|
|
|
16. |
Liquid state and solutions; electrolytes and non-electrolytes |
59 |
|
|
|
17. |
Molecular spectroscopy |
58 |
|
|
|
18. |
Ion exchange and membrane phenomena |
57 |
|
|
|
19. |
Nuclear and radiochemistry |
57 |
|
|
E. |
Others in Related Chemical Specialties |
— |
|
|
|
|
1. |
Materials |
100 |
|
|
|
2. |
Metallurgy |
100 |
|
|
|
3. |
Corrosion and preservation |
87 |
|
|
|
4. |
Adsorption and absorption |
65 |
|
|
|
5. |
Electrochemical operations |
64 |
|
|
|
6. |
Mass transfer |
58 |
|
|
|
7. |
Mechanical separation |
55 |
|
|
|
8. |
Instrumentation |
54 |
|
|
|
9. |
Measurement and control |
53 |
|
|
|
10. |
Quality control and standards |
51 |
|
|
|
11. |
Chemical separation |
49 |
|
Specialty Area |
MSE Score |
|||
|
|
|
12. |
Heat transfer |
49 |
|
|
|
13. |
Mixing |
48 |
|
III. |
Physics |
— |
||
|
|
A. |
Acoustics |
||
|
|
|
1. |
Mechanical vibrations and shock |
56 |
|
|
B. |
Atomic and Molecular Physics |
— |
|
|
|
|
1. |
Chemical bonds and structure |
88 |
|
|
|
2. |
Electron paramagnetic resonance |
74 |
|
|
|
3. |
Molecular structure and spectra |
72 |
|
|
|
4. |
Nuclear magnetic resonance |
70 |
|
|
|
5. |
Mass spectroscopy |
63 |
|
|
|
6. |
Atomic structure and spectra |
62 |
|
|
|
7. |
Impact and scattering phenomena |
51 |
|
|
|
8. |
Atomic, ionic, and molecular beams |
46 |
|
|
C. |
Electromagnetism |
— |
|
|
|
|
1. |
Electron microscopy, ion optics |
81 |
|
|
|
2. |
Magnetism |
81 |
|
|
|
3. |
X-ray phenomena |
72 |
|
|
|
4. |
X-ray technology |
72 |
|
|
|
5. |
X-ray interactions |
65 |
|
|
|
6. |
Physical electronics |
51 |
|
|
|
7. |
Quantum electronics |
61 |
|
|
|
8. |
Masers and such devices |
59 |
|
|
D. |
Electronics |
— |
|
|
|
|
1. |
Semiconductor devices |
47 |
|
|
|
2. |
Solid-state electronics |
47 |
|
|
E. |
Mechanics |
— |
|
|
|
|
1. |
Elasticity |
87 |
|
|
|
2. |
Friction |
81 |
|
|
|
3. |
High-pressure physics |
76 |
|
|
|
4. |
Impact phenomena |
69 |
|
|
|
5. |
Instruments and measurements |
60 |
|
Specialty Area |
MSE Score |
|||
|
|
F. |
Nuclear |
— |
|
|
|
|
1. |
Radiation effects |
63 |
|
|
|
2. |
Radioactive materials, isotopes |
52 |
|
|
G. |
Optics |
— |
|
|
|
|
1. |
Properties of thin films |
92 |
|
|
|
2. |
Optical materials |
83 |
|
|
|
3. |
Spectroscopy |
68 |
|
|
|
4. |
Lasers |
65 |
|
|
|
5. |
Infrared phenomena |
54 |
|
|
|
6. |
Fiber optics |
51 |
|
|
H. |
Fluids |
— |
|
|
|
|
1. |
Rheology (including plastic flow) |
89 |
|
|
|
2. |
Transport phenomena, diffusion |
75 |
|
|
|
3. |
Structure and properties of fluids |
61 |
|
|
|
4. |
Viscosity |
52 |
|
|
I. |
Solid State |
— |
|
|
|
|
1. |
Ceramics |
100 |
|
|
|
2. |
High polymers and glasses |
99 |
|
|
|
3. |
Dislocations and plasticity |
98 |
|
|
|
4. |
Semiconductors |
96 |
|
|
|
5. |
Cooperative phenomena |
94 |
|
|
|
6. |
Thin films |
94 |
|
|
|
7. |
Electrical properties of surfaces and junctions |
92 |
|
|
|
8. |
Lattice effects and diffusion |
92 |
|
|
|
9. |
Dielectrics (including fluids) |
91 |
|
|
|
10. |
Dynamics of crystal lattices |
91 |
|
|
|
11. |
Ferromagnetism |
91 |
|
|
|
12. |
Internal friction |
89 |
|
|
|
13. |
Optical properties |
88 |
|
|
|
14. |
Piezoelectricity and ferroelectricity |
88 |
|
|
|
15. |
Surface structure and kinetics |
88 |
|
|
|
16. |
Thermal conduction in solid state |
87 |
|
|
|
17. |
Paramagnetism and diamagnetism |
86 |
|
|
|
18. |
Quantum mechanics of solids |
84 |
|
|
|
19. |
Radiation damage |
84 |
|
Specialty Area |
MSE Score |
|||
|
|
|
20. |
Luminescence |
82 |
|
|
|
21. |
Superconductivity |
82 |
|
|
|
22. |
Photoconductivity and related phenomena |
81 |
|
|
|
23. |
Electron emission |
80 |
|
|
|
24. |
Photoelectric phenomena |
80 |
|
|
|
25. |
Resonance phenomena |
80 |
|
|
J. |
Thermal |
— |
|
|
|
|
1. |
Thermodynamics |
82 |
|
|
|
2. |
Thermal properties |
82 |
|
|
|
3. |
Thermodynamic relations, equations of state |
79 |
|
|
|
4. |
High-temperature physics |
69 |
|
|
|
5. |
Thermodynamic tables |
67 |
|
|
|
6. |
Low-temperature physics |
66 |
|
|
|
7. |
Calorimetry |
66 |
|
|
|
8. |
Heat transmission |
61 |
|
|
|
9. |
Temperature and its measurement |
55 |
|
|
K. |
Other Physics Specialties |
— |
|
|
|
|
1. |
Physical metallurgy |
100 |
|
|
|
2. |
Physical properties of materials |
100 |
|
|
|
3. |
Quantum mechanics |
61 |
|
|
|
4. |
Mössbauer effect |
60 |
|
|
|
5. |
Statistical mechanics |
60 |
|
|
|
6. |
High-vacuum techniques |
59 |
|
|
|
7. |
Constants, standards, units, metrology, conversion factors |
58 |
|
|
|
8. |
Energy-conversion problems |
54 |
|
|
|
9. |
Kinetic theory |
50 |


