
5
Geographic Data for Sustainable Development I: Framework Data
INTRODUCTION
This chapter examines sources of framework geographic data, their characteristics, and their adequacy for existing and potential Agenda 21 applications. Their availability and cost to users in developing countries, and the ease with which they can be updated (including the likely continuity of the data source) are considerations for the adequacy of these data.
The chapter begins by recognizing the benefits of preserving Africa’s historical legacy data (e.g., maps, aerial photographs, and reports), which can serve as baseline information for measuring environmental change. The remainder of the chapter describes sources of the four framework foundation data layers (Figure 4-1).
-
Geodetic control (including geographic location and elevation);
-
Digital ortho-imagery;
-
Digital elevation and bathymetry; and
-
Human population distribution,
and the four framework thematic data layers:
-
Hydrology;
-
Government units;
-
Transportation networks; and
-
Cadastral information.
Much of the technical information on data sources in Chapter 5 is found in Annex 5.
HISTORICAL LEGACY DATA AS A BASELINE FOR DOCUMENTING CHANGE
The earliest baseline against which future change can be compared often comes from historical legacy data (Box 5-1). In many instances legacy data may be digitized, placed in a GIS, and analyzed in conjunction with more recent geographic data, such as satellite remotely-sensed data. The time scales over which change can be detected are extended through use of legacy data. A better understanding of environmental changes1 and what could be done to ameliorate problems is gained through comparison of these data with modern records. Maps created in the 1960s and 1970s may be less accurate and offer less complete coverage than those made today, but they can provide the baseline for geodetic control, elevation, and feature recognition. Legacy maps contain place names and provide valuable insights on ethnicity and population growth. In addition, information on natural resources and socioeconomic history come from legacy data in the form of oral traditions.
In Africa legacy data come from three periods: pre-colonial, colonial, and post-colonial. Information from the precolonial period is mostly derived from oral traditions, and this is still disseminated by traditional chiefs, elders, and other leaders.2 Additionally, pre-colonial information on the state of the environment through time is contained in documents held by nomadic families (Box 5-1).
During the colonial period, from the mid-eighteenth century until independence in the twentieth century, numerous maps, diaries, travelogs, and descriptive texts were prepared by explorers such as Mungo Park, Stanley, Livingstone, Cameron, Speke, Emin Pasha, Teleki and Du Chaillu (Murray, 1993). After about 1900 the physical and social geography of Africa, as well as its cultural, ethnic, and lin-
|
BOX 5-1
|
guistic context, was described by European3 and African4 authors in a more formal, scientific manner to support European competition for economic hegemony. Often forgotten or lost in African countries, these monographs and reports reside in Europe and elsewhere.5
During the post-colonial period from about 1960 remote-sensing techniques including aerial photography were used to produce maps at 1:200,000-scale for the Francophone and Lusophone countries and 1:250,000 for Anglophone countries.6 Unfortunately, legacy data were lost during this period, and work conducted in Africa did build incompletely on the legacy of previous studies and the knowledge of African societies.
Traditionally, African populations, who know a great deal about their environments, have improved their lifestyles, managed their land, and coped with adversity such as drought. Bridges between local knowledge and modern technology are built through the use of legacy data. For example, modern geographic information technologies are of little use in development unless local participants use them to support local activities. If farmers, herders, scientists, and other decision-makers see how the latest technology can benefit their culture, their willingness to learn about and accept such technology can likely be increased through integration of legacy data.
Unfortunately, knowledge is being discarded as new technologies and methods are introduced in Africa. This loss compromises efforts to address Agenda 21 issues. For example, unaware of the existence of indigenous (Hawsa) maps (Donaint, 1975), donors have not integrated them into their new maps. Consequently, villagers, who are convinced that donors must know best, consider the traditional maps irrelevant. Similarly, children who attend European-style schools in Niger are not taught traditional information on climate and weather. In Mauritania the younger generation of the Maraboutic clans is unaware of the existence of documents describing hundreds of years of their family histories hidden in trunks and libraries. Scientists and NGOs also neglect legacy data. The committee found that the majority of references in recent reports from the World Bank, USAID, and CGIAR group on environment, sustainability, development, and even agriculture, botany, and ethnology postdated 1990.
Efforts are underway to preserve legacy data and ensure that they are used. For example, the Institut Français de la Recherche Scientifique et Technique pour le Development en Cooperation maintains a high profile in protecting and using legacy data through its offices and scientists in French West Africa. Its maps, reports, aerial photographs, and statistical data provide coverage for over 35 percent of Africa. Regional institutes such as Institut Fondamental de l’Afrique Noire in Dakar, Senegal, and the University of Ibadan in Nigeria also have a wealth of environmental and sociological information. Lastly, the DEVECOL database (DEVECOL, 2002) contains results from development initiatives from the past 15 to 20 years in sub-Saharan Africa. In addition to information about soils and climate, the compact-disk-based database documents development experiences in agriculture, soil and water conservation, forestry, biodiversity conservation, drought response, and other rural initiatives.
To complement these efforts to preserve and enhance the use of valuable legacy data, U.S. government agencies (e.g., USAID and USGS) should assist African countries and organizations to identify, integrate, and maintain existing sources of information (legacy data). They should also provide African countries with copies of such legacy data as reports, maps, statistics, aerial and satellite photographs, and other relevant data and materials currently held outside those countries. The first task would be substantial, whereas the second would be more routine once the first is addressed.
FRAMEWORK FOUNDATION GEOGRAPHIC DATA FROM MODERN SOURCES
Four framework foundation layers of geographic data are fundamental to at least 20 Agenda 21 issues (Table 2-5): geodetic control, digital elevation, digital ortho-imagery, and human population distribution.
Framework Foundation Layer No.1: Geodetic Control
Geodetic control provides the common coordinate system to which all geographic data are linked. It is used to locate objects and features in terms of their geographic position.7 Geodetic control can be measured with traditional in situ surveying instruments but this is time-consuming, expensive, and often difficult. One solution is to use a constellation of global positioning satellites. Few nations have the financial and technical resources to launch and maintain such a constellation, much less disseminate the geographic positioning information freely. However, the U.S. Navigation Satellite Timing And Ranging (NAVSTAR)8 Global Positioning System (GPS) fulfills these goals. Relatively inexpensive,9 GPS can be used worldwide in a range of applications (Box 5-2). Accurate positioning information, previously impossible for some countries to obtain and difficult to obtain from paper maps that are commonly at 1:50,000 scale or smaller (e.g., Taylor, 1997) can now be collected with a simple hand-held device. Thus, practitioners, scientists, and the general public now have unprecedented access to location information.
The Global Positioning System
The NAVSTAR GPS (Table 5-1; Annex Box 5-1) consists of 24 GPS satellites operated by the U.S. Department of Defense (Parkinson, 1994) (Figure 5-1). At least four satellites are visible at any unobstructed location10 on the surface of Earth at any time of day. A person with a hand-held GPS receiver may obtain geographic information for any location to within a few centimeters or meters if several conditions are met (Annex Box 5-1).
Because NAVSTAR was initially developed for military use, it is possible for the U.S. government to selectively restrict access to the system, or to adjust the precision of the measurements by introducing a bias, often referred to as “selective availability.” Fortunately, selective availability was turned off on May 1, 2000, allowing users worldwide to obtain GPS positioning information without intentional degradation of the information. This situation could change in response to unforeseen events (e.g., war or terrorist activities). The horizontal accuracy of absolute GPS positioning (see Annex Box 5-1) was about 100 m when selective availability was on. Without selective availability the accuracy improved to 5-15 m.
TABLE 5-1 Characteristics of the NAVSTAR Global Positioning System of Particular Significance for Developing Countries
|
• Geographic positioning accuracy from meters down to centimeters. • Geographic information is provided in 3 dimensions (latitude, longitude, and elevation). • Signals are available to people anywhere on Earth (air, land, or sea) without discrimination. • Signals are available free of charge to anyone. However, the user must possess a GPS receiver. GPS receiver costs continue to decline. • Available 24 hours a day, 7 days a week. • It is an all-weather system not affected by clouds (however, intense rain or thick vegetation canopy can reduce its effectiveness). • Geographic coordinates are tied to a single global geodetic datum. • No inter-station visibility is required for precise positioning. This means that it is not necessary for a surveyor to use a theodolite to view a distant stadia rod. • Geographic position can be determined rapidly (in seconds to minutes). |
|
SOURCE: Adapted from Rizos (2002). |
GPS information is broadcast worldwide to virtually anyone in any country and is of great importance to the practical collection and use of fundamental geographic data for Agenda 21-related initiatives. Its utility should not be reduced by reintroducing selective availability, and its continuity should be guaranteed. The U.S. Department of Defense should continue to allow free access to Global Positioning System data.
In March 2002 European leaders announced that they were pushing ahead with the ambitious and sometimes controversial Galileo satellite positioning system. As proposed, the system will comprise 30 satellites in orbit by 2007 and will provide a position and time service that both complements and competes with the U.S.’s GPS constellation. Galileo will be the third global navigation satellite system, joining Russia’s GLONASS (Global Orbiting Navigation Satellite System) and the U.S. Global Positioning System
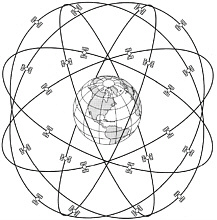
FIGURE 5-1 The NAVSTAR GPS consists of a constellation of 24 GPS satellites located at approximately 20,200 km above Earth’s surface. SOURCE: Courtesy of Rizos (2002).
(Barnes, 2002). Users in Europe, North America, and around the world will benefit if Galileo is designed and built so that it is interoperable with GPS.
Framework Foundation Layer No.2: Ortho-imagery
An ortho-image is prepared from an aerial photograph or remotely sensed image. It has the metric qualities of a traditional line map with the rich detail of an aerial image.11 Com-
|
BOX 5-2 GPS has a number of applications, including
The Save the Elephants project operates in many African countries and relies on GPS to track the movements of elephants (ESRI, 2002). The project goals are to assist wildlife departments in combating poaching, educating people globally about elephants, and learning more about elephant behavior. An elephant’s position is tracked using a collar with a GPS receiver. Its location is recorded every one to three hours and collected every few months by flying over the elephant and downloading the data onto a laptop computer. The travel patterns of the elephant are subsequently mapped using a GIS. The fine detail afforded by the GPS data allows researchers to learn about decisions made by elephants on their needs for food, water, and safety. Safe corridors for elephant travel are determined with this information, and human and ecological factors are weighed by wildlife managers to reduce conflicts between humans and elephants. |
monly in developed countries, ortho-images are obtained from high spatial resolution (Annex Box 5-2) aerial photography.12 Ortho-images can also be produced from high spatial resolution satellite imagery such as DigitalGlobe panchromatic13 data (61 × 61 cm). High spatial resolution aerial photography or satellite imagery is expensive, however, and therefore often impractical for users in developing countries. The Landsat Thematic Mapper Global GeoCover-Ortho database is a valuable alternative for users in developing countries.
Landsat Global Database
The Global GeoCover-Ortho database is a color orthoimage database with a spatial resolution of 30 × 30 m covering the majority of Earth’s landmass. In addition to being a data source for assessing global land cover and modeling global climate change, it can be a base map for natural resource managers and development planners in the developing world.
The database originated from a 1998 contract between NASA and Earth Satellite Corporation (EarthSat) as part of the NASA Scientific Data Buy program (Box 5-3). The majority of the data was acquired by the Landsat Thematic Mapper (TM) remote-sensing system (Annex Box 5-3). Consequently, the GeoCover-Ortho images are the most accurate commercially available satellite-derived base maps of the world. With a positional accuracy of less than 50 m (root mean square error), they are more accurate than most of the world’s 1:200,000-scale maps. Furthermore, owing to the nature of the original contract set up by NASA, this imagery is more economically accessible for developing countries. It is a comprehensive global data set with image dates ranging from 1987 to 1993 (Annex Box 5-4), and is uniquely suited to establishing a worldwide environmental baseline. Additional Landsat TM images (and many other types of remotely sensed data) can be overlaid on the GeoCover-Ortho imagery for purposes of change detection.
Three types of GeoCover-Ortho products are available from EarthSat (<http://www.earthsat.com>) individual images (e.g., Figure 5-2), mosaics, and regional mosaics (e.g., Figure 5-3) (Annex Table 5-1).
Earth Satellite, Inc., is using imagery collected during the GeoCover-Ortho project to map and classify global landcover change over a decade using the 1990 dataset in comparison with a 2000 data set (Chapter 6).
Framework Foundation Layer No.3: Digital Elevation and Bathymetry
Elevation data (often referred to generically as topographic data) provide information about terrain. These data are used in many different applications (Table 5-2). Unfortunately, owing to the inaccessibility of many of Earth’s mountain chains, deserts, and forests, elevation information about such areas can be inaccurate, of limited extent, or nonexistent. Even where access is practical, traditional surveying methods are expensive. Furthermore, neighboring countries may use differing data-collection methods that cause data discontinuities at borders, whereas natural resources (e.g., rivers) often cross these borders. To address these challenges the United States has partnered with a number of countries and organizations to produce two digital elevation datasets: the GTOPO30 (Global Topography at 30 arc seconds)
|
BOX 5-3 In 1997 the U.S. Congress allocated $50 million to NASA for the Scientific Data Buy, a demonstration program encouraging NASA to purchase remotely-sensed data from the private sector. NASA’s John C. Stennis Space Center in Mississippi administered the program. NASA established partnerships with six companies (AstroVision; DigitalGlobe; EarthSat; EarthWatch, Inc. [now DigitalGlobe]; Positive Systems, Inc.; and Space Imaging) to participate in the Scientific Data Buy. Four research themes addressed with data from these companies include land-cover and land-use change; seasonal-to-interannual climate variability; natural hazards; and long-term climate change (NASA, 2002). Data are made available to NASA-funded scientists through a competitive selection process. The Scientific Data Buy program exemplifies the changes under way in the existing relationship among U.S. federal science agencies, the private sector in the form of the commercial remote-sensing industry, and both scientific and applied users of remotely-sensed data (NRC, 2001). A forthcoming NRC report (Toward New Remote Sensing Partnerships: Government, the Private Sector, and Earth Science Research [in editing]) examines the issues of institutional relationships between the government, industry, and the research community for remote-sensing. SOURCE: NRC (2001), NASA (2002). |
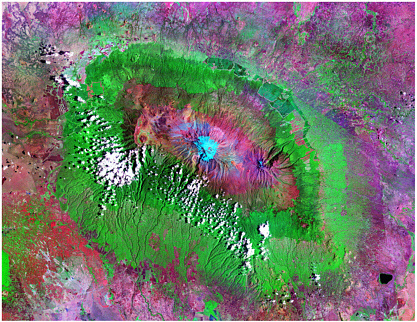
FIGURE 5-2 A GeoCover-Ortho image of Mount Kilimanjaro originally obtained at 30 × 30 m spatial resolution. It has a positional accuracy of better than 50 m (root mean square error). Landsat TM bands 7,4,2 (mid-infrared, near-infrared, and green) are displayed (courtesy of Earth Satellite Corporation). The width of the depicted area is 110 km. Each color or shade is unique and depends on the vegetation type, health, and growth stage. The bright greens are dense vegetation. The hot reds in the bottom left section are crops. The purples and pinks are sparse to no vegetation. The bottom third center of the image along Mount Kilimanjaro’s lower slopes contains areas of clear cuts (in pinks) surrounded by uncut verdant forest (bright greens). The top of the mountain is snow-covered and the white areas are clouds.
dataset, and the 2000 Shuttle Radar Topography Mission (SRTM) dataset. The GTOPO30 dataset is a global digital elevation dataset, and the SRTM dataset covers 80 percent of the global land mass.
Global Topography at 1 × 1 km Spatial Resolution
The GTOPO30 global digital elevation data set (Figure 54) has a spatial resolution of approximately 1 × 1 km (Gesch et al., 1999; GTOPO30, 2002). Completed in 1996, it was developed through a collaboration led by the U.S. Geological Survey’s EROS Data Center.14 Diverse sources of topographic information were used to produce the GTOPO30 data set (Figure 5-5). GTOPO30 data for Africa were derived manually by converting topographic information from the Digital Chart of the World (USGS, 2002a) into digital format and supplementing this with digital elevation data.
A version of the GTOPO30 data set for Africa was released as part of the Global GIS Database: Digital Atlas of Africa in 2001 by the U.S. Geological Survey. It is available on a single compact disk at a cost of about U.S.$10 (USGS, 2002b). The database is viewed using ESRI’s ArcView Data Publisher software, also on the same compact disk (Hearn et al., 2001).
Although the GTOPO30 dataset offers global coverage, it is of limited value in Africa and most other developing countries for monitoring ecosystems, urban and rural infrastructure, and hydrology because of its coarse resolution.
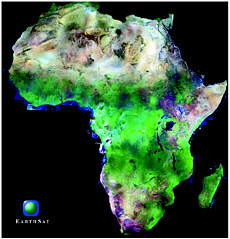
FIGURE 5-3 A GeoCover-Ortho regional mosaic of hundreds of Landsat Thematic Mapper images of Africa obtained between 1987 and 1993 at the height of the growing seasons and with very little cloud cover. TM bands 7,4,2 are displayed. Individual images used to produce this mosaic represent the most accurate satellite imagery available for the entire continent of Africa (courtesy of Earth Satellite Corporation.). The distance (parallel to the Equator) from the tip of Horn of Africa to the west coast off Guinea-Bissau is 7,350 km.
TABLE 5-2 Examples of Users and Applications of Elevation Data
|
Occupation |
Uses of Elevation Data |
|
Natural resource managers |
Monitoring and management of soil erosion and biodiversity; deduction of soil type, or likely occurrence of floral and faunal habitats (from slope and aspect information). |
|
Urban/rural planners |
Determining suitable locations for structures, transportation networks, wetland protection, and other land-use planning. |
|
Pilots |
Flight planning and navigation. |
|
Engineers / hydrologists |
Designing safe and efficient hydrologic projects such as dams and levees and to mitigate problems due to flooding. |
|
Geologists |
Mitigating landslide and earthquake hazards; volcano monitoring. |
|
Communications |
Optimizing location of transmitters through knowledge of height and location of natural and human-made obstacles. |
|
Military |
Planning and simulations during training and real-time operations. |
|
Tourism |
Navigation. |
Global Topography at 90 × 90 m Spatial Resolution (or Better)
The SRTM data set is superior to GTOPO30 because of its higher spatial resolution15 and in its uniform origin.16 Because the dataset is from a homogeneous source referenced to a uniform global geodetic datum, users will be working from a common reference frame.
The SRTM data-gathering mission (Box 5-4) was an international project involving the U.S. National Imagery and Mapping Agency (NIMA), NASA, the German Aerospace Center (Deutsches Zentrum für Luft und Raumfart), and the Italian Space Agency (Agenzia Spaziale Italiana), and is managed for NASA by the Jet Propulsion Laboratory, California Institute of Technology. The objective of the mission was to obtain elevation data at 30 × 30 m spatial resolution with a near global coverage and generate the most complete high-resolution digital topographic database of Earth.17 The mission collected data from over 80 percent of Earth’s landmass, home to nearly 95 percent of the world’s population (Figure 5-7). The increased topographic detail of SRTM data over GTOPO30 data is apparent in Figures 5-8 and 5-9, which show data for the Mount Kilimanjaro area in Tanzania and Kenya.
The raw SRTM data are being processed into a digital elevation model by NASA’s Jet Propulsion Laboratory (An-
|
BOX 5-4 During its 11-day mission the SRTM acquired enough data to produce the most accurate, homogeneous, detailed, and complete digital elevation model of Earth’s land surface ever constructed. Surface elevation is calculated using radar interferometry, wherein differences are compared between two radar images taken from slightly different locations (see Figure 5-6) (SRTM, 2002b). Radar is an excellent sensor for measuring topography because it can operate both day and night and it is unaffected by clouds. Radar interferometry yields accurate topographic data unless the vegetation canopy is extremely dense, in which case the elevation values may be biased toward the canopy height rather than the actual terrain elevation. |
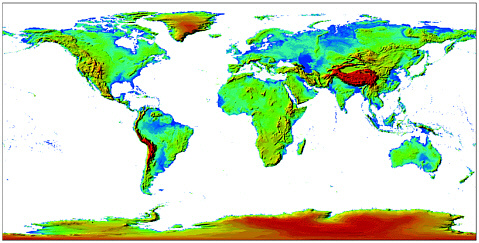
FIGURE 5-4 Global elevation data contained in the GTOPO30 digital elevation dataset. The spatial resolution is 1 × 1 km (U.S. Geological Survey EROS Data Center). The dataset covers the entire globe.
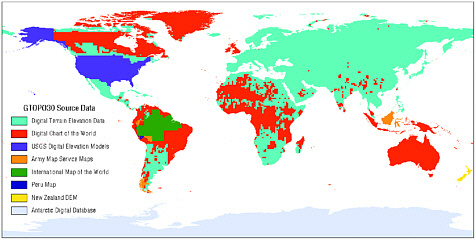
FIGURE 5-5 Sources of topographic information used in the production of the global GTOPO30 digital elevation dataset. A tremendous variety of sources, both traditional maps and digital elevation data, were used. Much of the data for Africa was derived by digitizing information from the Digital Chart of the World (1:1,000,000-scale), which does not contain very detailed topographic information (U.S. Geological Survey EROS Data Center).

FIGURE 5-6 Artist’s rendition of the SRTM 60-m (200-ft) mast being deployed from the space shuttle Endeavor (courtesy NASA Jet Propulsion Laboratory). Radar images are collected from the end of the mast and from the shuttle payload bay.
nex Box 5-5) (SRTM, 2002a), and the products can be tailored to meet the needs of civil, scientific, and military users. In the current plan, which is not finalized, SRTM data will be released at 30 × 30 m spatial resolution for the United States and at 90 × 90 m spatial resolution for the rest of the world. NASA should produce digital elevation data from the SRTM at the highest possible spatial resolution (e.g., 30 × 30 m) for all areas. The data should be made available without restriction and at affordable cost. NASA should also provide the synthetic aperture radar orthoimage mosaics at 30 × 30 m spatial resolution that are being produced as part of the processing. These mosaics would provide additional information about land-cover conditions and surface roughness characteristics especially in tropical regions perennially shrouded by cloud cover.
Framework Foundation Layer No.4: Human Population Distribution Information
National census data provide the foundation for measuring population distribution and change at the national to lo-
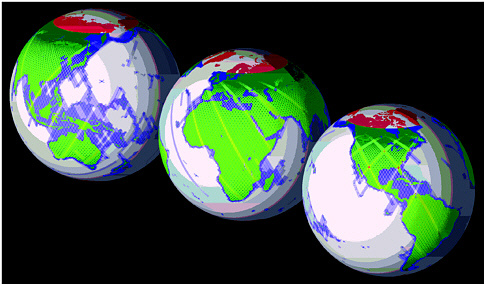
FIGURE 5-7 Global coverage map of Shuttle Radar Topography Mission data collection. Most of the covered area is between latitudes of 60 degrees north and 56 degrees south. Data were mostly acquired over land (indicated in shades of green), with small amounts of data collected over the water for calibration purposes (shades of blue). Of the mapped area, 99.97 percent was covered once (green), 94.59 percent was covered twice (yellow-green), 49.25 percent was covered three times, and 24.10 percent was covered four times. Areas in red could not be mapped because of time constraints (50,000 km2 was not covered, all within the United States) (courtesy NASA Jet Propulsion Laboratory).
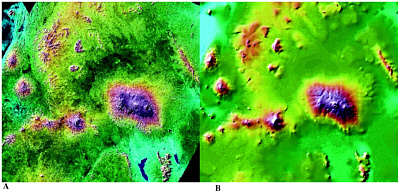
FIGURE 5-8 (a) SRTM 30 × 30 m digital elevation model of the area centered on Mount Kilimanjaro in Tanzania and Kenya. (b) GTOPO30 1 × 1 km data of the same region. GTOPO30 data fail to identify major lakes in the region (NASA Jet Propulsion Laboratory and U.S. Geological Survey EROS Data Center). The distance between the two peaks is 70 km.
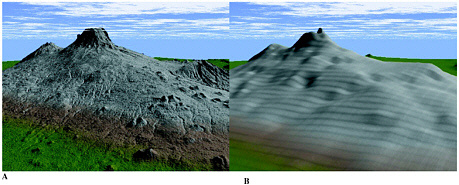
FIGURE 5-9 (a) SRTM 30 × 30 m digital elevation model of Mount Kilimanjaro in Tanzania and Kenya observed from an oblique vantage point looking W-NW. Note the detail associated with the small cinder cones on the flank of the mountain. (b) GTOPO30 1 × 1 km data of the same region (NASA Jet Propulsion Laboratory and U.S. Geological Survey EROS Data Center). The distance between the two peaks is 70 km.
cal levels (Liverman et al., 1998). The strengths of human population censuses arise from their completeness of coverage; continuity of statistics from census to census; and the detail that each census provides about population sub-groups in local areas. In the current worldwide development arena such key issues as good governance, anti-poverty strategies, and the need to promote economic growth with social equity all require population and other demographic18 data at the detailed local scale that only a population census can provide. Moreover, there exists an increasing demand for disaggregated data at the sub-national level. Data gaps are inevitable without a recent census. Without a recent census, surveys must use outdated sampling frames, administrative boundaries could be incorrectly drawn, and national and sectoral planning and decision-making will be based on outdated and unreliable statistics. Even basic data on population size and age composition will be unavailable or unreliable.
This section reviews the current status of human popula-
tion censuses in Africa and discusses how these can be integrated with other geographic data types. It also reviews tools for rapid access to estimates of population distribution during humanitarian crises: the LandScan 2000 global population estimate and the Gridded Population of the World. The section ends by reviewing how remotely sensed data can be used to estimate population distribution.
African Demographic Censuses
Human population data for Africa are unreliable because of the dearth of good demographic censuses. Seventeen African countries did not conduct their first modern population census until the 1980 census round (i.e., between 1975 and 1984). In recent years civil unrest has taken its toll on census-taking in a number of African countries, as has economic stagnation and higher priority issues (e.g., HIV/AIDS).
Ideally, countries should conduct population censuses at 10-year intervals (UN, 1998).19 The 2000 round of censuses (1995 to 2004) has encountered a number of challenges, some new and others longstanding (including funding, politics, civil unrest, nomadic populations). Funding constraints have affected the 2000 census round. Censuses today cost much more than in the past, partly because of increasing population size20 (Figure 5-10), and partly because of a growing demand for more specialized and detailed information. In addition, despite the rising costs of censuses, there appears to be “donor fatigue” in meeting gaps in census funding. For example, the United Nations Population Fund’s current policy is to limit support to countries conducting their first or second population census (Leete, 2001).
Recently, a number of bilateral and multilateral agencies (e.g., USAID, U.K. Department for International Development [DfID], CIDA, the World Bank, the European Union, UNDP, UNICEF, and the African Development Bank), as well as governments (e.g., Belgium, Finland, France, Japan, Norway, Portugal, Sweden, and Taiwan), have provided limited assistance to conduct censuses. Donor statistical agencies such as Statistics Canada and the U.S. Bureau of the Census often do not have direct funding from their governments to support international assistance and are reliant on funding from other government agencies, usually the international development agency.
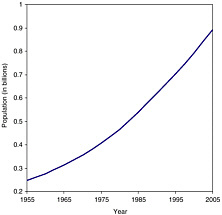
FIGURE 5-10 Population growth in Africa, 1955-2005 (UNDP, 2001).
As of mid-2002 roughly two-thirds of African countries have yet to conduct a population census in the 2000 census round (Annex Table 5-2). Currently, out of 44 countries in sub-Saharan Africa, 35 countries have moderate to severe funding gaps for their 2000 round of census operations (UNFPA, unpublished). Limited funding also restricts the dissemination of censuses. In Burkina Faso, for example, the government had funding to publish no more than about 50 copies of the 1996 census. Unless satisfactory solutions are found, some sub-Saharan countries may find it difficult to organize further population censuses (Diop, 2001).
Even when sufficient funds exist to conduct censuses in Africa, there are additional challenges to their completion, including
-
their politicized nature, with the collection and dissemination of census results delayed (or even suppressed);
-
difficulties enumerating nomadic and dispersed populations;21
-
village names changing from one census to another;
-
maps on which the villages were noted are commonly out of print (the problem of loss of legacy data);
-
census “maps” may be sketches with indeterminate boundaries;
-
many years may pass before data at the sub-national level are processed and disseminated to local users, even though data at the local level are important for place-based development planning; and
-
although data at the village level are highly useful, data often are aggregated to the district or even to the regional level, masking the critical local interrelationships between population and the environment, health, land use, infrastructure, education, and poverty.
The Value of Geographically Referenced Population Data
Governments need national population data and the international community needs global population data to understand the impacts of population on the environment (and, conversely, to better understand the impact of the natural environment on the well-being, vulnerability, and livelihoods of populations). The challenge lies in linking population and other socio-economic data with information on the environment in a common, geographically referenced framework.
Over the past decade the U.S. Bureau of the Census has conducted advanced work on the collection and presentation of geographically referenced data. Their TIGER (Topologically Integrated Geographic Encoding and Referencing) files contain a digital database of geographic features covering the United States. The TIGER database defines the location and relationship of roads, rivers, railroads, and other features to each other and to the numerous geographic entities for which the Bureau of the Census tabulates data both from its population censuses and its sample surveys. The database provides a convenient way to link to a geographic location the statistical data being reported for these entities.
No developing country has the equivalent of the TIGER database. However, in recent censuses as well as in some surveys African countries have begun to use GPS receivers to record the coordinates of villages (Box 5-5). These GPS-based efforts provide a means of integrating census data with other data sets (e.g., agricultural statistics; location of roads, facilities, villages). GPS is not a “magic bullet,” however. In Niger’s recent census, for example, it was estimated that GPS data were correct in 85 percent of cases, marginally incorrect in another 5 percent of cases, and completely incorrect in 10 percent of cases, owing to such factors as reversal of latitude and longitude coordinates or insufficient training to operate the GPS receiver.
Estimating Human Populations at Risk
Natural and human-induced disasters place human populations at risk, often with little or no advance warning. Estimates of evolving population distribution are required at short notice for emergency response by national and international organizations. One approach used to estimate populations at risk is to analyze existing population information (as
|
BOX 5-5 In 1994 USAID financed a pilot study called “Population, Health and Environment in Niger.” This study was executed by the government of Niger, CERPOD, and AGRHYMET (Chapter 3). The goal was to develop a GIS-based presentation showing relationships between population, health care, and the environment, using data from the 1988 Niger Census, the National Health Information System, and the environmental sources. The pilot was to develop and demonstrate a decision-support system for locating health centers in Niger. The system would support the government’s planning as it attempted to increase the national health coverage rate from 32 percent to 45 percent of the population. The first step was to integrate existing population and health center data sets into a GIS database. When originally collected, these data had no accompanying geographic coordinates, and could not, therefore, be readily plotted on a map. Project members found that the best source of geographic information for the location of population at the village level was old paper maps (legacy data) produced in the 1950s and 1960s by IGN in Paris (Box 5-1). Information from these maps was entered into the computer database, yielding coordinates of each village on which the population statistics could be plotted. The population data for each village were then manually linked to the IGN base map to show population distribution across Niger. Owing to recurring problems with multiple names for villages, the age differential between the base map and the census data, and incomplete coverage by the legacy maps from IGN, only 87 percent of the population of Niger was covered in the GIS database. Using the population data along with the location of existing health facilities, the project demonstrated a GIS that could guide government decision-makers in the optimal location of new health facilities (facilities that were accessible to the greatest number of people with the minimum number of new centers). The GIS was never adopted, however. Upon completion of the pilot project the team disbanded and the data and the software were separated. There currently exists no copy of the GIS at CERPOD, for example (H. Wane, CERPOD, personal communication, 2002). Insufficient local capacity was built to support further application, owing to the short duration of the pilot. There were positive impacts of the pilot project, however. CERPOD convened a workshop in 1996 that demonstrated to Sahelians and others the potential of integrating population data into spatial decision-support tools such as GIS. Organizations, including UNICEF, supported the meeting. Subsequent population censuses by UNICEF, Demographic Health Surveys, and others at the national and local level have routinely collected geographic coordinates in addition to population statistics. |
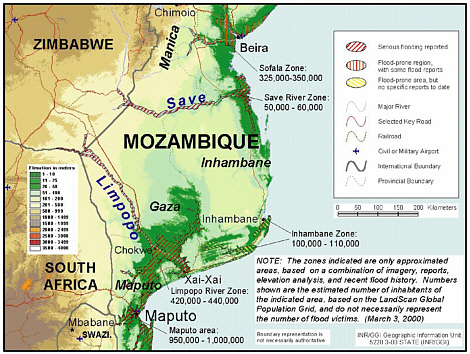
FIGURE 5-11 A flood hazard map showing populations at risk in Mozambique following the cyclone Eline in March 2000 (courtesy of the Geographic Information Unit, U.S. Department of State). It was used to estimate the areas of Mozambique in greatest need of humanitarian assistance following the flooding.
good as can be obtained in a region) in conjunction with cartographic and remote-sensing information.
LandScan 2000
LandScan 2000 is a worldwide population database for estimating ambient populations at risk (e.g., Figure 5-11). Unlike traditional censuses that tie the location of people to their homes, LandScan 2000 attempts to account for people’s mobility. It aims to map the presence of people in fields, schools, or on roads, rather than solely in their dwellings. The database was developed as part of the Oak Ridge National Laboratory Global Population Project (Dobson et al., 2000). The types of geographic and other information that enter into the calculation22 include census data (usually at the provincial level), road networks, elevation distribution, land cover (from AVHRR satellite imagery), and nighttime light sources (as detected from the Defense Meteorological Satellite Program [Box 5-6 and Annex Box 5-6]). LandScan allocates a certain number of people to each 1 × 1 km cell based on the relative likelihood of population occurrence associated with the aforementioned variables. The LandScan files are available free of charge by continent (LandScan, 2000).
Gridded Population of the World
The Gridded Population of the World (GPW) is an estimate of world population for 1990 and 1995. The estimates are based on the nearest population censuses to 1990 and 1995, and are adjusted to agree with UN population estimates for those years for each country. The data are freely available at global, continental, and country levels (CIESIN, 2002). GPW takes the best resolution data available to generate a 5 × 5 km population grid.23
|
BOX 5-6 Global meteorological and oceanographic conditions, among other parameters, are monitored by the U.S. Air Force’s Defense Meteorological Satellite Program (DMSP). One sensor system on DMSP satellites (the Operational Linescan System [OLS]) was developed originally to monitor the global distribution of clouds and cloud-top temperatures. In addition to these applications, however, the OLS detects faint sources of light at night on Earth’s surface, including settlements and fires (Welch, 1980; Elvidge et al., 1996, 1997, 2002) (Figure 5-12). By defining a reference set of stable lights—those present in the same location on a consistent basis—it is possible to identify new settlements or expansion or contraction of existing settlements by comparison with images collected at a later time. |
TABLE 5-3 A Comparison of Features of the LandScan 2000 and Gridded Population of the World Global Population Estimates
|
Features |
LandScan 2000 |
Gridded Population of the World |
|
Number of administrative units |
69,350a |
127,093a |
|
Resolution (grid-cell size) |
1 × 1 km |
5 × 5 km |
|
Minimum downloadable unit |
Continent |
Country |
|
Model input variables |
Census data (population) |
Census data (population) |
|
|
Land cover Roads Elevation Nighttime lights |
|
|
Population data source |
U.S. Bureau of Census |
Varied data sources |
|
aRoughly 61,000 of these administrative units are within the United States. SOURCE: CIESIN, 2002 |
||
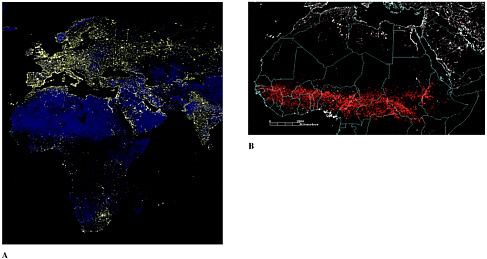
FIGURE 5-12 (a) The distribution of settlement lights derived from Defense Meteorological Satellite Program Operational Linescan System for Africa (courtesy Defense Meteorological Satellite Program). The distance (parallel to the Equator) from the tip of the Horn of Africa to the west coast off Guinea-Bissau is 7,350 km. (b) Distribution of fires in sub-Saharan Africa (courtesy Defense Meteorological Satellite Program).
By using census data from many more administrative units outside the United States, GPW provides a more detailed estimate of global baseline population distribution than LandScan (Table 5-3). Users can select the most reliable among varied data sources (e.g., from national statistical offices or the United Nations). Unlike LandScan, however, data in GPW have not been adjusted to account for people’s mobility.
Obtaining Human Population Distribution Directly From Remotely Sensed Imagery
There is no substitute for a ground-based, geographically referenced population census, but they are expensive and time-consuming to conduct. In the search for alternative approaches there is interest in estimating population distribution using remote sensing-based models (Liverman et al., 1998). If sufficiently accurate in situ data are available to calibrate these models, their accuracy may approach that of traditional censuses. Such population estimation can be performed on (1) counts of individual dwelling units at the local level, (2) measurement of total urbanized land areas (often referred to as settlement size) at the sub-national level, or (3) estimates derived from land-use/land-cover classification at the national level (Lo, 1995; Sutton et al., 1997) (Box 5-7).
Progress toward Agenda 21 goals is impeded by a lack of complete, reliable data on human population distribution. Currently, many African countries are challenged to complete the present round of censuses, in part because of funding constraints. These data will be of greatest value to decision-makers (including those using remote-sensing techniques) if they are geographically referenced and are as disaggregated as possible. USAID and the U.S. Bureau of the Census should provide financial and technical support to national census offices and bureaus in Africa to help them complete censuses, geographically reference the data, and make the data available in disaggregated form to decision-makers.
FRAMEWORK THEMATIC GEOGRAPHIC DATA
Upon the framework foundation data layers are placed framework thematic databases. This section reviews existing or potential sources of the four critical framework thematic databases: hydrology, government boundaries, transportation, and cadastre.
Hydrology
Hydrologic framework thematic data underlie most natural resource, urban infrastructure, and utility planning applications. They can be obtained using a variety of geographic data technologies and sources. First, they can be recorded in situ by people with GPS. Second, they can be extracted from maps or remotely sensed data (e.g., in Burkina Faso–see Chapter 8). Third, stream network information can be extracted from digital elevation models.
One product is HYDRO1K, with a spatial resolution of 1 × 1 km derived from the GTOPO30 digital elevation dataset. HYDRO1K was developed by the U.S. Geological Survey in cooperation with UNEP/GRID (HYDRO1K, 2002), with additional funding from the Brazilian Water Resources Secretariat and the Food and Agriculture Organization/Inland Water Resources and Aquaculture Service. It provides users on a continent by continent basis with a low-resolution digital elevation model, along with ancillary datasets for use in continental and regional applications. The following prod-
|
BOX 5-7 Dwelling Unit Approach: The most accurate remote sensing-assisted method of estimating the population is to count individual dwelling units (see Lo, 1995; Haack et al., 1997; Jensen, 2000). If remotely sensed imagery with a spatial resolution of 0.25 to 5 m is available, this methodology works reasonably well for local censuses. Unfortunately, it is not suitable for a regional or national census of population because it is too time-consuming and costly (Sutton et al., 1997). In fact, Broome (U.S. Bureau of the Census, personal communication, 1998) has suggested that this method requires so much in situ data to calibrate the remote sensor data that it can become operationally impractical. Furthermore, the costs of acquiring the needed data are prohibitive. Therefore, other methods have been developed. Total Urbanized Area Approach: Urban population correlates fairly consistently with total urbanized area at sub-national scales (Olorunfemi, 1984). Sutton et al. (1997) used Defense Meteorological Satellite Program Operational Linescan System (DMSP-OLS) nighttime 1 × 1 km imagery to inventory urban extent for the entire United States, with promising results at the state and county level. Unfortunately, this method “may underestimate the population density of urban centers and overestimate the population density of suburban areas.” Land Use Approach: This approach assumes that land use in an urban area is closely correlated with population density. First, a value is established for the population density for each land use by field survey or census data (e.g., multiple-family residential land use may contain 10 persons per pixel when using 30 × 30 m Landsat TM data, whereas rural forested areas might have only 0.20 persons per pixel). Next, by measuring the total area for each land-use category, the total population for that category is estimated. Finally, adding together the estimated totals for each land-use category provides the total population projection (Lo, 1995). |
|
BOX 5-8 In 2000 the Tanzanian and Ugandan governments used GPS to resolve their border dispute that began in 1978. The Ugandan government gave up its territorial claim to a strip of land on the common border with Tanzania after GPS measurements proved that the pillars demarcating the two countries were 300 m inside Tanzania. As a result of the survey Uganda has moved the pillars of the border, a 100-kilometer straight line, to new positions inside Uganda. SOURCE: People’s Daily (2000). |
ucts are available for Africa: streams,24 drainage basins,25 flow direction, flow accumulation, elevation, compound topographic index, slope, and aspect (HYDRO1K, 2002).
A valuable hydrologic product for application to Agenda 21 issues could be derived from the Shuttle Radar Topography Mission with almost global 90 × 90 m (perhaps 30 × 30 m) spatial resolution. This derivative product would have applications at the sub-regional level where HYDROlK currently is inapplicable. Serious consideration should be given by the USGS to modeling the Shuttle Radar Topography Mission-derived 30 × 30 m digital elevation data to produce the most accurate, affordable hydrologic network database with global coverage.
Government Units
Boundaries of government units, such as national borders, can be contentious, yet they are not always well documented (e.g., Box 5-8). One method for determining a boundary is to collect in situ GPS measurements. Alternatively, remotely sensed ortho-images (e.g., the global GeoCover-ortho dataset) can be used if the political boundary lies along a feature such as a river centerline, mountain ridge, or shoreline. For greater precision, boundaries can be delineated from very high spatial resolution imagery (e.g., less than 1 × 1 m) obtained in stereo.26 However, remotely sensed imagery is inappropriate when the boundary is not visible in the imagery. Consequently, boundary-mapping endeavors often rely on both in situ surveying and remote-sensing.
The “Global GIS Database” (Hearn et al., 2001) contains boundary information with global coverage. Developed by the USGS through an agreement with ESRI, the database is of sufficient spatial resolution (1 × 1 km: or a scale of 1:1,000,000) for use as a regional reference and analytical tool but has limited value at the local level. NIMA’s Operational Navigation Chart series is the primary data source for the “political boundaries” data set in the database. This series is the largest-scale (highest spatial resolution) unclassified map series that provides global coverage of features such as political boundaries. The “gazetteer” in the Global GIS Database, which grows by roughly 20,000 features monthly, currently contains 3.5 million geographic names from NIMA’s database of foreign geographic feature names. The database is read through free ArcView Data Publisher software, and is available by region for U.S.$10 on CD-ROMs or on a single DVD.
Transportation Networks
Transportation networks include roads, railways, and pipelines. In addition to improving basic services (e.g., delivery and collection) there are many benefits to mapping transportation networks (Table 5-4). Geographic information from GPS and remote-sensing technology is useful for managing transportation networks (DOT, 2001) (Table 5-4). As developing countries move toward adopting these kinds of technologies, they can use other sources of information, such as the Global GIS Database (for regional applications) and legacy maps. However, these sources have limited value for the applications in Table 5-4 because of their coarse spatial resolution. Additionally, transportation networks can rapidly evolve, particularly in urban areas, and up-to-date, accurate information for effective transportation network management is needed (e.g., Table 5-4).
Cadastral Information for Land Administration
A cadastre is a map accompanied by a register showing the ownership or possession of individual units of land that is used to facilitate efficient land administration and expedite land market transactions. Among its many applications to sustainable development (Table 2-5), a cadastre is critical for combating poverty, integrated environment and development decision-making, and sound management of solid, hazardous, and other waste.
In Africa, land often is owned communally. Ownership rights tend to be based on communal units of lineages and extended families. However, individual members have use rights or “usufruct” to the land they currently farm. The concept of individual land ownership, especially in urban areas, was one of the consequences of the colonial integration of African countries into the global free-market system. Ownership not only promotes individual care and concern about land but also enhances its value. Owning land provides individuals with economic assets that can be traded in land markets, used as collateral to raise credit or as security for vari-
TABLE 5-4 Data Requirements for Application of Geographic Data to Transportation Network Management Challenges
|
Application |
Explanation |
Benefits |
Data Requirements |
|
Environmental assessment, integration, and streamlining |
The growth of transportation networks associated with urban growth and sprawl generates such environmental impacts as deforestation, impact on local and regional hydrology, and accentuation of such landatmosphere factors as the urban heat island effect. |
Mitigation of the impacts of growing transportation networks. |
Medium to coarse spatial resolution remote sensor data (e.g., 5 to 20 m resolution such as SPOT or Landsat Thematic Mapper) with moderate 16-day temporal resolution requirements. |
|
Hazards, safety, and disaster management |
Monitoring transportation infrastructure to maximize public safety during emergencies. |
Minimize failures of transportation networks, and carefully and rapidly move people away from an area in an emergency. |
Medium resolution remote sensor data (e.g., Landsat Thematic Mapper or SPOT imagery) with very high temporal resolution requirements, often less than a day. |
|
Traffic surveillance, monitoring, and management |
Managing the flow of people and goods between geographically separated locations. Relevant information includes vehicle traffic volumes, classifications, speeds, and truck weights. |
Improved estimates in forecasting traffic flows (reduced congestion, better network design). |
Airborne and satellite-based sensors are most applicable. Extremely high temporal (e.g., minutes to hours) and high spatial resolution data (usually ≤ 1 m) are needed. |
|
Transportation infrastructure management |
Maintenance, operation, and renewal of such assets as pavement, bridges, pipelines, rail lines, harbors, and airports. Historically, infrastructure management was conducted in situ on an asset-by-asset basis. |
Information on the location and condition of these assets is critical to effective management. |
Extremely high spatial resolution remote sensor data (≤ 1 m) and in certain instances hyperspectral data (hundreds of bands). |
|
SOURCE: DOT (2001). |
|||
ous forms of economic improvements. Because individual land ownership is nonexistent in large parts of rural Africa, except in eastern and southern Africa, challenges remain for rural Africans to obtain credit from lending institutions in their bid to improve quality of life.
Several capacities have facilitated privatization and ownership of land. These include the capacity to survey individual plots, identify their boundaries, determine their ownership or possession, formally register or informally recognize their status, and, where the system has developed in eastern and southern Africa, accord them formal titles. As a result of these capacities it is possible to register and monitor subsequent transactions in the plots of land over time, enabling effective cadastration of land or the development of a land information system of ownership and possession.
Typically, a cadastre is produced at a scale of 1:10,000 or larger. In certain instances high spatial resolution aerial photography or other remotely sensed data reveals boundaries associated with long-held communal property boundaries. However, these data are expensive. Consequently, the production of cadastres has low priority for most African countries and donor agencies, even when there are clear benefits. Although the production of cadastres has been stymied by their cost, GPS in concert with GIS is cheaper than traditional surveying techniques and should facilitate production of cadastres.
Notwithstanding these technological innovations, it needs to be stressed that cadastration in any country remains a complex, demanding, if essential exercise. It should be undertaken community by community so as to expedite the adjudication of disputed claims of ownership.
Continued development of cadastres could facilitate land management and administration, promote greater efficiency in the operation of land markets both in urban and rural areas, strengthen the operations of free-market economies, and reinforce the ability of governments to initiate and sustain land and agrarian reforms (e.g., de Soto, 2000). Over time, cadastres could play an indirect role in poverty reduction, especially through enhancing access to credit facilities for many people beyond the limits usually provided by the now popular microcredit schemes. Additionally, by inducing a strong proprietary interest in land, the process of cadastration can help to deepen environmentally sensitive attitudes to development. Last, the provision of cadastres facilitates the supply of socio-economic information for effective settlement management. Many cities and towns have no maps showing the network of streets and roads. Many streets and roads have no names and many houses on the roads have no numbers (ECA, 2001). In short, many Africans have no easily located residential addresses to facilitate their effective participation in social and economic transactions. These inadequacies have been one reason why the systematic delivery, management, expansion, and improvement of services to all segments of the population, the effective collection of
taxes and rates, and the cost recovery for utilities and services have been difficult to implement in urban areas (ECA, 2001). Because of the potential of cadastres to address Agenda 21 issues, including poverty reduction and land resource management, the U.S. government (USAID and USGS) should assist African countries in developing cadastres.
SUMMARY
Framework geographic data that underlie many Agenda 21 issues are accessible at varying degrees to users in developing countries. Cost and availability are two factors that influence access, in addition to telecommunications infrastructures (Chapter 4). Some framework foundation data are affordable and available. These are geodetic control (which can be obtained using a GPS receiver) and ortho-imagery. Topographic framework foundation data will be affordable and available in the near future with better than 90 × 90 m spatial resolution, and there is potential for an equally high spatial resolution hydrologic network database. Currently, affordable global datasets on transportation and hydrologic networks are available but are of insufficient resolution for most applications. Conversely, essential framework data, such as human population distribution, government units, and cadastre, are currently unaffordable to many African countries, but could become available if financial and technical assistance is provided. Meanwhile, African countries have no other choice but to use legacy datasets that are out of date for such applications as managing transportation networks. Nonetheless, these datasets are invaluable as baselines for detecting change.
REFERENCES
Ahmed Saleck ben Mohamed Lemine ibn Bouh. 2001. Repertoire de Mohamed ben Tolba el Jacobi de Chinguetti de Mauritanie 1774-1856 avec Explication de Mohamed Abdalah ben Shbih ben Bouh. Nouakchott, Mauritania.
ASPRS (America Society of Photogrammetry and Remote Sensing). 2002. Grids and Datums; The Portuguese Republic. Photogrammetric Engineering and Remote Sensing 68(4):305-307.
Barnes, S. 2002. GNSS evolves. Geospatial Solutions 12(5):10-11.
British Museum. 2002. The British Museum Department of Libraries and Archives. Available at http://www.british-museum.ac.uk/libraries/index.html. Accessed on July 11, 2002.
CIESIN (Center for International Earth Science Information Network). 2002. Population density, 1995. Available at <http://sedac.ciesin.org/plue/gpw/main.html>. Accessed April 23, 2002.
De Soto, H. 2000. The Mystery of Capital: Why Capitalism Triumphs in the West and Fails Everywhere Else. New York: Basic Books..
DEVECOL (Development Ecology). 2002. Available at <http://www.devecol.org>. Accessed May 31, 2002.
Diop, L. 2001. Organization and Financing of Population Censuses in Sub-Saharan Africa: Problems and Prospects. In Symposium on Global Review of 2000 Round of Population and Housing Censuses: Mid-Decade Assessment and Future Prospects. New York: United Nations Secretariat.
Dobson, J. E., E. A. Bright, P. R. Coleman, R. C. Durfee, and B. A. Worley. 2000. A Global Population Database for Estimating Population at Risk, Photogrammetric Engineering and Remote Sensing, 66(7): 849-858.
Donaint, P. 1975 Les Cadres Géographiques à Travers les Langues du Niger—Contribution à la Pedagogie de l’Étude du Milieu. Etudes Nigeriennes No 37. Niamey: Institut Nigerien de Recherches en Science Humaines.
DOT (Department of Transportation). 2001. Commercial Remote Sensing Technologies Application to Transportation. Washington, DC: U.S. Department of Transportation and National Aeronautics and Space Administration.
Earth Satellite. 2002. GeoCover-Ortho Database, Rockville, MD: Earth Satellite, Inc. Available at <http://www.earthsat.com>. Accessed June 3, 2002.
ECA (U. N. Economic Commission for Africa). 2001. The Future Orientation of Geoinformation Activities in Africa: Synthesis. Available at <http://www.uneca.org/eca_resources/Conference_Reports_and_Other_Documents/disd/codi/docs/doc3EN.pdf>. Accessed May 15, 2002.
Elvidge, C. D., H. W. Kroehl, E. A. Kihn, K. E. Baugh, E. R. Davis, W. M. Hao. 1996 Algorithm for the Retrieval of Fire Pixels from DMSP Operational Linescan System. Pp. 73-85 in Global Biomass Burning, J. S. Levine, ed. Cambridge, MA: MIT Press.
Elvidge, C. D., K. E. Baugh, E. A. Kihn, H. W. Kroehl, and E. R. Davis. 1997. Mapping City Lights with Nighttime Data from the DMSP Operational Linescan System. Photogrammetric Engineering and Remote Sensing 63(6):727-734.
Elvidge, C. D., K. E. Baugh, V. R. Hobson, E. A. Kihn, and H. W. Kroehl. 2002. Detection of Fires and Power Outages at Night Using DMSP-OLS Data. Available at <dmsp@ngdc.noaa.gov>. Accessed Jne 3, 2002.
ESRI (Environmental Systems Research Institute). 2002. Saving the elephants with GIS and GPS. Available at <http://www.esri.com/news/arcnews/summer00articles/savingelephants.html>. Accessed May 7, 2002.
Gesch, D. B., K. L. Verdin, and S. K. Greenlee. 1999. New Land Surface Digital Elevation Model Covers the Earth. Eos Transactions, American Geophysical Union 80(6):69-70.
GTOPO30 (Global Topography at 30 arc second spatial resolution). 2002. GTOPO30. Sioux Falls: U.S. Geological Survey EROS Data Center. Available at <http://edcdaac.usgs.gov/gtopo30/gtopo30.html>. Accessed June 3, 2002.
Haack, B., S. Guptill, R. Holz, S. Jampoler, J. Jensen, and R. Welch. 1997. Chapter 15: Urban Analysis and Planning. Pp 517-553 in Manual of Photographic Interpretation. Bethesda: American Society for Photogrammetry and Remote Sensing.
Hearn, P., Jr., T. Hare, P. Schruben, D. Sherrill, C. Lamar, and P. Tsushima. 2001. Global GIS Database: Digital Atlas of Africa, U.S. Geological Survey Digital Data Atlas Series DDS 62-B. Washington DC: U.S. Geological Survey, CD.
HYDRO1K. 2002. Sioux Falls: U.S. Geological Survey EROS Data Center. Available at <http://edcdaac.usgs.gov/gtopo30/hydro/>. Accessed May 31, 2002.
IGN (Institut Géographique National). 2002. Available at <http://www.ign.fr/>. Accessed July 11, 2002.
Jensen, J. R. 1995. Issues Involving the Creation of Digital Elevation Models and Terrain Corrected Orthoimagery Using Soft-Copy Photogrammetry. Geocarto International: A Multidisciplinary Journal of Remote Sensing 10(1):1-17.
Jensen, J. R. 2000. Remote Sensing of the Environment: An Earth Resource Perspective. Saddle River: Prentice-Hall.
Kobrick, M. 2002. Pictures from the Real Edge: NASA Posts U.S. Topography Data. Pasadena: NASA Jet Propulsion Laboratory Media Relations Office. Available at <http://www.jpl.nasa.gov>. Accessed June 3, 2002.
LandScan. 2000. Landscan Global Population Database, Oakridge, TN: Oak Ridge National Laboratory. Available at <http://sedac.ciesin.columbia.edu/plue/gpw/landscan>. Accessed June 3, 2002.
Leete, R. 2001. Population and Housing Censuses: A Funding Crisis? In Symposium on Global Review of 2000 Round of Population and Housing Censuses: Mid-Decade Assessment and Future Prospects. New York: United Nations Secretariat.
Liverman, D., E. F. Moran, R. R. Rindfuss, and P. C. Stern (eds). 1998. People and Pixels—Linking Remote Sensing and Social Science. Washington, DC: National Academy Press.
Lo, C. P. 1995. Automated Population and Dwelling Unit Estimation from High-Resolution Satellite Images: A GIS Approach. International Journal of Remote Sensing 16:17-34.
McCanna, R. L. 2002. Shuttle Radar Topography Mission (SRTM) Data. Briefing to the Committee on the Geographic Foundation of Agenda 21, Washington, DC: National Academy of Sciences.
Murray, J. A. (ed). 1993. Wild Africa—Three Centuries of Nature Writing from Africa. Oxford: Oxford University Press.
NASA (National Aeronautics and Space Administration). 2002. Available at <http://www.esad.ssc.nasa.gov/datapurchase/default.asp?sec=background>. Accessed: May 1, 2002.
NRC (National Research Council). 2001. Transforming Remote Sensing Data into Information and Applications. Washington, DC: National Academy Press.
Olorunfemi, J. F. 1984. Land Use and Population: a Linking Model. Photogrammetric Engineering and Remote Sensing 50:221-227.
Parkinson, B. W., 1994. GPS Eyewitness: The Early Years. GPS World, 5(9): 32-45.
People’s Daily. 2000. Tanzania, Uganda Resolve Border Dispute. Available at: <http://english.peopledaily.com.cn/200012/18/eng20001218_58164.html>. Accessed on May 28, 2002.
Rizos, C. 2002. Introducing the Global Positioning System. Pp 77-94 in Manual of Geospatial Science and Technology, J. D. Bossler, J. R. Jensen, R. B. McMaster, and C. Rizos, eds. London: Taylor and Francis.
SRTM (Shuttle Radar Topography Mission), 2002a. Shuttle Radar Topography Mission. Available at http://www.jpl.nasa.gov/srtm/. Accessed July 11, 2002.
SRTM. 2002b. SRTM Fact Sheet: Seeing Earth’s Surface in 3-D. Pasadena: NASA Jet Propulsion Laboratory. Available at <http://www.jpl.nasa.gov/srtm/factsheet_pub.html>.
Stewart, M. and C. Rizos. 2002. GPS projects: Some Planning Issues. Pp 162-182 in Manual of Geospatial Science and Technology. J. Bossler, J. Jenson, R. McMaster, and C. Rizos, eds. London: Taylor and Francis.
Sutton, P., D. Roberts, C. Elvidge, and H. Meij. 1997. A Comparison of Nighttime Satellite Imagery and Population Density for the Continental United States. Photogrammetric Engineering and Remote Sensing 63(11):1303-1313.
Taylor, D. R. F. 1997. Modern Cartography, Policy Issues and the Developing Nations. Pp. 185-213 in Policy Issues in Modern Cartography, D.R.F. Taylor, ed. Oxford: Pergamon.
Thrower, N.J. and J. R. Jensen. 1976. The Orthophoto and Orthophotomap: Characteristics, Development, and Aspects of Cartographic Communication . American Cartographer 3(1):39-56.
UN (United Nations). 1998. Principles and Recommendations for Population and Housing Censuses. New York: United Nations.
UNDP (United Nations Development Programme), 2001. World Population Prospects Population Database. Available at <http://esa.un.org/unpp/sources.html>. Accessed June 3, 2002.
UNFPA (U.N. Population Fund). Unpublished. Compendium of Census Activities in Sub-Saharan Africa. 2000 Round of Censuses. Compiled by the Africa Division, UNFPA.
USGS (U.S. Geological Survey). 1998. Earthshots: Satellite Images of Environmental Change. EROS Data Center. Available at <http://edcwww.cr.usgs.gov/earthshots/slow/tableofcontents>. Accessed June 26, 2002.
USGS. 1999. The Global Positioning System, Fact Sheet 062-99. Washington, DC: U.S. Geological Survey.
USGS. 2002a. Digital Chart of the World–DOS, Sioux Falls, SD: EROS Data Center, U.S. Geological Survey. Available at: <http://edc.usgs.gov/glis/hyper/oldguides/dcw>. Accessed July 11, 2002.
USGS. 2002b. GTOPO30 Order Form. Available at <http://edcdaac.usgs.gov/gtopo30/form.html>. Accessed July 11, 2002.
USGS, 2002c. Landsat Data Continuity Mission Homepage. Available at <http://ldcm.usgs.gov/>. Accessed July 11, 2002.
Verdin, K. L., and S. K. Jenson. 1996. Development of Continental Scale DEMs and Extraction of Hydrographic Features, Proceedings, National Center for Geographic Information and Analysis International Conference/Workshop on Integrating GIS and Environmental Modeling. Santa Fe, NM, January 21-25, CD, 1 disc.
Welch, R. 1980. Monitoring Urban Population and Energy Utilization Patterns from Satellite Data. Remote Sensing of Environment 9:1-9.
ANNEX 5
|
ANNEX BOX 5-1 NAVSTAR consists of three components: the space segment (consisting of the satellites and the transmitted signals); the control segment (which tracks the satellites and gives them instructions); and the user segment (where GPS data are turned into spatial information for use in many applications). Space Segment This segment consists of 24 satellites and the signals that are broadcast from them. This information allows users to determine their position, velocity, and time. Only a certain number of satellites above the observer’s horizon are “visible” to a GPS unit at any moment in time. This has a significant impact on the precision of the positioning measurement. The greater the number of satellites above the observer’s horizon, the higher the quality of the measurement. Each GPS satellite transmits unique navigational signals centered on two L-band frequencies (carrier waves) plus ranging codes modulated on the carrier waves, and a navigation message. The ranging codes are used to compute the signal transit time from the satellite transmitter to the receiver. Multiplying this value by the speed of light yields the range from the receiver to the satellite. When enough of these measurements are obtained from the various satellites above the observer’s horizon, it is possible to triangulate on the position of the observer. The Control Segment The U.S. Department of Defense operates five ground stations: in Hawaii, Colorado, Ascension Island, Diego Garcia, and Kwajalein. These stations communicate with the satellites, adjust their orbits, and maintain the constellation of satellites and their functions. The User Segment The user segment results in the conversion of range information measured by the GPS unit into useable positioning information. The accuracy of these coordinates is a function of several parameters. For example, the observer may select absolute (single-point) positioning or relative positioning. Generally, the relative positioning system achieves more accurate results. Absolute positioning refers to use of a single GPS system in communication with the constellation of satellites. Conversely, relative positioning measurements are normally obtained using two GPS units on the ground. For relative positioning, one of the GPS units functions as the base station while the other GPS unit is carried by the user to locations of interest. The relative position is the difference between the two positions (in the global system), expressed in a local reference system with the origin at the base station (Rizos, 2002). The accuracy of relative positioning measurements is a function of the length of the baseline between GPS receivers, the length of time and the number of observations obtained at a specific location by the GPS unit, the number and position of available satellites, and the amount and quality of the post-processing of raw data (Stewart and Rizos, 2002). Accuracies in the centimeter range are attainable for geodetic and general way-finding under certain conditions. The accuracy of the elevation measurement at each location is about two to three times poorer than the horizontal positioning accuracy. Therefore, it is important to achieve as accurate a horizontal positioning as possible. |
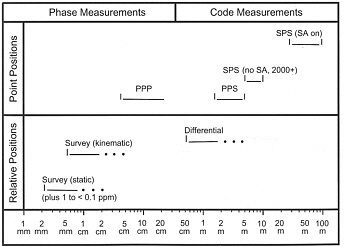
FIGURE 5-A1 Global Positioning System accuracy and positioning modes (adapted from Rizos [2002]). The top half of the illustration refers to single point positioning measurements made with a single GPS unit communicating with a number of satellites. The lower half refers to the relative positioning mode where the position of the receiver of interest (i.e., the location of the user) is derived relative to a base station receiver with known absolute coordinates.
|
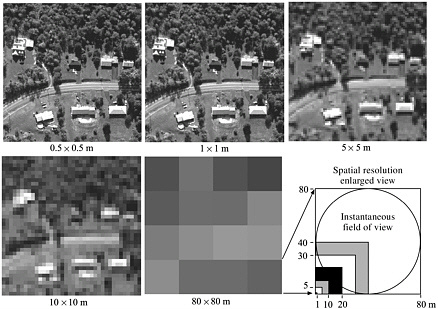
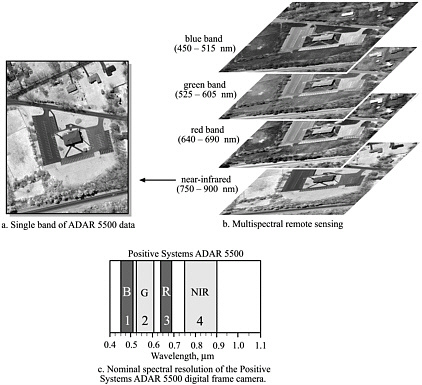
ANNEX BOX 5-2 Spatial resolution is a measure of the smallest angular or linear separation between two objects that can be resolved by the remote-sensing system. The spatial resolution of aerial photography may be measured by (1) placing carefully calibrated, parallel black-and-white lines on tarps that are placed in the field, (2) obtaining aerial photography of the study area, and (3) analyzing the photography and computing the number of resolvable line pairs per millimeter in the photography. For electronic remote-sensing systems, the nominal spatial resolution is the dimension in meters (or feet) of the ground-projected instantaneous-field-of-view (Jensen, 2000). For example, the IKONOS panchromatic band has a nominal spatial resolution of 1 × 1 m and the Landsat Thematic Mapper 5 has a nominal spatial resolution of 30 × 30 m for six of its bands. Generally, the smaller the spatial resolution, the greater the resolving power of the sensor system. Simulated examples of different spatial resolution remote sensor data are shown in Figure 5-A2. Temporal resolution refers to how often remotely sensed data are acquired over a particular geographic area. For example, the temporal resolution of the polar-orbiting Landsat 4 and 5 Thematic Mapper remote-sensing systems has been 16 days. If a remote-sensing system can be pointed off-nadir (i.e., it does not have to look straight down), then it is possible to obtain much higher temporal resolution (e.g., the pointable Space Imaging, Inc., IKONOS and DigitalGlobe Quickbird can obtain imagery every few days, depending upon the latitude of the area of interest). Some satellites such as the Geostationary Operational Environmental Satellites (GOES) are located in an orbit a certain distance above a particular point on the ground. Such remote-sensing systems often have very high temporal resolution (e.g., they obtain imagery every one-half hour) that facilitates the tracking of tornadoes, frontal systems, and hurricanes. Spectral resolution is the number and dimension of specific wavelength intervals in the electromagnetic spectrum to which a remote-sensing instrument is sensitive. Remote-sensing systems may be configured to collect data in just a single band of the electromagnetic spectrum. For example, a digital frame camera band 4 near-infrared image is displayed in Figure 5-A3a. Multispectral remote-sensing takes place when energy is recorded in multiple bands of the electromagnetic spectrum. For example, the ADAR 5500 usually acquires four multispectral bands of imagery during a mission as shown in Figure 5-A3b. The bandwidths are shown in Figure 5-A3c: band 1 = 450-515 nm; band 2 = 525-605 nm; band 3 = 640-690 nm; band 4 = 750-900 nm. A hyperspectral remote-sensing instrument acquires data in hundreds of spectral bands. For example, the Airborne Visible and Infrared Imaging Spectrometer (AVIRIS) has 224 bands in the region from 0.4-2.5 μm spaced just 10 nm apart. Ultraspectral remote-sensing involves data collection in many hundreds of bands. Careful selection of the spectral bands improves the probability that a feature or biophysical parameter (e.g., biomass, turbidity) will be detected, identified, and measured accurately. |
|
ANNEX BOX 5-3 NASA launched its first Landsat satellite in July 1972, (originally called ERTS, Earth Resources Technology Satellite). This satellite collected data at 79 × 79 m spatial resolution in four bands. Since 1972, five Landsat satellites have been placed into orbit, two of which were thematic mappers that obtained data at a spatial resolution of 30 × 30 m in seven bands. NASA’s Landsat Thematic Mapper 4 and 5 were launched on July 16, 1982, and March 1, 1984, respectively. Landsat 5 is still functioning. The Earth Observation Satellite Company (now Space Imaging) obtained control of the Landsat 4 and 5 satellites in September 1985. Thematic Mapper 4 and 5 satellites were placed in Sun-synchronous polar orbits at an altitude of 705 km. The TM sensors are based on optical-mechanical scanning technology. They collect data in a swath 185 km wide but cannot view off-nadir. The revisit cycle (temporal resolution) is every 16 days. The TM bands were selected to make maximum use of the dominant factors controlling leaf reflectance, such as leaf pigmentation, leaf and canopy structure, and moisture content. The spectral and spatial resolution characteristics are shown below.
Much of the Landsat TM 4 and 5 data are available at reasonable rates from the EROS Data Center in Sioux Falls, S. Dak., and from Space Imaging, Inc. Landsat 6 failed to achieve orbit in 1993. NASA’s Landsat 7 Enhanced Thematic Mapper Plus (ETM+) was launched on April 15, 1999. The ETM+ was developed to be in harmony with the relatively coarse spatial resolution sensors onboard NASA’s Earth Observing System Terra satellite as it provides a unique suite of relatively high spatial resolution observations. In addition, Landsat 7 was designed to (a) maintain data continuity by providing data that are consistent in terms of geometry, spatial resolution, coverage, and spectral characteristics with previous Landsat data, (b) periodically refresh a global archive of cloud-free, sun-lit landmass imagery, and (c) continue to make Landsat-type data available to international users at the cost of fulfilling user requests. Landsat 7 is based on the same scanner technology as Landsat 4 and 5. However, the ETM+ has significantly better radiometric calibration than its predecessors. ETM+ bands 1-5 and 7 are almost identical to those found on Landsat 4 and 5 and have the same 30 × 30 m spatial resolution with two exceptions. The thermal infrared band 6 (10.4–12.5 μm) has 60 × 60 m spatial resolution. There is a new 15 × 15 m panchromatic band (0.52–0.90 μm). Landsat 7 data are controlled by the U.S. Geological Survey. The products cost $475 (level 0R) or $600 (level 1R and 1G). There are no restrictions on the use, reprocessing, or redistribution of Landsat 7 data purchased from the U. S. government. Landsat Data Continuity Mission. The Land Remote Sensing Policy Act of 1992 directs Landsat program management (NASA and the USGS) to assess options for a data system to succeed the orbiting Landsat 7. This is called the Landsat Data Continuity Mission. Currently, two vendors (Resource-21 and DigitalGlobe) have been funded to provide formulation contracts. NASA expects to finalize the award for the Landsat Data Continuity Mission in mid-2003, with data delivery to the government in 2005 (USGS, 2002c) |
||||||||||||||||||||||||||||||||||||
|
ANNEX BOX 5-4 The Global GeoCover-Ortho database consists of Landsat Thematic Mapper images obtained circa 1990 that have the following characteristics:
The images were obtained from the Landsat foreign ground receiving stations,1 as well as from the U.S. Geological Survey’s EROS Data Center. The complete GeoCover-Ortho database includes 7,100 Landsat TM images. The positional accuracy of the Global GeoCover ortho-rectified imagery is better than 50 m.2 This positional accuracy is superior to the vast majority of the world’s 1:200,000 scale maps. The following description explains how this was achieved. To transform a Landsat TM image to a standard map projection scientists typically manipulate (rectify) it by selecting many ground control points and then applying mathematical techniques. This is a very time-consuming and expensive process that can result in inconsistencies at the edges of the image when adjacent TM images are processed independently. Consequently, it is difficult to process a large number of images using this approach (Jensen, 1995). EarthSat had the task of orthorectifying thousands of Landsat TM (circa 1990) and Multispectral Scanner (from the mid 1970s) images for the entire land surface of Earth in conjunction with its NASA contract (Earth Satellite, 2002). To do this accurately and efficiently a photogrammetric approach to the problem was used. A proprietary photogrammetric methodology was used to process groups of up to 400 Landsat images of which <10 percent contained ground control points against which they could be corrected. To create an accurate spatial relationship between the raw Landsat imagery and Earth’s surface the approach combined the world’s best horizontal and vertical ground control points with precisely measured tie points between adjacent images. Wherever possible, Earthsat used U.S. government digital elevation data with a spacing of 90 m for the vertical control. These were backed up by 900-m spaced data from the GTOPO30 data set when the 90-m data were not available. |
|
ANNEX BOX 5-5 SRTM processing is occurring in two parallel tracks:
|
|
ANNEX BOX 5-6 Each DMSP satellite crosses any point on Earth up to twice each day (equatorial crossing times are 0536 and 1052 local time). Because there are multiple satellites, nearly complete global coverage of clouds and features on Earth’s surface is achieved every six hours. The current generation of Operational Linescan System sensors began flying in 1976 and is expected to continue flying until approximately 2008, when it will be officially merged with the National Polarorbiting Operational Environmental Satellite System (NPOESS). Since March 1992, data have been sent daily to the U.S. National Geophysical Data Center for archiving. DMSP data are processed within five days of receipt. The data are available worldwide for the cost of materials and mailing. The archived data set consists of low spatial resolution (2.7 × 2.7 km) imagery with global coverage and high spatial resolution (0.55 × 0.55 km) imagery with regional coverage (along a 3,000 km scan). DMSP satellites are in a near-polar, Sun-synchronous orbit at an altitude of 830 km above Earth. Each orbit lasts approximately 101 minutes. The Operational Linescan System consists of two telescopes and a photo multiplier tube. Each sensor sweeps back and forth on a line on the Earth’s surface in a whiskbroom motion. The photo multiplier tube is used to detect nighttime lights in the range from 0.47 to 0.95 μm. One of the telescopes detects emissions from the Sun or the Moon that are reflected off clouds and features on the surface of Earth (in the range from 0.40 to 1.10 μm). The other telescope records thermal emissions by Earth’s surface and atmosphere (in the range from 10.0-13.4 μm). |
ANNEX TABLE 5-1 Characteristics of Global GeoCover-Ortho Image Products (Earth Satellite Corporation)
|
Image Type |
Characteristics |
|
Individual images |
Images cover an area of approximately 170 × 170 km, with a spatial resolution of 28.5 m. The complete GeoCover-Ortho database includes 7,100 orthorectified Landsat TM images. Images consist of all seven Landsat spectral bands in a Universal Transverse Mercator map projection with a geodetic accuracy of better than 50 m (root mean square accuracy). Images can be obtained with unique projections, datums, and band combinations. |
|
Mosaics |
Each mosaic is a group of juxtaposed Landsat images in a single, seamless digital image. Mosaics are three-band color composite products based on Landsat TM spectral bands 7,4,2. Mosaics may contain up to 15 Landsat images covering a 5-degree (north-south) by 6-degree (east-west) segment of a Universal Transverse Mercator grid. The mosaics have the same spatial resolution, geodetic accuracy, and map projection as the individual images. |
|
Regional mosaics |
These are large-area mosaics of 1,200+ Landsat images. Typically they comprise Landsat TM bands 7,4,2. The imagery has a spatial resolution commensurate with the scale of the final digital mosaic, but usually between 90 and 150 m. The map projections of regional mosaics vary and are determined by the conventions for the areas being covered. The following GeoCover-Ortho mosaics are available: Africa; northern Africa; Alaska; Australia; Central America; Middle East; northeast Asia; United States. |
ANNEX TABLE 5-2 Census Dates for Countries in Africa from 1965 to 2004
|
|
1970 Round 1965-1974 |
1980 Round 1975-1984 |
1990 Round 1985-1994 |
2000 Round 1995-2004 |
|
Algeria |
1966 |
1977 |
1987 |
1998 |
|
Angola |
1970 |
— |
— |
2002 P |
|
Benin |
— |
1979 F |
1992 |
2002 S |
|
Botswana |
1971 |
1981 |
1991 |
2001 S |
|
Burkina Faso |
— |
1975 F |
1985 |
1996 |
|
Burundi |
— |
1979 F |
1990 |
— |
|
Cameroon |
— |
1976 F |
1987 |
2002 S |
|
Cape Verde |
1970 |
1980 |
1990 |
2000 |
|
Central African Republic |
— |
1975 F |
1988 |
2002 S |
|
Chad |
— |
— |
1993 F |
2004-2005 |
|
Comoros |
1966 |
1980 |
1991 |
2002 S |
|
Congo |
1974 F |
1984 |
— |
1996:2000A |
|
Cote d’Ivoire |
— |
1975 F |
1988 |
1998 |
|
Democratic Republic of the Congo |
1970 A;1974 A |
1984 |
— |
— |
|
Djibouti |
1967; 1970-71 A |
1983 F |
— |
2001 S |
|
Egypt |
1966 SC |
1976 |
1986 |
1996 |
|
Equatorial Guinea |
1971 A |
1983 |
1994 |
2002 S |
|
Eritrea |
— |
1984 by Ethiopia |
— |
— |
|
Ethiopia |
— |
1984 F |
1994 |
2004 S |
|
Gabon |
1970 |
1980 |
1993 |
2003 P |
|
Gambia |
1973 |
1983 |
1993 |
2003 P |
|
Ghana |
1970 |
1984 |
— |
2000 |
|
Guinea |
1967 A; 1972 A |
1977 A; 1983 F |
— |
1996 |
|
Guinea Bissau |
1970 |
1979 |
1991 |
2001 S |
|
Kenya |
1969 |
1979 |
1989 |
1999 |
|
Lesotho |
1966 |
1976 |
1986 |
2001 |
|
Liberia |
1974 |
1984 |
— |
2003 S |
|
Libya |
1973 |
1984 |
— |
1995 |
|
Madagascar |
— |
1975 F |
1993 |
2003 S |
|
Malawi |
1966 F |
1977 |
1987 |
1998 |
|
Mali |
— |
1976 F |
1987 |
1998 |
|
Mauritania |
— |
1976-77 F |
1988 |
2000-01 S |
|
Mauritius |
1972 |
1983 |
1990 |
2000 |
|
Morocco |
1971 |
1982 |
1994 |
— |
|
Mozambique |
1970 |
1980 |
— |
1997 |
|
Namibia |
1970 |
1981 |
1991 |
2001 |
|
Niger |
— |
1977 F |
1988 |
2001 |
|
Nigeria |
— |
— |
1991 |
2004 S |
|
Reunion |
1974 |
1982 |
1990 |
1999 |
|
Rwanda |
— |
1978 F |
1991 |
2002 S |
|
Sao Tome and Principe |
1970 |
1981 |
1991 |
2001 S |
|
Senegal |
— |
1976 F |
1988 |
2003 S |
|
Seychelles |
1971 |
1977 |
1987;1994 |
2004 P |
|
Sierra Leone |
1974 |
— |
1985 |
2003 S |
|
Somalia |
— |
1975 F |
1987 |
— |
|
South Africa |
1970 |
1980 |
1985; 1991 |
1996; 2001 |
|
Sudan |
1973 |
1983 |
1993 |
2003 P |
|
Swaziland |
1966 |
1976 |
1986 |
1997 |
|
Tanzania |
1967 |
1978 |
1988 |
2002 S |
|
Togo |
1970 F |
1981 |
— |
2002 S |
|
Tunisia |
1966 |
1975 |
1994 |
2004 P |
|
Uganda |
1969; 1974 |
1980 |
1991 |
2002 S |
|
Western Sahara |
1970; 1974 |
1982 by Morocco |
1994 by Morocco |
— |
|
Zambia |
1969; 1974 SC |
1980 |
1990 |
2000 |
|
Zimbabwe |
1969 |
1982 |
1992 |
2002 S |
|
— No census listed in this round. A Administrative census. S Scheduled; not yet taken or known if taken. F First full modern census taken. P Projected based on pattern of census dates. SC Sample census. SOURCE: U.S. Census Bureau; UNFPA (unpublished). |
||||


