
D
Nitrogen and Sulfur Contents of Animal Products and Live Animals—Sample Excretion Predictions
The process-based, mass balance approach would begin by predicting nitrogen, carbon, and sulfur in manure excreted. This prediction would be made by subtracting the quantities of these elements in animal products from the quantities consumed. For every major type of farm animal and every production group within these types, such predictions of intake are already available. Current publications from the National Research Council (NRC, 1994, 1998a, 2000, 2001a) detail nutrient requirements for various animal types and production systems and with varying amounts of production. Moreover, these publications have been updated periodically. Tables D-1 to D−3 are based on the assumption that animals are fed to meet National Research Council recommendations. These tables show that different types of animals convert feed nutrients to human-consumable products at differing efficiencies. The whole-system analysis also requires understanding that cattle, which appear to use feed nutrients least efficiently, in fact consume whole plant feeds (forages) that can be produced with lower environmental impact or by-products that might otherwise be a waste product.
Producers can maintain good records of the quantities of animal products sold and the nutrient composition determined from protein content. Thus, for any given animal feeding operation (AFO), manure nutrient output can be estimated from the number of animals of each type and their average production. Since some farms feed more or less of certain nutrients than the National Research Council recommends, a more accurate estimate of manure output can be made by quantifying the actual feed inputs and the export of animal farm products. Farm feed and export receipts can be used to document this balance, or diets formulated and feed composition can be used.
TABLE D-1 Typical Nitrogen and Sulfur Content of Animal Products
|
Product |
N (%) |
S (%) |
|
Milk (% of milk weight) |
0.5 |
0.023 |
|
Eggs (% of whole egg weight including shell) |
1.78 |
0.16 |
|
Live Cattle |
|
|
|
At <30% of mature weight |
2.9 |
0.19 |
|
Growing (30-80% of mature weight) |
2.6 |
0.17 |
|
Finished cattle |
2.0 |
0.13 |
|
Mature breeding cattle |
2.2 |
0.15 |
|
Live Swine |
|
|
|
Nursing piglet |
2.0 |
0.13 |
|
Growing (6-80% of mature weight) |
2.3 |
0.15 |
|
Finished pig |
2.0 |
0.13 |
|
Mature breeding pig |
2.2 |
0.15 |
|
Live Poultry |
|
|
|
Starters |
2.6 |
0.17 |
|
Growers |
2.5 |
0.17 |
|
Finished broiler |
2.3 |
0.15 |
|
Layers and breeders |
2.4 |
0.16 |
CALCULATIONS AND ASSUMPTIONS FOR TABLE D-1
Milk
Approximately 93 percent of milk nitrogen is contained in true protein, while the remainder is found in nonprotein components. Therefore, milk crude protein can be calculated from milk true protein by dividing by 0.93 (NRC, 2001a). Milk nitrogen (N) can be calculated by dividing milk crude protein by 6.38 (USDA, 1941). Milk protein contains 2.4 g/16 g N as methionine and 0.87 g/16 g N as cystine (Hurrel et al., 1980). Methionine in a peptide is 21.8 percent sulfur (S), while cystine is 23.7 percent. Thus, the N:S ratio is 21.9 g/g, and sulfur in milk was determined by dividing the weight of nitrogen by 21.9.
Eggs
For a medium egg (mass = 58 g), the edible portion is 51.6 g (Royal Society of Chemistry, 1991), which means that 11 percent of the whole egg is shell. The edible portion is 65, 50, 44 and 37 g for jumbo, large, medium, and small eggs, respectively (USDA, 2002b), or 73, 56, 49, and 42 g for eggs including shells. The edible portion is 12.4 to 12.6 percent protein and 0.18 percent sulfur (Royal Society of Chemistry, 1991; USDA, 2002b). Nitrogen is calculated as crude protein divided by 6.25 (USDA, 1941).
Live Weight
Nitrogen is determined as protein content divided by 6.25. Sulfur is determined as nitrogen divided by 15. As animals grow, water content decreases while fat content increases. Protein initially increases due to decreasing water and then decreases due to increasing fat. On a dry, fat-free basis, protein comprises 80 percent of most animals’ empty (not including gut contents) body weight. The change in protein as cattle and pigs age is shown in Figure D-1. The curve for swine was developed from the data published by Mahan and Shields (1998). The curve for cattle was derived by integrating the change in total body protein (protein accretion) and body weight gain predicted by the National Research Council (NRC, 2000) and dividing the former values by the latter. Ferrell and Jenkins (1998) reported protein percentage of live weight for a variety of breeds of beef cattle fed differently to 80 percent of mature weight to range from 12.4 to 13.8 percent. Hutcheson et al. (1997) reported protein percentage of finished Brangus steers to range from 12.6 to 13.1 percent of live weight. For mature cattle, a
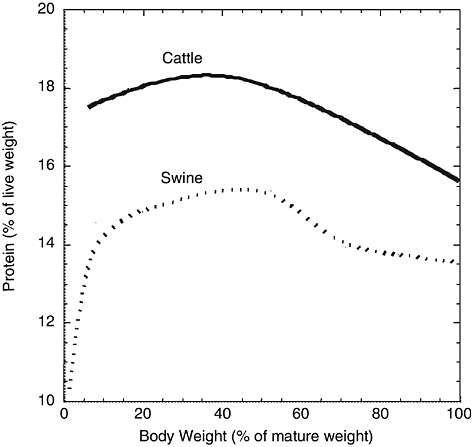
FIGURE D-1 Change in body protein percentage as cattle mature.
TABLE D-2 Nitrogen and Sulfur Content of Animal Live Weight Gaina
model using body condition score is recommended (NRC, 2001a) for predicting body protein directly. Breeding cattle were assumed to have a condition score of 3.0 on a 5-point scale, and finished cattle were assigned a score of 4.25. Compositions of poultry carcasses as a percentage of live weight were based on reports by Wolynetz and Sibbald (1986) and Van der Hel et al. (1992) for starters, Brady et al. (1978) for growing, and Santoso et al. (1995) for mature broilers. Composition of layers was based on Katanbaf et al. (1989).
CALCULATIONS AND ASSUMPTIONS FOR TABLE D-2
For cattle, the protein accretion associated with live weight gain was summarized by previous National Research Council (NRC, 2000, 2001a) publications. For the young calf (less than 30 percent of mature body weight), nitrogen retained for growth is assumed to be 3.0 g per 100 g live weight gain (National Research Council, 2001a). Using typical growth rates for cattle (0.83 kg/d), protein accretion per kilogram live weight gain was calculated according to the model defined by the National Research Council (2000). For swine, the protein as a percentage of live weight gain (grams per 100 grams of gain) was estimated as the derivative from Figure D-1 based on carcass data. For poultry, data on total carcass composition at maturity were used and divided by the weight change during growing.
CALCULATIONS AND ASSUMPTIONS FOR TABLE D-3
All calculations were made according to recommendations in the body of this report. Current feeding recommendations were assumed in order to calculate excretion patterns in different types of livestock. These approximations may vary
TABLE D-3 Sample Excretion Predictionsa Directly from Different Types of Food Production Animals
|
Animal Type |
Fecal N |
Urine N |
Fecal S |
Fecal C |
|
Dairy Cattle |
|
|||
|
Small Frame (e.g. Jersey) |
|
|||
|
Lactating, RHAb = 3050 kg |
116 |
100 |
23 |
1739 |
|
Lactating, RHA = 6100 kg |
164 |
143 |
28 |
2260 |
|
Lactating, RHA = 9150 kg |
212 |
186 |
33 |
2780 |
|
Nonlactating, mature |
104 |
101 |
24 |
1726 |
|
Heifers, 200 kg BWc |
44 |
38 |
9 |
698 |
|
Heifers, 375 kg BW |
82 |
98 |
17 |
1253 |
|
Large Frame (e.g. Holstein) |
|
|||
|
Lactating, RHA = 6100 kg |
236 |
202 |
39 |
3232 |
|
Lactating, RHA = 9150 kg |
277 |
236 |
43 |
3684 |
|
Lactating, RHA = 12,200 kg |
318 |
269 |
48 |
4136 |
|
Non-lactating, mature |
114 |
98 |
27 |
1917 |
|
Heifers, 200 kg BW |
59 |
53 |
12 |
911 |
|
Heifers, 375 kg BW |
111 |
133 |
23 |
1671 |
|
Beef |
|
|||
|
Small Frame (500 kg; 1.3 kg/d) |
|
|||
|
Growing (300 kg) |
71 |
59 |
10 |
1118 |
|
Growing (350 kg) |
76 |
57 |
12 |
1255 |
|
Growing (400 kg) |
81 |
52 |
13 |
1391 |
|
Pregnant heifer |
68 |
37 |
14 |
1292 |
|
Cow and calf |
81 |
40 |
15 |
1503 |
|
Large Frame (635 kg; 1.5 kg/d) |
|
|||
|
Growing (380 kg) |
85 |
69 |
12 |
1342 |
|
Growing (440 kg) |
90 |
65 |
14 |
1503 |
|
Growing (500 kg) |
96 |
59 |
16 |
1665 |
|
Pregnant heifer |
89 |
74 |
16 |
1547 |
|
Cow and calf |
106 |
81 |
19 |
1838 |
|
Swine |
|
|||
|
Growing (1-5 kg) |
2.1 |
3.4 |
0.2 |
17 |
|
Growing (5-20 kg) |
2.9 |
6.2 |
0.31 |
25.2 |
|
Growing (20-120 kg) |
10 |
24.9 |
1.10 |
121.7 |
|
Bred sow |
7.5 |
25 |
1.2 |
126 |
|
Lactating sow and piglets |
30 |
113 |
5.1 |
360 |
|
Boar |
8.3 |
33 |
1.9 |
134 |
|
Poultry |
|
|||
|
White Egg Layers |
|
|||
|
Growing (avg. for 20 wks) |
0.19 |
0.83 |
0.039 |
3.3 |
|
Layers |
0.36 |
1.20 |
0.057 |
6.7 |
|
Brown Egg Layers |
|
|||
|
Growing (avg. for 20 wks) |
0.19 |
0.82 |
0.032 |
3.4 |
by up to 30 percent in either direction for specific animal feeding operations, depending on feeding and management practices.
Dairy
Dry matter intake and protein feeding requirements for typically managed animals were determined (NRC, 2001a). Mature body weight was assumed to be 454 kg for small breeds (e.g., Jersey) and 680 kg for large breeds (e.g., Holstein and Brown Swiss). Heifer growth rates were assumed to be 0.5 kg/d for 100-300-kg body weight and 0.6 kg/d for 300-450-kg body weight for small breeds. Growth rates were assumed to be 0.8 kg/d for large breeds. An average lactating cow was defined for each level of herd milk production. The average cow was assumed to be multiparous and 90 days in milk. Milk from small-breed cattle was assumed to be 4.5 percent fat and 3.5 percent true protein, and milk from large-breed cattle was assumed to be 3.5 percent fat and 3.0 percent true protein. Average DMI (dry mater intake) was assumed to be in accordance with National Research Council predictions (NRC, 2001a). Crude protein was assumed to be fed at 8 percent above the average cow’s requirement because producers feed for a higher level of production than the average to avoid the risk of lost milk production from higher-producing cows. At 8 percent above the average cow’s requirements, protein should be sufficient for the 82nd percentile cow. In addition, protein in excess of requirements is fed to account for variation in feed composition. Nitrogen intake was equal to crude protein intake divided by 6.25.
Beef
Dry matter intake and protein feeding requirements for typically managed animals were determined (NRC, 2000). Mature body weight was assumed to be 500 kg for small breeds (e.g., Angus) and 635 kg for large breeds (e.g., Simental). Growth rates were assumed to be 1.3 kg/d for small breeds and 1.5 kg/d for large breeds. Growth rates depend on diet energy and protein concentrations and would greatly affect excretion per day. Mature cows were assumed to be six months, postcalving.
Swine
Dry matter intake and protein feeding requirements for typically managed animals were determined (NRC, 1998a). Growing pigs were assumed to be gaining 320 g lean body mass per day from 20-kg body weight to harvesting. Bred sows were assumed to weigh 140 kg at breeding. Sulfur intake was assumed to be the amount needed to meet the requirements for methionine and cystine. Apparent dry matter digestibility was assumed to be 82 percent, and carbon was assumed to represent 41.5 percent of excreted dry matter.
Poultry
Dry matter intake and protein feeding requirements for typically managed animals were determined (NRC, 1994). For meat animals, the total intake was calculated by week and for the duration of feeding; then the average excretion per day over the course of the entire production time was calculated. Broilers were assumed to be harvested at seven weeks and roasters at nine weeks. Sulfur intake was assumed to be from required sulfur amino acids multiplied by the sulfur percentages of those amino acids. For nitrogen and sulfur retention estimates for turkeys, the same composition per gram of egg was assumed as for chicken eggs, but the egg size was assumed to be 96 g (Siopes, 1999), with an average of 0.8 egg per day.


