
1
The Aviation Community’s Weather Forecast Needs
The operational forecasting and user communities involved with air traffic together represent a diverse group of air traffic managers, air and cargo carriers, and commercial and private pilots. Convective weather forecasting plays a critical role in ensuring the smooth and safe flow of air traffic in this country. The first session of the workshop focused on weather forecast products that the operational forecasting and user communities identified as necessary for improving air traffic control. The specific topics addressed during this session included identification of needs and statement of the problem related to convective weather forecasting, the role and development of the Collaborative Convective Forecast Product (CCFP) to assist air traffic management and strategic planning in the national airspace, and the current status of operational convective weather forecasting.
IDENTIFICATION OF NEEDS AND STATEMENT OF THE PROBLEM
Operational Forecasting Community
During his presentation, James Washington of the Federal Aviation Administration (FAA) Air Traffic System Requirements Service provided background information for the workshop and stressed the following points:
-
Weather accounts for 70 percent of all delays in the national airspace, with convective weather accounting for 60 percent of all weather delays (see Figure 1–1).
-
Convective weather is difficult to forecast.
-
Traffic flow managers need 2 to 6 hours of lead time for effective planning.
Mr. Washington identified the two different timescales for forecasts in air traffic management. Tactical planning relies on forecasts in the 0- to 2-hour time frame. With improved observational capabilities and data assimilation techniques, the forecast skill for this timescale has improved substantially in the past few years, especially for the 0- to 1-hour range. Strategic planning relies on forecasts 2 to 6 hours into the future. The skill for convective weather forecasting in this timescale is very low, though improvements have been made with the advent of the CCFP.
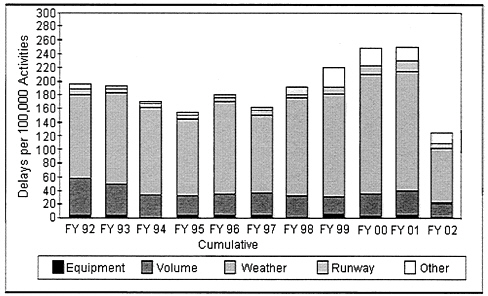
FIGURE 1–1. Cumulative causes of flight delays per 100,000 activities from 1992 to 2002.
Many workshop participants thought that the 5- to 10-year goals for forecast accuracy set by the FAA in preparation for this workshop (desired false alarm rate (FAR) =0.20, desired probability of detection (POD) =0.80, maximal FAR of 0.30, minimal POD of 0.60) were unrealistic based on current forecasting abilities. Thus, Mr. Washington identified the following
alternative goals for operational convective forecasting and challenged the workshop participants to explore how they might be achieved:
-
Achieve a 50 percent increase in forecast skill for the 2- to 6-hour convective forecast in the next 3 to 5 years and another 50 percent increase in the new baseline in the next 5-year period.
-
Augment the operational utility of convective forecasts by reducing the number of multiple and inconsistent forecasts and improving translation of the forecasts into decision aids.
-
Identify standard convective forecast verification approaches.
Industry
Convective weather in the national airspace impacts the flow of air traffic, resulting in large economic costs to business sectors that depend on uninterrupted air traffic flow. During the workshop, Russell Gold of the Air Transport Association (ATA) discussed the economic impacts of convective weather on air cargo carriers, whose industry is a key indicator of economic vitality in the United States. He quoted conservative estimates of the industry-averaged systemwide cost to an individual carrier as being $42 for each plane delayed by weather for one minute. This value represents the direct costs of operating the airplane and does not account for additional costs caused by ripple effects in the system. Furthermore, indirect costs associated with additional on-the-ground labor expenses are approximately $6,000 for a 15-minute delay.
To begin addressing the problem, the airlines and the FAA have formulated a plan that describes their roles and responsibilities regarding convective weather avoidance. Under this plan, national airspace users are charged with identifying areas of weather that should be circumnavigated, and the FAA is charged with managing the demand versus capacity equations in routes that users have communicated their desire to use. One point emphasized by Mr. Gold was that a large number of convective weather initiatives are underway. Duplication and redundancy increase user confusion. The ATA encourages the forecast community to think about ways to integrate these into a single tool for traffic flow management decisions.
Collaborative Decision-Making Process
Given the impact of convective weather on flight operations and the severe economic toll that convective weather exacts on the nation’s passenger and cargo carriers, a joint government-industry program was formed and charged with improving air traffic management using collaborative procedures and technologies. During the workshop, Jack Kies of the FAA described the Collaborative Decision-Making (CDM) process. CDM was designed to enable industry operators and air traffic managers to have similar information about how weather might impact air traffic and to reduce duplication of effort and inefficiencies caused by arriving at the same conclusion through perhaps multiple different processes. Stakeholders, such as airlines and cargo carriers, can provide input into traffic flow management decisions to ensure that their individual needs are met. This process achieves the following objectives: (1) it allows for more equitable use of the national airspace, consistent with the needs of individual users; (2) it improves the transition to normal operations after weather events have cleared; and (3) it produces a comprehensive collaborative plan of action for the national airspace 2 to 4 hours in advance by the members of the strategic planning team. The greatest emphasis of the CDM plans, procedures, and processes is to encourage inclusion of all system stakeholders in the collaborative process, enhance communication and coordination, and provide common reference materials and definition of constrained areas in a collaborative arena.
COLLABORATIVE CONVECTIVE FORECAST PRODUCT
Overview of the System
One of the key accomplishments of the CDM working group was the development of the CCFP in 1996 (with implementation in 1999). The CCFP attempts to provide useful and informative strategic forecasts for operational use. William Cranor of US Airways provided an overview of this product. The CCFP is based on the assumption that forecasts made through collaboration with all stakeholders result in a better decision aid for users and operators. The product is an area forecast based on a 3×3 forecast matrix depicting the predicted coverage of storms and the probability that convective weather will occur during the forecast time. It is now issued 7 days a week, 24 hours a day during the convective season of March to October. From an industry perspective, the CCFP provides a common
beginning point for a strategic planning process to respond to severe weather situations while reducing the need for detailed meteorology discussions during strategic planning. In addition, it provides a qualitative estimate of convection probability and potentially constrained airspace, with a fully collaborative process for production that ensures all stakeholders can participate.
A critical requirement in developing the CCFP was that it provide consistency and reduce the number of competing or conflicting forecasts. Forecasts are required for the 2-, 4-, and 6-hour time horizons. The 2-hour forecasts are critical for tactical traffic flow adjustments and flight route planning and modification. The 4- and 6-hour forecasts are critical for strategic route planning, traffic flow management, and internal airline operations. Mr. Cranor stated that the system is currently limited by a lack of means to amend forecasts, poor knowledge by stakeholders of how to interpret the CCFP, lack of consensus on how to apply the CCFP in low-coverage scenarios, and inappropriate use of the CCFP as a tactical tool. Other limitations and problems include unknown capacity in impacted areas covered by the CCFP, lack of confidence in convection forecasting, and concern that areas with convection below the CCFP thresholds are not considered.
Mr. Cranor suggested that future enhancements of the system include new products to fill the gap between real time and 2-hour time frames, efforts to align the CCFP production schedule with the strategic planning time frame, solutions to address convection below the CCFP thresholds in certain critical areas, and improved training for both product users and producers.
Evaluation and Verification
Evaluation and verification of the CCFP represents a critical step in improving the operational effectiveness of the product. During the workshop, Mark Phaneuf of AvMet Applications International, LLC, described a methodology used to empirically evaluate the operational utility of the CCFP and derive traffic reduction guidelines for operational use. This method selects days when there was no bad weather and no CCFP in order to establish a traffic baseline. The process then selects days when (1) the CCFP was present and bad weather did not develop, (2) the CCFP was present and bad weather did develop, and (3) the CCFP was not present and bad weather did develop. The region of interest was the area around
Chicago, Illinois. The types of reroutes for individual flights were defined as:
-
No reroute: Scheduled, filed, and actual flight routes go through the forecast area and do not differ.
-
Strategic before forecast: Scheduled and filed routes go through the forecast area, and amended routes, filed prior to CCFP valid time, go around the forecast area.
-
Strategic: Scheduled and filed routes go through the forecast area, and amended routes, filed before takeoff or prior to 2 hours before reaching the forecast area, go around it.
-
Tactical: Filed routes go through the forecast area and are amended after takeoff to go around the forecast area.
-
Unclear: Filed routes go around the forecast area or are amended to go through the forecast area after the forecast is issued.
Mr. Phaneuf presented results from applying this classification system to two case studies. For 226 flights on July 19, 2001, a day with a medium probability forecast for convective weather in the vicinity of Chicago, the majority of cases (52 percent) involved no reroute, with tactical (29 percent) and strategic before forecast (13 percent) rerouting being the major reroutes. For 124 flights on May 10, 2001, a day with a low-coverage, low-probability forecast, no reroute made up 81 percent of the actions, with strategic before forecast and strategic reroutes making up 13 and 5 percent of the actions, respectively.
Mr. Phaneuf suggested further steps for evaluation of the CCFP: (1) continued analysis of the type he presented with additional days in each category, (2) correlating the results of his suggested analyses with other validation programs in effect for the same time frame, and (3) establishing empirically derived guidelines for traffic reductions.
Barbara Brown of the National Center for Atmospheric Research also presented information on validating the CCFP, with a focus on statistical and meteorological verification techniques. She described the purposes of verification to be to identify problems, guide improvements, unambiguously measure those improvements, and provide useful information to decision makers and developers. In verification, forecasters and developers should not verify their own forecasts, in part because different users require different types of information about forecast quality. Critical components of verification include statistical and scientific validity, independence of the forecast verification process from the forecast development process, and appropriate matching of forecasts and observations. Ms. Brown identified
several aspects associated with CCFP verification, including choosing the appropriate spatial scale; filtering of the observed and forecast fields; current use of “standard” methods; stratifications based on coverage, height, and probability; and comparison to other forecast products.
Ms. Brown discussed available verification systems that use a grid-based approach, with binary comparison. In this strategy, which is the current standard approach for convective forecasts, forecasts are compared with observations by overlaying the forecasts and the observations for a given grid. This method can be used to compute basic statistics such as POD, FAR, and various skill statistics (e.g., Heidke Skill Score, True Skill Statistic).
In addition to the binary detection statistics, Ms. Brown presented results on the actual weather coverage in the CCFP forecast areas as a function of the forecast time, forecast coverage, and probability of occurrence. In the CCFP for 2001, 92 percent of the 8,433 forecasts indicate low coverage of convective weather. Further, for 97 percent of the cases, the forecasts indicated low or medium probability of convective weather. Analysis of the actual versus predicted coverage suggests some skill in predicting coverage. Overall, the CCFP statistics indicate that the 2-hour forecast has a somewhat higher POD and a slightly lower FAR than the 6-hour forecast. These results showed that 2-hour forecasts (especially those with medium probability) had an actual weather coverage closest to the predicted coverage and that the 4- and 6-hour forecasts generally predicted significantly more weather coverage than actually occurred.
CURRENT STATUS OF OPERATIONAL FORECASTING
Constraints
During his presentation, Fred Foss of the Aviation Weather Center identified current limitations in operational convective forecasts. He first outlined a number of scientific limitations, including limited skill in explicit event description, depictions that do not resolve where the clouds exist, poor understanding of scale interactions, and insufficient spatial and temporal resolution of convection. A second category of limitations pertains to the human-machine interface. Mr. Foss emphasized that humans respond better to visual information transfer than data transfers. However, the time necessary for creating and communicating the forecast images limits the ability to provide useful visual information. Lastly, operational convective forecasts are limited by current observational capabilities, particularly the
lack of spatial and temporal resolution and difficulties in easily assimilating all of the observations into initialization of the models.
Numerical Modeling
Jack Hayes of the National Weather Service presented information about the state of numerical modeling as applied to convective weather forecasting, planned near-term (1- to 3-year) improvements, and potential longer-term improvements. Currently, the National Centers for Environmental Prediction (NCEP) provide two operational weather models: (1) Eta Model forecasts are produced four times a day, out 84 hours into the future, with 12-km resolution, and output provided every 3 hours, and (2) Rapid Update Cycle forecasts are produced eight times a day, out 12 hours into the future, with 20-km resolution, and output provided every hour. Current operational models provide very good descriptions of large organized areas of convection associated with large-scale flow patterns or fronts over hundreds of kilometers and over time intervals of hours to days. However, current models do not predict storm-scale convection, which typically occurs over timescales of 20 minutes to 6 hours with spatial scales of 1 to 5 km. In addition, vertical acceleration of air motion critical to localized convection is not included in the models.
Thus, the current operational models do not accurately predict information required by the national airspace system for decision assistance. Particularly, information such as overall convective coverage, rate of storm growth, storm tops, and probability of occurrence is not produced by the models. These information needs require the human forecast expertise through generation of the CCFP.
In the near term, research and operational forecast models will boast increased resolution and improved physics and dynamics but will see little improvement in observational inputs. NCEP believes that these enhancements will improve model performance to the point of increasing by 15 percent the accuracy of convection forecasting via the CCFP. Indeed, over the next decade, numerical models may have spatial resolutions on the order of 1 to 6 km. This finer resolution requires explicit treatment of clouds, convection, and other physical processes but also observational data of the same resolution. NCEP’s goal, over the same time period, is to resolve thunderstorm events at scales of 3 to 20 km with lifetimes of 2 to 6 hours. However, most agree that only ensemble forecasts will be capable of providing appropriate guidance for such phenomena.


