
Appendix A
Estimation of the Informing Power of an Ion Mobility Spectrometer
The idea of informing power comes from information theory (or entropy). H. Kaiser (1978, reprinted from a 1974 publication) provided an introduction to the use of information theory for evaluating methods in analytical chemistry. Fitzgerald and Winefordner (1975) also described the concept and provided applications to molecular absorption, conventional phosphorimetry, and time-resolved phosphorimetry. Fetterolf and Yost (1984) determined the informing power of various tandem mass spectrometry configurations, incuding GC/QMS, QMS/QMS, GC/QMS/QMS (see Table 2-1).
The informing power, Pinf, of a measuring device is the number of bits required to encode the information potentially available from the device. Supposing, for example, that the device can report one of S possible values, the informing power of the device is log2(S). If the device has a parameter x that can be varied over k possible values x1, … ,xk, and the device is capable of reporting S(xi) measurement values at xi, then the informing power is summed over the k settings, producing
Because of the log term, greater gains can typically be achieved by increasing the number of values for x than by increasing S(x).
If the parameter x can be varied continuously, then Pinf can be reformulated by introducing the concept of resolution for the parameter x, defined as R(x) = x/δx, where δx is the smallest distinguishable difference in x for practical purposes. As introduced by Kaiser, the informing power becomes
There might be a number of simplifications to this expression. It might be that S(x) is constant, S(x) ≡ S, for example when S is fixed by characteristics of the detector. Or, the resolution might be constant, R(x) ≡ R. Another common possibility is that δx is constant. If S(x) ≡ S and R(x)≡ R, then
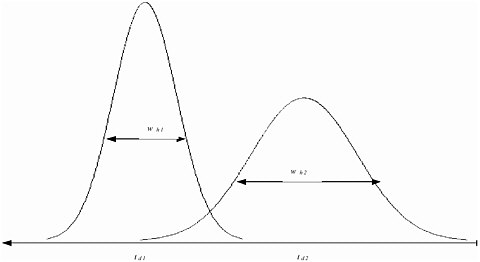
FIGURE A-1 The resolution of two peaks in an IMS spectrum depends on the separation of their drift times and the width of the peaks at half intensity. An important quantity that governs whether two different substances are distinguishable by the drift time is the width of the intensity peaks. This width is quantified by wh, the width at half the maximum height of the distribution. Two drift times, td1 and td2, are distinguishable if |td1 – td2| > 1/2 (wh1 + wh2).
(For chromatographic devices, another common measure of device capability is the number of theoretical plates, N, which is related to the resolution by R = (N/5.55)1/2. The number of theoretical plates is often reported as a constant.)
This general expression for Pinf is easily extended to devices for which multiple parameters can be varied—e.g., for two parameters, x and y:
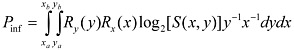
where it is assumed here that the resolution for y does not depend upon the value of x.
For ion mobility spectrometry (IMS), the output is the intensity and the variable parameter (x) is the drift time. The critical quantities, then, are the resolution of the drift time and the precision of the intensity measurements. The resolution of the drift time quantifies the degree of separation required to distinguish different peaks. At drift time t, the resolution is given by R(t) = t/wh(t), where wh(t) is the width of the peak at half maximum intensity, as shown in Figure A-1. (See, for example, Asbury and Hill, 1999; Matz, Tornatore, and Hill, 2001; Clemmer and Jarrold, 1997; Dugourd, Hudgins, Clemmer, and Jarrold, 1997.) The literature supports the assumption that the drift time resolution is constant, R(t) ≡ R. Matz et al. report that R is about 30 for commercial IMS instruments and use R = 36 in their calculations. Asbury and Hill report that for a typical IMS device, the number of theoretical plates rarely exceeds N = 5,000, which corresponds to R = 30.
The number of intensity values that can be reported, S, is also constant. Fetterolf and Yost use S = 212 for mass spectrometry. For IMS, the value of S appears to be less well defined. Often a 12-bit analog-to-digital converter is used, which would imply S = 212 at first glance. However, in practice the number of reproducible intensity values is much less, perhaps as low as 24 (Knapp 2003).
Finally, the value of Pinf depends upon the range of drift times observed. One commercial IMS used in aviation security reports a range of approximately 0 to 15 ms. The literature indicates considerable variation in the drift times observed, depending (as one would expect) on the application and construction of the device (dopant gas, length of drift tube, voltage, gate width, and so on).
The value of Pinf for IMS, then, is approximately
For the comparative calculations in Table 2-1, the value used for Pinf for IMS is 1,000.
REFERENCES
1. Asbury G.R., and H.H. Hill. 1999. Evaluation of ultrahigh resolution ion mobility spectrometry as an analytical device in chromatographic terms, J. Microcolumn Separations 12: 172-178.
2. Clemmer D.E., and M.F. Jarrold. 1997. Ion mobility measurements and their applications to clusters and biomolecules. J. Mass Spectrometry 32: 577-592.
3. Dugourd P.H., R.R. Hudgins, D.E. Clemmer, and M.F. Jarrold. 1997. High-resolution ion mobility measurements, Rev. Sci. Instrum. 68: 1122-1129.
4. Fetterolf D.D., and R.A. Yost. 1984. Added resolution elements for greater informing power in tandem mass spectrometry. Int. J. of Mass Spectrometry and Ion Processes 62: 33-49.
5. Fitzgerald J.J., and J.D. Winefordner. 1975. Information theory and its use to analytical chemistry. Rev. Anal. Chem 2: 299-316.
6. Kaiser, H. 1978. Foundations for the critical discussion of analytical methods. Spectrochimica Acta 33B: 551-576. (Reprinted from a 1974 publication.)
7. Knapp, D.R. 2003. Personal correspondence.
8. Matz, L.M., P.S. Tornatore, and H.H. Hill. 2001. Evaluation of suspected interferents for TNT detection by ion mobility spectrometry. Talanta 54: 171-179.


