
Chapter 4
Environmental Sciences in the LOSLR Study: Wetlands, Species at Risk, and the Integrated Ecological Response Model
The environmental sciences work presented for NRC review includes three subjects: wetlands, species at risk (SAR), and the integrated ecological response model (IERM). Because of the strong linkages and similar issues and strengths among them, these three are evaluated in this chapter as a collective body of environmental science work in the LOSLR Study. The first section of the chapter introduces the environmental science studies and models of the LOSLR Study and notes their accomplishments. The second section evaluates the environmental work in terms of how well they reflect reasonable scientific methods, assumptions, and supported findings. The next section continues the evaluation in terms of how key information is displayed and integrated to understand tradeoffs among candidate regulation plan options. The last evaluative section notes the degree to which the environmental sciences, collectively, are appropriate or sufficient to be used to evaluate regulation plans and determine impacts of water level changes. The chapter concludes with cross-cutting comments and specific summaries for the wetlands, SAR, and IERM work, respectively.
BACKGROUND AND FOCUS OF ENVIRONMENTAL SCIENCES WORK IN THE LOSLR STUDY
The Moses Saunders dam and the current operating plan (Plan 1958DD) have modified the natural dynamics of discharge and water-level fluctuations in Lake Ontario, the St. Lawrence River, and the associated lacustrine and riverine wetlands (IERM 1). These modifications are viewed as contributing to undesirable ecological impacts of the Lake Ontario–St. Lawrence ecosystem (IERM 1, page 3). In response to these and other environmental concerns and as part of an updated plan for water-level and flow regulation, a guiding principle of the IJC Study Board was that “Criteria and Regulation Plans will contribute to the ecological integrity of the Lake Ontario-St. Lawrence River ecosystem” (IERM 1, page 3). The level of funding from Canada and the United States underscores the importance that the IJC places on environmental issues in the LOSLR system. The Study Board’s efforts to incorporate environmental concerns into a regulatory process that most often and acutely focuses on economic and engineering considerations represent one of the notable aspects of the LOSLR Study.
Members of the Environmental Technical Working Group developed and undertook a field research program and literature review to predict the response of selected organisms or groups of organisms (e.g. wetland plants, fish, herptiles, birds and SAR) to water levels and river flows. The wetland, faunal, and SAR field studies led to the development of algorithms that describe relationships among water
level, river flow, organisms, and communities of concern along the Lake Ontario shoreline and up- and down-stream of the Moses Saunders Dam. Organisms in these field studies include an array of birds, fish, herptiles, wetland plant communities and SAR.
The Environmental Technical Working Group also oversaw the development of the Integrated Ecological Response Model (IERM) for ecological assessment of different management plans for the lake and river. Thirty-two Performance Indicators (PIs) were identified to represent the LOSLR system’s ecological response to water levels and flows. The IERM was developed by Limno-Tech, Inc. and Environment Canada to work within the SVM to facilitate comparisons between alternate plans on environmental issues relative to Plan 1958DD.
Documents Presented for Review
The IJC presented the committee with several documents that represent the state of the environmental sciences work. What follows is a list of the documents presented for review; the complete list of documents, including background documents and those distributed at committee meetings, are listed in Appendix B.
Wetlands Documents:
-
W 1 – Wilcox, D. A., K. P. Kowalski, and M. L. Carlson. 2003. Year 3 Report of Relationship between Lake Ontario Water Levels and the Wetlands. Ann Arbor, MI: Great Lakes Science Center, U.S. Geological Survey.
-
W 2 – Evaluation of Water Level Regulation Influences on Lake Ontario and Upper St. Lawrence River Coastal Wetland Plant Communities.
IERM Documents:
-
IERM 1 – Descriptive Documentation; Limno-Tech, Inc. April 2005. Draft Development of an Integrated Ecological response Model (IERM) for the Lake Ontario-St Lawrence River Study.
-
IERM 2 – IERM Model (version 4.1.1)
SAR Documents:
-
SAR 1 – Water Fluctuation Impacts on Species At Risk Cornwall to Pointe due Lac [French]
-
SAR 2 – Lake Ontario Species at Risk Supplement (Least Bittern and Black Tern Reproductive Index Performance Indicators)
-
SAR 3A – Impact of Water Level Regulation on Nearshore Habitat Availability and SAR
-
SAR 3B – (Supplement) Impact on dunes and SAR
-
SAR 4 – Species at Risk Fish Supplement (Year 4 Modeling Group Report)
-
SAR 5 – Lower St. Lawrence Species at Risk Final Report (2005) [French]
ACCOMPLISHMENTS OF THE ENVIRONMENTAL SCIENCES IN THE LOSLR STUDY
One strength of the LOSLR study is the plant community composition analysis at shoreline elevations associated with distinct water level histories. These inventories were repeated in 32 sites around Lake Ontario. The field research appropriately partitioned the sampling site selection across four common hydrogeomorphic wetland types of the Great Lakes: open embayment, protected embayment, barrier beach, and drowned river mouth. Included in the wetland plant studies is a historic imagery analysis of the vegetation communities that have resulted from significant flooding or dewatering events over the last 40 years. Previous Great Lakes research demonstrates that coastal wetlands respond to flooding and the water level of a lake (see summary in Keough et al., 1999).
The SAR studies proved to be a valuable contribution to the state of knowledge of the LOSLR system. They collate an enormous amount of natural history information on species in the study area that often have legal protection status (e.g., species reports in Appendix B of SAR 3A). This information is not readily accessible to the scientific world or the general public.
The development of Target Plots was handled well. The presentation of environmental data using the “Target Plot” was effective in its easy and informative grouping of the Performance Indicator ratios by type (fish, birds, etc.). Target plots allowed a quick but informative method to visualize the impact of a water level plan.
Finally, the speed with which the models were created was impressive. In five short years, a series of wetland models were developed based on empirical data of one of the largest and most complicated aquatic ecosystems in the world. Unlike the hydraulic, flow, and erosion models that have had decades of research and development, application and refinement, ecological models, like the IERM and its sub-models, are in a relatively early stage of refinement and testing. This feat alone will likely provide impetus to ecological science, especially the fields of ecological modeling and restoration ecology, if the science behind the IERM is published in peer-reviewed journals.
EVALUATION OF SCIENTIFIC METHODS, ASSUMPTIONS, AND SUPPORTED FINDINGS OF THE LOSLR ENVIRONMENTAL SCIENCES
The first charge (Charge A) in the statement of task asks the degree to which the studies and models reflect reasonable scientific methods, assumptions, and supported findings. This charge is addressed through three evaluation criteria: em-
pirical foundations, quality assurance, and treatment of risk and uncertainty.
Criterion 1: Empirical Foundations
Empirical foundations of the environmental sciences form the basis for faunal sub-models, environmental Performance Indicators, and ultimately environmental tradeoffs in the SVM. They are discussed in terms of wetland sampling, SAR sampling, missing empirical data, performance indicators, and the ecosystem v. single-species approach to environmental science.
Wetlands Sampling
The wetland vegetation analysis identified four distinct vegetation communities associated with suites of flood/dewater histories within 32 wetlands distributed primarily around the eastern half of Lake Ontario in Canada and the United States: the marsh meadow (not flooded 5-30 years), marsh meadow/emergent mix (not flooded < 5 years or dewatered < 4 years), emergent marsh (not dewatered 4-39 years), and submergent/floating aquatic bed (not dewatered 40 years or more). The Environmental Technical Work Group chose to focus on the marsh meadow as the sensitive indicator. Although undocumented, there are several possible reasons for this decision: the marsh meadow habitat is high in species richness; it is a critical habitat for some wildlife; and the marsh meadow habitat is a typical vegetation type seen in all of the Great Lakes.
Because detailed bathymetry/topography data were not available for the majority of the inventory (IERM 3, pg. 12), physical data collected for the 32 sites were used to derive “typical” wetland geometry for each type. The Environmental Technical Working Group supported this decision based on perceived consistency in the bathymetric configuration within wetland geomorphic types. The total area of each plant category for each geomorphic type was calculated by “simply multiplying the percent cover by the total area of each geomorphic type in the system (W 1).” Validity of this approach implicitly requires that sampled wetlands be (1) selected randomly and (2) demonstrated to be representative of those in the inventory for Lake Ontario and the Upper St. Lawrence River. The key wetland and IERM documents do not indicate how the wetlands were selected for sampling. The 32 “typical” wetlands do not appear to have been chosen randomly nor were they sampled to ensure representativeness of available wetlands by type. Therefore, the validity of applying study results to the entire wetland inventory remains in question.
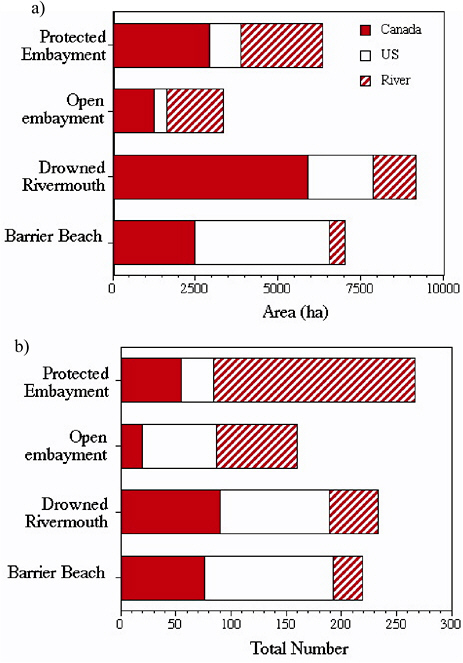
Table 4-1 was prepared using the W1 Appendix A to derive a summary of wetland size and numbers for Lake Ontario and the St. Lawrence River and to examine the degree to which the study wetlands may be representative of the population of wetlands. Figure 4-1 illustrates the distribution of wetland types by area and number along the Canadian and US coast of Lake Ontario and along the St. Lawrence River.
There are very few open embayments in Lake Ontario, and most of these occur in the U.S. and along the river (Figure 4-1). The average size of wetlands in the U.S. ranges from 6 ha for open embayments to 35 ha for barrier-beach wetlands. By comparison, the average size of Canadian wetlands is much larger, 33 ha for barrier-beach to 66 ha for drowned river mouth marshes. The average size of riverine wetlands tends to be intermediate, from 21 to 39 ha (Table 4-1). Compared with what is available, the average size of wetlands sampled in this project was between 19 and 46 ha, generally much larger than the average wetland in the United States, except for the barrier-beach type (Table 4-1). Unfortunately, the degree to which these untested assumptions of representativeness contributed to error propagation is unknown. A thorough analysis of the wetland study should document how well the sampled sites represent wetlands across Lake Ontario and the St. Lawrence River
By consistently sampling only four of each wetland type in each country, the study may have inadvertently biased results in favor of open and protected embayments (see Table 4-1). Simultaneously, this approach may have under-sampled drowned river mouth marshes, especially in the heavily urbanized west end and north shore of Lake Ontario. A rough estimate using the inventory (Appendix A of W2) showed 37 wetlands that could be described as urbanized, and these accounted for 970 ha. In addition, wetland size should be considered in any sampling scheme as wetland area may be an important factor in vulnerability to perturbation and may be important to a site’s function as wildlife habitat.
Wetlands sampling was limited to a minimum depth of 74.25 m above sea level (asl) (IERM 3, p. 12). However, the typical profiles developed for the four geomorphic types included depths from 73.00 to 75.75 m asl (IERM 1 p. 21). From the existing documentation, it is difficult to ascertain how the Environmental Technical Working Group assigned plant information to depths between 73.00 and 74.25 m. This sampling regime appears to have under-sampled the submersed aquatic vegetation (SAV), since sampling only included depths <1.0 m. By not sampling in deeper waters, the study excluded many of the submergent species in the high-quality wetlands, and this may explain why there are fewer than 10 common SAV species in Tables 4, 6, 8 and 10 in W2. Had the study expanded its sampling effort to survey more of the deeper aquatic habitat, a more representative suite of species of submergent species would likely have been reported. The current sampling methods likely underestimated the diversity of submersed vegetation and available fish habitat.
Many of the habitat models used to develop the SAR Performance Indicators rely on predictions of wetland vegetation, including submergent vegetation. All of these Performance Indicator models will be vulnerable to the same criticisms that have been made of the wetland vegetation models and vegetation sampling methods, such as sampled wetlands are not statistically representative of wetlands in the LOSLR; submergent vegetation appears to be undersampled; and there are limited linkages between bathymetric changes and vegetation models. Error from wetland sampling deficiencies may be propagated through the SAR material, through the IERM, and into the SVM. This is a serious limitation to the credibility of these SAR Performance Indicators.
TABLE 4-1 LOSLR Wetland Study Sites in U.S. and Canada in Comparison to Total
|
Category |
Barrier Beach |
Drowned River Mouth |
Open Embayment |
Protected Embayment |
|
All U.S. wetlands (ha) |
4,046.25 |
1,961.01 |
386.2 |
937.97 |
|
Total # US wetlands |
117 |
99 |
67 |
29 |
|
All Canadian wetlands (ha) |
2,485.56 |
5,908.06 |
1,235.89 |
2,915.49 |
|
Total # Canadian wetlands |
76 |
90 |
20 |
55 |
|
All SL River wetlands (ha) |
469.98 |
1,288.17 |
1,714.41 |
2,498.20 |
|
Total # SL River wetlands |
26 |
44 |
73 |
183 |
|
All wetlands in LO (ha) |
6,531.81 |
7,869.07 |
1,622.09 |
3,853.46 |
|
Total # wetlands in LO |
193 |
189 |
87 |
84 |
|
All LO + SL river wetlands (ha) |
7,001.79 |
9,157.24 |
3,336.5 |
6,351.66 |
|
Total # wetlands (LO + SL River) |
219 |
233 |
160 |
267 |
|
Average size of wetlands in US (ha) |
34.58 |
19.81 |
5.76 |
32.34 |
|
Average size of wetlands in Canada |
32.71 |
65.65 |
61.79 |
53.00 |
|
Average size of riverine wetlands (ha) |
31.97 |
39.30 |
20.85 |
23.79 |
|
Average size of wetlands sampled in LO |
33.84 |
41.63 |
18.65 |
45.87 |
|
Area of wetlands sampled in LO (% of total) |
837 (12.8%) |
1,443 (18.3%) |
882 (54.4%) |
949 (24.6%) |
|
No. of wetlands sampled in LO (% of total) |
8 (4.1%) |
8 (4.2%) |
8 (9.2%) |
8 (9.5%) |
|
No. of wetlands sampled in US (% of total) |
4 (3.4%) |
4 (4.0%) |
4 (6.0%) |
4 (13.8%) |
|
No. of wetlands sampled in Canada (% of total) |
4 (5.3%) |
4 (4.4%) |
4 (20.0%) |
4 (7.3%) |
|
Note: Regrouping of original data presented in Appendix A of W2 to evaluate the degree to which the 32 study sites were representative of available wetlands in both countries and in the St. Lawrence River. Numbers in bracket are percent (%) of total wetlands in all of Lake Ontario, or only in the Canadian or U.S. portions of Lake Ontario, as appropriate. Statistics on sampled wetlands were taken directly from IERM 3 (Table 2, p. 12). |
||||
External Environmental Stressors
The models and Performance Indicators seem to consider wetlands as discrete elements, when in fact, wetlands reflect attributes of their surrounding aquatic and upland systems. Surrounding uplands areas can be a major determinant of wetland structure and function through impacts to the physical and biotic aspects of wetland ecology. Without taking these external forces and stressors into account, the IERM cannot be used to predict the combined effects of water-levels and other stressors such as deterioration in water quality, adverse impacts of exotic species (Lougheed et al., 2004; Wei and Chow-Fraser 2006) and urban encroachment, that are known to affect the re-establishment of different types of aquatic vegetation (Chow-Fraser et al., 1998; Wei and Chow-Fraser, 2005). For example, there are heavily urbanized wetlands in western and northern Lake Ontario (see Cootes Paradise Marsh in Chow-Fraser 2005; Frenchman’s Bay in Eyles et al., 2003), where currently there are no wet meadow communities due to urban encroachment. The sampling program could have been additionally stratified to account for the effects of altered land uses (i.e. urban and agricultural development) on plant distribution, so that results could have been incorporated into an adaptive management model.
In all, the wetlands sampling effort was broad, but should have been carried out to reflect availability of the four geomorphic types rather than having all four types being equally represented in the study set. The number of wetlands to be sampled should have been determined through a power analysis, and then the sites should have been chosen randomly from the Lake Ontario wetland inventory.
SAR Sampling
The field data collected during the LOSLR studies are very limited and were obtained only over a few field seasons (see SAR 1 and SAR 3A for lists of species at risk considered for the study). The limitations appear in several aspects of the SAR work. For example, many SAR exhibit substantial inter-annual variation, which would not be captured by field studies of short duration (and, in some cases, single visits to a site). Other SAR were excluded from analysis because they do not occur in the study area currently. Intuitively, excluding species from analysis would seem correct; however, this may prove to be a shortsighted choice since a stated purpose in developing a new water regulation plan is to reduce environmental degradation due to water level management and, presumably, restore some missing species. Certainly, it is more difficult to predict responses to water level management for species which have not been observed in the study area, but this may be no greater a limitation than reliance on only a handful of observations, which is already the case for some of the SAR for which Performance Indicators have been developed.
Performance Indicators
Performance Indicators employed in the LOSLR environmental science work are often indirect measures of integrity of a community such as wetland area. In most cases, it is not clear why these metrics were chosen when more conventional, ecological assays, such as diversity, biomass, or productivity remain viable metrics. For example, the various plant Performance Indicators are based on the areal depth available for growth (available suitable habitat) for a community at a given lake level. Implicit in this Performance Indicator is the assumption that lake level area is directly related to species abundance, productivity or species diversity. Defense of this approach is needed in the environmental documentation because a large body of research shows that a number of different physical and biotic factors in addition to hydrology affect species distribution and growth (Hupp, 2000; Naiman et al., 1993; Pollock et al., 1998).
Two different approaches were used to develop performance indicators (Table 4-2) for the wetland sub-models, one for the Lake Ontario-Upper St. Lawrence, and another for the Lower St. Lawrence (IERM 1, p.12). The Lake Ontario-Upper St. Lawrence approach (IERM 1 p.12) relied on information from 32 “typical” wetland sites that represented equally the four geomorphic types (barrier beach, drowned river mouth, open embayment and protected embayment). The wetland Performance Indicator reflects the average total area of each vegetation community (specifically meadow marsh; IERM 1, p. 24) that occurred in the 32 sample sites. These sites were extrapolated to an inventory of wetlands within Lake Ontario-Upper St. Lawrence that were classified according to geomorphic type. By comparison, the Performance Indicator for the Lower St. Lawrence was based on a comprehensive digital elevation model that covered the Lower St. Lawrence channel and the entire floodplain for Lake St. Louis and the reach from Montreal Harbor to Lake St. Pierre. The model framework was linked to a flexible database system, which allowed calculation of relevant physical and biological information including vegetative cover of treed swamp, shrubby swamp, prairie meadow, shallow marsh, deep marsh, open water, and invasive prairie meadow, total wetland area, as well as surface area of several ecologically important submergent aquatic plant species (IERM 1, p. 18). Node results computed by the 2-D model were stored in the database system and were aggregated to provide summaries of model output for key locations in the LSL system.
The dune-barrier beaches report nicely describes the dune-barrier beaches; it even documents the report’s shortcomings. It was not clear why there was no Performance Indicator developed to represent this habitat or its characteristic species, many of which are SAR. Failure to include barrier beaches and dunes misses an opportunity to consider species and habitats associated with them, particularly along the southern coast of Lake Ontario, where loss of barrier beaches and dunes will also jeopardize wetlands that are presently protected by them.
TABLE 4-2 Key Ecological Performance Indicators
|
SVM ID |
Performance Indicator Group |
Description (Region) |
Units |
|
E1 |
Vegetation |
Wetland Meadow Marsh Community–total surface area and supply based (Lake Ontario) |
ha |
|
E2 |
Fish |
Low Veg 18C – spawning habitat supply (Lake Ontario) |
ha-days |
|
E3 |
Fish |
High Veg 24C – spawning habitat supply (Lake Ontario) |
ha-days |
|
E4 |
Fish |
Low veg 24C – spawning habitat supply (Lake Ontario) |
ha-days |
|
E5 |
Fish |
Northern Pike – YOY recruitment index (Lake Ontario) |
index |
|
E6 |
Fish |
Largemouth Bass – YOY recruitment (Lake Ontario) |
index |
|
E7 |
Birds |
Virginia Rail (RALI) median reproductive index (Lake Ontario) |
index |
|
E8 |
SAR |
Least Bitten (IXEX) – median reproductive index (Lake Ontario) |
index |
|
E9 |
SAR |
Black Tern (CHNI) – median reproductive index (Lake Ontario) |
index |
|
E10 |
SAR |
Yellow Rail (CONO) – preferred breeding habitat coverage (Lake Ontario) |
ha |
|
E11 |
SAR |
King Rail (RAEL) – preferred breeding habitat coverage (Lake Ontario) |
ha |
|
E12 |
Fish |
Low Veg 18C – spawning habitat supply (Upper St. Lawrence) |
ha-days |
|
E13 |
Fish |
High Veg 24C – spawning habitat supply (Upper St. Lawrence) |
ha-days |
|
E14 |
Fish |
Low Veg 24C – spawning habitat supply (Upper St. Lawrence) |
ha-days |
|
E15 |
Fish |
Northern Pike – YOY recruitment index (Upper St. Lawrence) |
index |
|
E16 |
Fish |
Largemouth Bass – YOY recruitment (Upper St. Lawrence) |
index |
|
E17 |
Fish |
Northern Pike – YOY net productivity (Upper St. Lawrence) |
grams/ha |
|
E18 |
Birds |
Virginia Rail (RALI) – median reproductive index (Lake St. Lawrence) |
index |
|
E19 |
Mammals |
Muskrat (ONZI) – house density in drowned river mouth wetlands (Thousand Islands area) |
number/ha |
|
E20 |
Fish |
Golden Shiner (NOCR) – suitable feeding habitat surface area (Lake St. Louis to Trois-Rivières) |
ha |
|
E21 |
Fish |
Wetlands fish – abundance index (Lower St. Lawrence) |
index |
|
E22 |
Fish |
Northern Pike (ESLU) – suitable reproductive habitat surface area (Lake St. Louis to Trois-Rivières) |
ha |
|
E23 |
Birds |
Migratory wildfowl–floodplain habitat surface area (Lake St. Louis to Trois-Rivières) |
ha |
|
E24 |
Birds |
Virginia Rail (RALI) – reproductive index (Lake St. Louis to Trois-Rivières) |
index |
|
SVM ID |
Performance Indicator Group |
Description (Region) |
Units |
|
E25 |
Birds |
Migratory wildfowl – productivity (Lake St. Louis to Trois-Rivières) |
number of juveniles |
|
E26 |
Birds |
Black Tern (CHNI) – reproductive index (Lake St. Louis to Trois-Rivières) |
index |
|
E27 |
Herptiles |
Frog sp. – reproductive habitat surface area (Lake St. Louis to Trois-Rivières) |
ha |
|
E28 |
Mammals |
Muskrat (ONZI) – surviving houses (Lake St. Louis to Trois-Rivières) |
number of houses |
|
E29 |
SAR |
Least Bittern (IXEX) – reproductive index (Lake St. Louis to Trois-Rivières) |
Index |
|
E30 |
SAR |
Easter San Darter (AMPE) – reproductive habitat surface area (Lake St. Louis to Trois-Rivières) |
ha |
|
E31 |
SAR |
Spiny Softshell Turtle (APSP) – reproductive habitat surface area (Lake St. Louis to Trois-Rivières) |
ha |
|
E32 |
SAR |
Bridle Shiner (NOBI) – reproductive habitat surface area (Lake St. Louis to Trois-Rivières) |
ha |
Only limited information on Performance Indicator models is presented in the English summaries of SAR 1 and SAR 5. In one of three cases where the same SAR is included in both the lower river (SAR 1 and 5) and upper river and lake documents (SAR 2) (Least Bittern), it appears that the structure of the models for both regions may be similar. It is not clear whether separate data or separate expert judgments were used to parameterize the models for different regions. In the other two cases (Spiny Softshell Turtle in SAR 5 and SAR 3A, and Bridle Shiner in SAR 5 and SAR 4), the Performance Indicator models appear to be different for the two regions, but it is unclear whether different structures are based on differences in data availability or differences in habitat responses in the two regions. Furthermore, Performance Indicator ratios are calculated for rate processes, biomass, area, etc., using different units of measure. Nowhere in the documentation are these different units reconciled, resulting in different Performance Indicators being based on different units. A discussion is needed about how the calculation of Performance Indicator ratios using different base units (biomass, rate process, etc.) may affect error statement and certainty.
The Environmental Technical Working Group collapsed several hundred Performance Indicators in the IERM to 32 (Table 4-2). The collapse to 32 Performance Indicators is viewed as reasonable, but the rationale behind the number 32 needs to be explained. In the illustrative case of the SAR Performance Indicators, it is sensible to reduce the original list of Performance Indicators to concentrate on those most likely to be affected by water level regulation, and then to narrow that list further to retain as indicators SAR that can “represent” a suite of other species expected to respond similarly. However, the criteria used to reduce the lists at each stage need to be stated more explicitly. The reductions also need to be justified in
terms of what is known about the natural history and population dynamics of the SAR. These issues are discussed in Appendices C and D of SAR 3A for Lake Ontario and Upper St. Lawrence SAR, but are lacking from most of the other SAR documents. Because of issues of validation, error propagation and sensitivity, the use of all 32 Performance Indicators (32) would provide a better interpretation of environmental effects for a plan, and the reasons for deciding against the larger number of Performance Indicators should be better explained.
The environmental Performance Indicators were designed to allow relative rankings of plan alternatives (ordinal measurement scale) rather than to predict absolute levels of SAR population responses to water level regulation (ratio measurement scale). This is a sensible goal, particularly given the limited data and limited understanding of the needs of many SAR. However, when they are subsequently integrated with the other metrics used to evaluate alternatives, environmental Performance Indicators must also provide information on how much better or how much worse one plan is compared to another (interval measurement scale); otherwise, it will not be possible to evaluate tradeoffs among environmental Performance Indicators and between environmental Performance Indicators and those that are expressed in monetary units.
Ecosystem vs. Single-Species Approach
In general, the wetlands work and the IERM use a single-species approach rather than an ecosystem approach. A single-species approach focuses on the reaction of an organism to lake level or river flow. An ecosystem approach considers processes that transcend individual species and indicate integrity of the ecosystem as a whole, such as supra-specific measures like total site biomass and net primary production. An ecosystem approach can also account for the presence and abundance of organisms, diversity and composition of plant and animal communities, and their reactions to other stressors in the LOSLR environment, such as contaminants, inter-specific competition, invasive species, nutrients and sediment supplies from the watershed, climate change, and other fisheries stocking and harvesting practices. Omission of the effects of these other stressors in the LOSLR study may compromise the interpretation provided in the Shared Vision Model. The current design of the IERM (and the SVM) makes it very difficult to separate the effects of these and other stressors from effects due to water regulation alone.
Sometimes, ecosystem-oriented approaches fail to account fully for species with special requirements not captured in the ecosystem-level model. For situations where field data on individual species requirements are limited, as is the case for many of the SAR in this study area, protecting and monitoring essential ecosystem features (such as dune processes) may be an effective and efficient strategy for protecting SAR (Franklin, 1993). Monitoring ecosystem features, supplemented by selected monitoring of individual SAR status, would provide the feedback necessary to assess the merits of whichever water regulation plan is implemented.
There are two Performance Indicators that embrace an ecosystem approach.
The wetland marsh meadow Performance Indicator is one, as it is a community metric with clear relationships to environmental conditions. Another example of an ecosystem approach in the environmental documents is the report on dunes and SAR for the Eastern Lake Ontario Barrier Complex (SAR 3B). This document supports an ecosystem-oriented, rather than single-species oriented approach to evaluation of impacts on SAR. An ecosystem-approach is recommended with supplemental monitoring of individual species.
Criterion 2: Quality Assurance and Quality Control
Quality Assurance/Quality Control (QA/QC) in the environmental sciences provides ways to validate study and model results and a means to ensure that results are accurate and reliable. QA/QC does not appear to have been instituted for the LOSLR Study. In general, information on validation, calibration and verification presented on various algorithms in models is weak or non-existent for wetlands, SAR, and the IERM. Initial formal direction from the Study Board on QA/QC could have reduced concerns about the lack of validation and significance-testing that pervades the work in this component of the LOSLR study.
Validation
IJC materials did not describe any independent validation of the IERM in Lake Ontario, the St. Lawrence River, or elsewhere in the Great Lakes. In fact, the statements are repeatedly made in reviewed documents that “No calibration data are available,” “No specific validation data sets are available” (IERM 3). During the question/answer sessions with the Environmental Technical Working Group representatives at the first committee meeting, no further information was provided about calibration or validation exercises. This lack of validation makes it impossible to comment on the accuracy of predictions.
An assumption is built into the IERM model that cattails will be reduced with draw-downs over time. This hypothesis needs to be experimentally verified to complete the wetland investigations. This verification is keenly needed because there is published evidence to the opposite effect: cattail distribution has been shown to increase with low water levels in Cootes Paradise Marsh, a large urban marsh at the western end of Lake Ontario (Chow-Fraser 2005; Wei and Chow-Fraser 2005; 2006). Literature also shows that Typha species have broad environmental tolerance and are excellent competitors. Recent expansion of invasive species, such as Phragmites australis, into the sedge meadow under similar conditions have also been noted (W1). Both of these situations would result in an expanded emergent rather than sedge-meadow zone. The marsh meadow hypothesis needs additional testing to be validated. The previous IJC Water Levels Reference Study (early 1990s) (Wilcox et al., 1993) may provide valuable data that could be used to validate the current Lake Ontario wetland results, and such test-
ing is needed to demonstrate the quality of the analysis and the certainty of forecasts.
Aerial photo analyses were used as part of the wetland empirical exercises. Aerial photographs indicate that emergent marsh and especially cattail (Typha angustifolia) are favored by flooded conditions and by relatively stable inter-annual patterns of lake level and climate in Lake Ontario. The study would benefit from a quantitative analysis of the historic series of aerial photographs.
For most SAR modeled, there are no data available for quantitative model validation and no qualitative validations are offered (other than the statement “accurate for relative comparisons,” without further elaborations). In the few cases where quantitative validation was attempted, the results often are not presented clearly or are not convincing. For example, the prediction rate for Least Bittern nest habitat is stated to be 75.6 percent, but it is not clear what “prediction rate” means. For Yellow Rail, two nests were available for validation. One nest 215 m away from predicted nesting habitat is described as “very near” and the other was 375 m away. This “near” value is not convincing.
The quality of the wetland results would be strengthened if the authors had provided more information on the precision of elevation measurements, waterlevel measurements (including seiche effects), and the accuracy and precision of vegetation measurements and identifications. Although the vegetation zones are sufficiently distinct and the relationship to flooding sufficiently strong that some variation would not likely have changed the results, an explicit explanation of sources of variation is needed to demonstrate confidence in the results.
Inconsistent Terminology
Variable use of terminology presented confusion in some of the environmental science documents. Prediction of wetland area as a function of water level was verbally reported as excellent; uncertainty for the algorithms for fish, birds and SAR was verbally reported as high. In no place in the documents are “excellent” or “high” given quantitative values. A substantive set of concerns was raised by the use of the term “precautionary principle.” The phrase is used in a non-standard way in the confidence ratings in SAR 5, with no apparent relation to the usual meaning in the literature (Lauck et al., 1998). The same phrase is used in SAR 2 to give “conservative” Performance Indicators, but the meaning of this statement is not clear. Based on verbal descriptions of “conservative,” the approach taken may actually be the opposite of the understanding of the precautionary principle as applied to environmental decision making in the literature. Other terms present confusion in the environmental documents, as well. SAR Performance Indicator models refer to “rapid” rises in water levels, but “rapid” is not defined. Likewise, “stranded” is used in the wetlands documentation, but needs further clarification, in terms of how stranding occurs under different water level scenarios and how these impact species of interest, such as the northern pike.
Environmental Technical Working Group scientists provided ratings of confi-
dence in the IERM and some sub-models. Confidence ratings are important, standard practice. Confidence ratings are particularly useful in cases that expert opinion helped develop habitat models, as in this case. Unfortunately, in this case, the ratings provided appear to be largely “boilerplate,” with the same phrases repeated for each species and with no evidence offered for the ratings being “accurate for relative comparison.” For example, the Yellow Rail Performance Indicator is rated as “allowing for relative comparison” and, in the same paragraph, as “should not be used as a key indicator” due to limitations in information or partial failure of validation. Without explanation, these judgments appear contradictory. In the appendices of SAR 3A, similar discussions are labeled “Risk and Uncertainty Assessments,” rather than “Confidence.”
SAR 2 and SAR 5 appear to come to the opposite conclusion based on similar types of models and data. Such contradictory assessments illustrate the need for well-defined and consistent standards for judging reliability, especially when those judgments are qualitative. It is helpful to comment on the sensitivity of the SAR Performance Indicators to water level regulation, as is done in the appendices to SAR 3A for at least some SAR. Terminology should be consistent with standard usage, defined and clarified in the environmental sciences documentation.
Criterion 3: Treatment of Error and Uncertainty
Like quality control issues, a formal method to test for error and uncertainty was not documented for field investigations or simulations. In general, information on error propagation, risk, and uncertainty is weak or non-existent for SARs, wetlands and the IERM, and IJC documents note that “…cumulative uncertainties have not been estimated” (IERM 3). Deficiencies in the treatment of error and uncertainty were identified with respect to methods used in wetland sampling, SAR analyses, and creation and selection of Performance Indicators (see Criterion 1: Empirical Foundations).
IJC documents describe a 10 percent change rule to convey significant variability associated with environmental Performance Indicators. No written documentation exists on how the 10 percent rule of significance was achieved, although verbal comments in the committee meeting open session suggested that it was selected without scientific or practical justification. According to the oral comments, ecological index and Performance Indicator ratios are based on the “board’s professional judgment,” and not derived from traditional statistical methods. An “administrative decision” was made to accept a 10 percent change as a significant difference for the environmental indicators. In other words, LOSLR staff is using this 10 percent rule to assign value to an effect size that is best described as a non-statistical choice about what difference is big enough to influence a particular decision. This is an area of major uncertainty for the decision making process in the SVM via the IERM. A better explanation about error and uncertainty is
needed to convey confidence in the environmental sciences results for LOSLR decision making.
Because decisions about water level regulation will be based, in part, upon the environmental sciences information, the IJC needs a high level of confidence in the conclusions derived from the myriad of models produced. The environmental sciences work presents an illustrative example of how error could be introduced and propagated throughout the LOSLR study structure. Since the faunal submodels for fish, wetland birds, muskrat, and herptiles were completely or partially dependent on habitat information derived from the wetland plant sub-model, the wetland Performance Indicator strongly impacts all those models and assumptions based upon it. Flaws in empirical foundations—wetlands representativeness, missing or limited empirical data—will influence the IERM and the predicted outcomes of the SVM. Without a clear discussion or description of estimates of error or uncertainty, the degree to which the SVM reflects these flaws cannot be determined. The overarching concern of error and uncertainty in the environmental sciences is how error is propagated from the wetlands and SAR sampling methodologies into the Performance Indicator development and through use in the IERM and SVM.
INTEGRATION AND DISPLAY OF KEY INFORMATION
The second charge (Charge B) in the statement of task looks to understand how well the studies and models integrate and display key information needed for a comprehensive evaluation and understanding of the tradeoffs for selecting among the candidate RPOs. Four evaluation criteria are used to address this charge: linkages among related studies and models; temporal scaling resolution; documentation; and efficient communication to decision makers.
Criterion 4: Linkages and Feedback among Related Studies and Models
The environmental science work in the LOSLR Study, at least the contents presented for this review, use data and sub-models generated from the empirical wetland and SAR work in the IERM. The IERM, in turn, is used as a sub-model in the SVM as a means to present integrated environmental information. Linkages among the wetland, SAR, and IERM efforts are important for accurate interpretation and representation in the SVM and ultimately, in the regulation plans, themselves. Furthermore, linkages between the wetlands work and the FEPS model may also be important, as some of the physical, geomorphic properties of wetland habitat (such as dune- and barrier beach wetlands) can be strongly influenced by wave erosive action. The biophysical underpinnings needed to develop Performance Indicators for barrier beach wetland complexes are severely compromised by failure of the FEPS model to include accretion of dunes and protective effects of dunes and barrier islands on other parts of the shore. The development of a barrier
beach Performance Indicator with linkages between the IERM and FEPS models appears imperative.
Linkages among SVM components could strengthen the integration and display of key information in the LOSLR Study. The FEPS model (see Chapter 3) developed scenarios to predict the response of the coastal lake bottom to various storms and outflow management options. These results might have been applied to the wetland studies. Alteration of bathymetry at the lower portion of wetlands may impact the rate of response of vegetation to water level change, not just in the lowest portion of a site but potentially in upper elevations if base level is altered. Wetland researchers should collaborate with the shoreline modelers to develop bathymetric scenarios for wetland sites.
The protected barrier beach wetlands of Lake Ontario comprise a major hydrogeomorphic community and are included in the wetland empirical work, but not integrated into the FEPS, IERM, or SVM models. A Performance Indicator exists for barrier beaches and sand dunes, but “no algorithm or economic calculations were developed for the FEPS due to inability of modeling sandy shore evolution over very long time periods” (Baird and Associates [no date], Barrier Beaches and Dunes, Performance Indicator Summary, Coastal Working Group). Evidence exists, however, that barrier beaches are being eroded away along the southern shore of Lake Ontario at Hamlin Beach State Park (Makarewicz et al., 2000; NYORHP, 1998), as armoring efforts are underway. The omission of barrier beach wetlands from the IERM and SVM could result in the detriment of an important hydrogeomorphic type and a NYSDEC protected wetlands along coastal Lake Ontario. The LOSLR environmental science work depends on the ability of the FEPS model to provide the type of information needed by the SAR and IERM work, and the connections between FEPS and environmental work need strengthening or better documentation.
Criterion 5: Spatial and Temporal Resolution and Scaling
The quarter month time step (see Chapter 2) presents challenges to achieve temporal resolution compatibility among different aspects of the LOSLR Study. Quarter month time steps were chosen for purposes of hydrologic/hydraulic models and the SVM (see Chapter 2), but the quarter month time step may be too coarse for biological applications. Temperature is a key stressor affecting fish reproduction in the St. Lawrence River, and it is considered as a stressor in LOSLR fish model(s). Fish models use a “daily” temperature time step for effects of water level and flow on spawning and early life histories. However in the IERM, there was a simplification of the IERM fish component, whereby a quarter month time step was introduced. Little or no information was provided on the rationale or impact of changing the time step from daily in the sub-model to quarter-monthly in the IERM. The accuracy of the IERM may be compromised by this discrepancy in time step. The type of explanation required to evaluate this scientific outcome would include:
-
What is the daily variation in temperature compared to the quarter-monthly?
-
Why did the fish population sub-model use a daily step but the IERM use a quarter-monthly step?
-
What effect, if any, did this simplification of the model have on projected results?
Time scale resolution presents a similar concern for the use of quarter-monthly time steps for some bird populations. Rapid rise in water level is listed as an important hydrologic factor for some birds (IERM 1). Fan and Fay (2001, Variation of St. Lawrence River Hourly Water Levels about the Quarter-Monthly Mean, pages 8 and 9) point out that river level variation can be quite high during the spring freshet: “at Betancour, the daily level typically varies within + 25cm from its quarter-monthly level, but can be as much as 80 cm higher or 50 cm lower year round.” At Batiscan, daily levels can be 100cm higher or 70 cm lower than quarter monthly estimates. Drolet et al. (in IERM 1) report that eggs and chicks of the Virginia Rail are susceptible to drowning due to water level fluctuations. In fact, a rate of greater than 20 cm is suggested as being important, but the rate for this 20 cm rise is not noted (i.e., should have been represented as per day, per week, or per month). Assuming that the rate is 20 cm per day, the quarter-monthly time step is not acceptable because it is far too coarse. Similar situations are described for the Least Bittern and Black Tern. Temporal scales need to be consistent between the empirical studies and models used in the IERM and subsequently in the SVM.
Although the IERM 1 presented the ‘typical wetland geometry profiles’ (Figure 2-2, p. 22), there was no additional information to determine variability around the individual curves, and no attempt was made to validate these with an independent wetland subset from LO-USL. Since wetland size can affect a wetland’s vulnerability to perturbation and to a site’s function as wildlife habitat, more attention must be paid to ensure that results for larger wetlands can be extrapolated directly to smaller ones in other geographic reaches of the Lake Ontario shoreline.
Criterion 6: Thorough Documentation
Documentation presented serious problems for a thorough understanding, and therefore evaluation, of the wetlands, SAR, and IERM work. Some of the documentation problems stemmed from the review documents themselves. Draft reports, rather than completed reports, of much of the environmental sciences work were provided to the NRC committee, conveying that additional refinements would be forthcoming. Unfortunately, whole sections were missing from some of these draft documents. For example, in the IERM - 4 User’s Manual entitled “The IERM Criteria Evaluation” was listed as not yet functional. Documentation was missing that clarified (1) who was responsible for the work; (2) what were the scope
and plans for completing incomplete work; and (3) the timeline for work completion. At present, such calibration and documentation do not exist.
Specific examples of insufficient documentation on environmental sciences are given throughout this chapter. Major points of concern focus around inadequate documentation of: (1) wetlands and SAR sampling choices; (2) choice of Performance Indicators in lieu of more traditional ecological assays; (3) methods to select and eliminate Performance Indicators in reducing the number from several hundred to 32; (4) resolution of temporal and spatial scales; and (5) treatment of error and uncertainty, and documentation should be provided for these areas of concern.
Criterion 7: Effective Scientific Communication
Ecological Indexing
Indexing is a common practice in ecological sciences, used to present multi-variate information in a simplified way. When done correctly and under appropriate conditions, indexing can be effective in conveying complex, intricate information. Still, indexing poses specific problems in the LOSLR Study. The Environmental Technical Working Group developed the single “Index of Ecological Integrity” (IJC, Draft Report), by collapsing the 32 key Performance Indicators into a single value that is a weighted average (group-weighted, region-weighted). As pointed out by Limno Tech (IERM 1), “it is important to note that the overall index of ecological integrity provides an overview of the key Performance Indicator results, but the index by itself should not be considered sufficient to evaluate and rank plans [italics added].” Rather, the entire suite of 32 key Performance Indicators should be used for comparison of plans in matrix and graphic formats such as the Target Diagram.
This review agrees that the Index of Ecological Integrity should not be used to evaluate potential regulation plans for at least two reasons. One reason is that the “Index of Ecological Integrity” is an oversimplification and has to be viewed with considerable caution. Forming an index assigns weights on the various components that go into the index, and these weights express priorities among Performance Indicators. The weights used to form the environmental index are hard to locate in the Board Room, and no justification is offered for differences in the weights that were assigned to regions, to groups of species or to individual species. The weighted priorities are elements of preference or value models, which vary among stakeholder groups.
Another reason is that a single index forces the same value model on all groups. Individual results of environmental Performance Indicators respond differently to variations in water regulation plans, and a single index will obscure these differences. Perhaps this concern is best illustrated by the example of the Moses Saunders dam. River segments, including the reservoir, upstream of the dam differ
significantly from segments downstream of the dam. The problem with the simplified index is that a single value will be used to express conditions both above and below the dam. This example is stark, but this concern of obscuring important differences extends to plant and animal Performance Indicator values, as well. Furthermore, whether intended or not, it will be the tendency for non-scientists to use this single index value to evaluate all environmental issues. For these reasons, the use of the Index of Ecological Integrity is not recommended for purposes of the LOSLR Study.
OVERALL APPROPRIATENESS AND SUFFICIENCY OF ENVIRONMENTAL SCIENCE TO INFORM REGULATION PLAN OPTIONS
The third charge (Charge C) in the statement of task is aimed at determining whether the IJC documents presented for review are appropriate and sufficient for use in selecting a water regulation plan option. Three evaluation criteria are used to address this charge: the study scope and aims, balance between scientific and practical professional judgment, and future needs to respond to effects of water level regulation on multi-decadal time scale.
Criterion 8: Breadth of Study Scope
One of the impressive aspects of the LOSLR study is its inclusion of environmental considerations in selecting a water regulation plan. At its core, this research described plant species diversity and composition within vegetation zones for 32 wetland sites, upon which SAR and IERM Performance Indicators were developed. The documentation of the wetland and SAR species assemblages constitutes a significant database. Seldom is an analysis of so many sites possible in a single study. One lasting legacy of this project is the valuable database of standardized field measurements of many wetland components. In particular, the inventory of wetlands in Lake Ontario is a significant contribution, and should be preserved to support adaptive management and future research. It is important that GIS databases (such as those used for modeling different organisms) be maintained to ensure wide public accessibility and for possible enrichment as more data become available. Upon publication, this LOSLR study will contribute significantly to documentation of the relationship between flooding/dewatering history and wetland vegetation. Every effort should be made to ensure that the data acquired for this project remain in public domain and available for future projects.
Criterion 9: Balance Between Scientific and Practical Professional Approaches
When empirical data are lacking, it is sensible to make use of expert opinion to
inform habitat models. Sometimes, though, expert opinions lack credibility when ad hoc methods are used to solicit them, rather than the more explicitly structured methods that have been developed in the field of decision analysis (e.g., Meyer and Booker, 1991; Morgan and Henrion, 1990). When used in standard practice, expert opinions can be invaluable complements or supplements to empirical data. Expert opinion was used in the SAR studies, but it lacked many of the standards of good practice for use, including (1) justification of choice of experts; (2) provision of a common background of available information to all experts; (3) orderly and itemized structure of expert judgments on related issues, rather than a composite judgment about population response; and (4) calibration of the experts’ responses with whatever empirical data may be available. These standards for expert analysis should be included in the SAR analyses and processes.
Criterion 10: Identification of Future Needs
This body of environmental science, as presented in the wetlands, SAR, and IERM documents, is seen as a solid beginning to a science program aimed at understanding the LOSLR ecosystem. The data and information collected, analyzed and utilized in the LOSLR Study will provide a foundation for future, related scientific work that should be further developed, refined, expanded, and applied to scientific and policy uses.
As advances in science continue, the IERM and thus the SVM must be able to accommodate these advancements in science and modeling techniques. Currently, the IERM is a positive step forward for the management of lake levels and flows for the Lake Ontario/St. Lawrence system. In 2005, the LOSLR environmental field data are of short duration (less than three years) and spatially limited, and the propagation of error is essentially unknown. While the science is still under development, a common and sensible response to decision making hampered by limited information is adaptive management. Adaptive management can be designed to update and adapt the data and models used for decision making in a systematic way over time.
The environmental research explicitly focused on effects of water levels on wetlands, SAR, and other organisms in the LOSLR ecosystem. Other attributes of the aquatic system, such as water quality, shoreline urbanization, dredging and other sediment manipulation, were not included in these analyses. These other stressors likely have an influence on measures of environmental Performance Indicators, but their effects are undocumented in the LOSLR materials.
Because these other factors that are likely to influence SAR and other environmental Performance Indicators have not been included in any of the Performance Indicator models, it will be very difficult to use monitoring data to evaluate the success of water regulation plans and to update and improve the Performance Indicator models. There are likely to be variations in environmental status attributable to these or other factors in addition to or instead of water level fluctuations. While the current design of the IERM and SVM cannot tease apart impacts caused by these factors from those due to water regulation, adaptive man-
agement may provide an appropriate paradigm by which the SVM can be updated to include additional factors once the science becomes available.
SUMMARY ON ENVIRONMENTAL SCIENCES IN THE LOSLR STUDY
This chapter evaluated the three sectors of the LOSLR environmental sciences as a collective body of work. Findings and recommendations have been presented by Statement of Task Charges A, B, and C in the preceding sections. This summary presents major findings and recommendations separately for wetlands, SAR, and IERM, respectively, but first, issues are presented that are common to or span across the three sectors.
Cross-Cutting Findings in Environmental Sciences in the LOSLR Study
Improvements to the LOSLR environmental science work will take a range of effort and resources to address. Some choices made in the environmental science LOSLR studies are not optimal for the available information, but can be improved with a modest investment of effort. Examples of these include (1) calculating ratios (or another metric for comparing plans) in a consistent and coherent manner, (2) abandoning the Index of Ecological Integrity, (3) reformulating Performance Indicator models to remove any bias introduced by non-standard use of the precautionary principle; and (4) improved documentation for wetlands, SAR, and IERM work.
Other deficiencies can be remedied only with a more fundamental change in study approach, with a moderate investment in additional collection of field data and reworking, perhaps substantially reworking, LOSLR models. These include (1) defining dune-barrier Performance Indicators, (2) formulating a more ecosystem-oriented metric to represent at least some environmental Performance Indicators, (3) remedying the problems with temporal and spatial resolution, (4) reworking the FEPS model and its linkages to environmental models to facilitate better prediction of dune-barrier island responses and wetlands vegetation responses, (5) inclusion of SAR that had been excluded because they are not currently present in the study area, provided they meet other criteria for inclusion, and (6) use of appropriate methods for eliciting expert opinion.
Some issues can be remedied only over time and with considerable ongoing investment in data collection, analysis and integration with the decision making framework. These include (1) obtaining a more representative field sample of wetlands and aquatic vegetation, (2) incorporating factors other than water levels in data collection and modeling via an adaptive management scheme, and (3) validation and improvement of Performance Indicator models.
Wetland Evaluation Summary
In part or in whole, all 32 environmental Performance Indicators are based upon wetlands empirical data, which are used subsequently in IERM and SVM models. Therefore, the reliability of the wetland empirical data is directly related to the reliability of the SAR, IERM, and to SVM results. While applauded for the extensive database populated by the wetlands sampling inventories, the wetlands empirical work presents some concerns:
-
The current sampling methods limited to shallow waters excluded or undersampled many of the submergent species in the high-quality wetlands and likely underestimated the diversity of submerged vegetation and available fish habitat
-
The 32 “typical” wetland sites selected for sampling may not be representative of Lake Ontario-St. Lawrence River wetlands, as these sites were neither chosen randomly nor sampled to ensure representativeness of available wetland types. Therefore, the validity of applying study results to the entire wetland inventory remains in question
-
Wetlands results need to be validated using data on those or similar wetlands from previous studies (i.e., IJC Water Levels Reference Study, Wilcox et al., 1992) to demonstrate the quality of the analysis and the certainty of wetland forecasts
-
Propagation of error is a major concern for the LOSLR. There is a potential for error to be propagated from the wetlands empirical data through the SVM, but this potential is not documented and therefore cannot be quantified
-
Specific attention is needed to ensure that results for larger wetlands can be extrapolated directly to smaller ones in other geographic reaches of the LOSLR system
-
Wetland data acquired in this effort should remain in public domain and preserved to support adaptive management and future research
SAR Evaluation Summary
For many SAR, the Performance Indicator models developed during the LOSLR studies may be the best that can be done with the data that could be gathered and analyzed with the time and resources made available during the study. Documentation was problematic in SAR materials, and improved documentation is needed for:
-
use of expert opinion;
-
selection of SAR for analysis; and
-
criteria used to evaluate confidence in the models and sensitivity of the Performance Indicators to water level regulation.
IERM Evaluation Summary
The IERM and SVM were developed to answer the question: Can the impact of regulating Lake Ontario lake levels and St. Lawrence River flows be mitigated to improve environmental impacts compared to Plan 1958DD? From an environmental perspective, the IERM is a single-species approach—not an ecosystem approach—that does not include other stressors on abundance and performance of organisms. As a result, with time, the IERM will become less accurate as a predictor of performance. The main findings about and recommendations for improving the IERM follow:
-
Performance Indicator ratios are calculated differently, based on different units, such as biomass, area, and other measures, and should be reconciled to calculate ratios in a consistent, comparable, and coherent manner
-
An explanation is needed about how Performance Indicators were selected or eliminated for use in the IERM and SVM
-
Better documentation is needed about how limitations of certainty and propagation of error are calculated, including clarification of or a quantitative substitute for the 10 percent rule that was derived from a Study Board’s “administrative decision”
-
The Performance Indicator for barrier beaches should be included in the IERM
-
The Index of Ecological Integrity used in the LOSLR Study presents a single value that (1) obscures differences among environmental Performance Indicators and (2) simultaneously attempts to represent conditions upstream and downstream of the Moses-Saunders dam. It is recommended that the index not be used for the LOSLR Study
-
The quarter month time-step of the SVM needs to be reconciled with the shorter time steps used in the SAR and faunal sub-models in the IERM
-
Calibration, validation and error propagation must be estimated or better documented to increase confidence in IERM results.
Certainly, the IERM model produced is better than the 1958DD Plan of Operation model previously used for making decisions, but the IERM may not be adequate as a predictive management tool because of issues of validation, calibration, cumulative uncertainties, omission of critical Performance Indicators, the lack of an ecosystem approach and a resulting obsolescence.
***
In sum, this body of environmental science, as presented in the wetlands, SAR, and IERM documents, is seen as a satisfactory beginning to a long-term program for understanding broad impacts of water regulation in the LOSLR system. The data and information collected will provide a solid foundation for future, related scientific work and policy decisions for Lake Ontario and the St. Lawrence River. Currently, this environmental work is compromised by unanswered questions in the wetlands sampling methodologies and inadequate documentation that ultimately undermines confidence that linkages among environmental Performance Indicators, IERM model and its sub-models, and the SVM operate as designed. Several issues need to be addressed in order to elevate the environmental work to the level of being appropriate and sufficient to inform the water regulation plan decision making process. Propagation of error and the overall thin treatment of uncertainty need to be addressed with rigor; the calculation of Performance Indicator ratios needs to be explained; and criteria and methods for the selection or elimination of Performance Indicators needs documentation. Even still, the breadth of the environmental sciences in the LOLSR Study and the empirical databases created from these efforts are a step in the right direction and commended. It is recommended that the wetlands, SAR, and the IERM work become the foundation for an adaptive management program whereby the environmental Performance Indicators and SVM can be adjusted appropriately as the science of the LOSLR system advances.
REFERENCES
Ashworth, S. M. 1997. Comparison between restored and reference sedge meadow wetlands in south-central Wisconsin. Wetlands 17:518-527.
Baldwin, A. H., and I. A. Mendelssohn. 1998. Effects of salinity and water level on coastal marshes: an experimental test of disturbance as a catalyst for vegetation change. Aquatic Botany 61:255-268.
Bedford, K. W. 1992. The physical effects of the Great Lakes on tributaries and wetlands. J. Great Lakes Research 18:571-589.
Campbell, J. M. 1992. Habitat and population ecology of Lobelia Kalmii on Presque Ilse, PA correlated with changes in Lake Erie water levels. J. Pennsylvania Academy of Science 66:123-127.
Chow-Fraser, P. 2005. Ecosystem response to changes in water level of Lake Ontario marshes: lessons from the restoration of Cootes Paradise Marsh. Hydrobiologia. 539:189-204.
Chow-Fraser, P., V. L. Lougheed, B. Crosbie, V. LeThiec, L. Simser, and J. Lord. 1998. Long-term response of the biotic community to fluctuating water levels and changes in water quality in Cootes Paradise Marsh, a degraded coastal wetland of L. Ontario. Wetland Ecol. Manage. 6: 19-42.
Dieffenbacher-Krall, A. C. 1996. Paoleo- and historical-ecology of the Cutler grasslands, Cutler, Maine: implications for future management. Natural Areas Journal 16:3-13.
Eyles, N., M. Doughty, J. I. Boyce, M. Meriano, and P. Chow-Fraser. 2003. Geophysical and sedimentological assessment of urban impacts in a Lake Ontario watershed and lagoon: Frenchman’s Bay, Pickering, Ontario. Geoscience Canada. 30:115-128.
Fan, Y., and D. Fay. 2001. Variation of St. Lawrence River Hourly Water Levels About the Quarter-Monthly Mean. Hydrology and Hydraulics Technical Working Group. Lake Ontario–St. Lawrence River Study, International Joint Commission. December 2001.
Farney, R. A., and T. A. Bookhout. 1982. Vegetation changes in a Lake Erie marsh (Winous Point, Ottawa County, Ohio) during high water years. Ohio Journal of Science 82:103-106.
Franklin, J. F. 1993. Preserving biodiversity: species, ecosystems or landscapes? Ecological Applications 3(2):202-205.
Gaudet, C. L., and P. A. Keddy. 1988. A comparative approach to predicting competitive ability from plant traits. Nature 334(6179):242-243.
Grace, J. B. 1988. The effects of nutrient additions on mixtures of Typha latifolia L. and Typha domingensis Pers. along a water-depth gradient. Aquatic Botany 31:83-92.
Grace, J. B., and R. G. Wetzel. 1998. Long-term dynamics of Typha populations. Aquatic Botany 61: 137-146.
Greenway, K. J., and V. J. Lieffers. 1997. A boreal forest grass with an open meadow photosynthetic strategy. Canadian J. Botany 75:562-567.
Howard, R. J., and I. A. Mendelssohn. 1995. Effect of increased water depth on growth of a common perennial freshwater–intermediate marsh species in coastal Louisiana. Wetlands 15:82-91.
Hupp, C. R. 2000. Hydrology, geomorphology, and vegetation of Coastal Plain rivers in southeastern USA. Hydrological Processes 14:2991-3010.
IERM 1. Limno-Tech, Inc. DRAFT of April 2005. Development of an Integrated Ecological Response Model (IERM) for the Lake Ontario-St. Lawrence River Study.
IERM 2. IERM Model (version 4.1.1).
IERM 3. Limno-Tech, Inc. DRAFT of March 2004. Development of the Integrated Ecological Response Model (IERM) for the Lake Ontario-St. Lawrence River Study.
IERM 4. Limno-Tech, Inc. April, 2005. Integrated Ecological Response User’s Manual.
IERM 5 RS. Turgin, K, O. Champoux, S. Martin, and J. Morin. April, 2005. Modelisation des grandes classes de milieux humides de la plaine inondable du fleuve Saint-Laurent: Consideration de la succession des communautes vegetales.107 Wetlands Model for the Lower St. Lawrence River [French].
IERM 6 RS. Morin, J., O. Champoux, S. Martin, and K. Turgeon. April, 2005. Modelisation integree de la reponse de l’ecosyteme dans le fleuve Saint-Laurent: Rapport final des activities enterprises dans le cadre du Plan d’etude
sur la regularisation du lac Ontario et du fleuve Saint Laurent. 108 Species at Risk Model for the Lower St. Lawrence River [French].
Kao, J. T., J. E. Titus, and W. Zhu. 2003. Differential nitrogen and phosphorus retention by five wetland plant species. Wetlands. 23: 979-987.
Keddy, P. A. 1984. Quantifying a within-lake gradient of wave energy in Gillfillan Lake, Nova Scotia. Canadian J. Botany 62:301-309.
Kelley, J. C., T. M. Burton, and W. R. Enslin. 1984. The effects of natural water level fluctuations on N and P cycling in a Great Lakes marsh. Wetlands 4:159-175.
Keough, J. R., T. A. Thompson, G. R. Guntenspergen, and D. A. Wilcox. 1999. Hydrogeomorphic factors and ecosystem responses in coastal wetlands of the Great Lakes. Wetlands 19:821-834.
Kercher, S. M., Q. J. Carpenter, and J. B. Zedler. 2004. Interrelationships of hydrologic disturbance, reed canary grass (Phalaris arundinacea L.) and native plants in Wisconsin wet meadows. Natural Areas Journal 24: 316-325.
Kozlowski, T. T. 1984. Plant responses to flooding of soil. Bioscience 34:162-167.
Lauck, T., C. W. Clark, M. Mangel, and G. R. Munro. 1998. Implementing the precautionary principle in fisheries management through marine reserves. Ecological Applications 8(1) Supplement: Ecosystem Management for Sustainable Marine Fisheries S72-S78.
Lenssen, J., F. Menting, W. Van Der Putten, and K. Blom. 1999. Control of plant species richness and zonation of functional groups along a freshwater flooding gradient. Oikos 86: 523-534.
Lessman, J. M., I. A. Mendelssohn, M. W. Hester, and K. L. McKee. 1997. Population variation in growth response to flooding of three marsh grasses. Ecological Engineering 8:31-47.
Li, S., S. R. Pezeshki, and S. Goodwin. 2004. Effects of soil moisture regimes on photosynthesis and growth in cattail (Typha latifolia). Acta Oecologica. 25: 17-22.
Lougheed, V. L., T. Theÿsmeÿer, T. Smith, and P. Chow-Fraser. 2004. Carp exclusion, food-web interactions, and the restoration of Cootes Paradise Marsh. J. Great Lakes Res. 30 (1): 44-57.
MacDonald, S. E., and V. J. Lieffers. 1993. Phizome plasticity and clonal foraging of Calamagrostis Canadensis in response to habitat heterogeneity. Journal of Ecology 81:769-776.
Makarewicz, J. C., J. M. Haynes, R. C. Dilcher, C. J. Norment, and T. Lewis. 2000. Biological Survey of Yanty Creek Marsh. New York Office of Parks and Recreation and Historic Preservation. Castile, NY: Western District, Genesee Region, One Letchworth State Park.
McKee K. L., and I. A. Mendelssohn. 1989. Response of a freshwater marsh plant community to increased salinity and increased water-level. Aquatic Botany 34:301-316.
McMaster, R. 1997. Floristics, zonation and succession of vascular vegetation in fifteen beaver-impacted wetlands in western Massachusetts. Dissertation. University of Massachusetts.
Mendelssohn, I. A., and D. M. Burdick. 1988. The relationship of soil parameters and root metabolism to primary production in periodically inundated soils. P. 398-428. IN D. D. Hook (eds). The Ecology and Management of Wetlands. Vol. 1. Ecology of Wetlands. Portland OR: Timber Press.
Meyer, M., and J. Booker. 1991. Eliciting and Analyzing Expert Judgment, a Practical Guide. London, UK: Academic Press.
Middleton, B. 2002. Nonequilibrium dynamics of sedge meadows grazed by cattle in southern Wisconsin. Plant Ecology 161: 89-110.
Morgan, M., and M. Henrion. 1990. Uncertainty. A Guide To Dealing With Uncertainty in Qualitative Risk and Policy Analysis. New York: Cambridge University Press.
Mulhouse, J. M., and S. M. Galatowitsch. 2003. Revegetation of prairie pothole wetlands in the mid-continental U. S.: Twelve years of post-reflooding. Plant Ecology 169:143-159.
Naiman, R. J., H. Décamps, and M. Pollock. 1993. The role of riparian corridors in maintaining regional biodiversity. Ecological Applications 67:1254-1269.
NYORHP (New York Office of Parks, Recreation and Historic Preservation). 1998. State Environmental Quality Review. Provide Shoreline Protection– Yanty Marsh, Hamlin Beach State Park.
Ovenden, L., and G. R. Brassard. 1989. Wetland vegetation near Old Crow, Northern Yukon. Canadian J. Botany 67:954-960.
Pollock, M. M., R. J. Naiman, and T. A. Hanley. 1998. Plant species richness in riparian wetlands—A test of biodiversity theory. Ecology 79(1):94-105.
Robert, M., P. Laporte, and R. Benoit. 2000. Summer habitat of yellow rails, Cotunicops noveboracensis, along the St. Lawrence River, Quebec. Canadian Field-Naturalist 114:628-635.
SAR 1. Water Fluctuation Impacts on Species At Risk Cornwall to Pointe due Lac [French].
SAR 2. Lake Ontario Species at Risk Supplement (Least Bittern and Black Tern Reproductive Index PIs).
SAR 3A. Impact of Water Level Regulation on Nearshore Habitat Availability and SAR.
SAR 3B. (Supplement) Impact on dunes and SAR.
SAR 4. Species at Risk Fish Supplement (Year 4 Modeling Group Report).
SAR 5. Lower St. Lawrence Species at Risk Final Report (2005) [French].
Sorrell, B. K., I. A. Mendelssohn, K. L. McKee, and R. A. Woods. 2000. Ecophysiology of wetland plant roots: A modeling comparison of aeration in relation to species distribution. Annals of Botany 86:675-685.
Tessier, C., A. Aubin, and C. Chenevier. 1984. Elevation and distance factors in the structure and productivity of a riverine macrophyte community. Canadian J. Botany 62:2260-2266.
Wei, A., and P. Chow-Fraser. 2005. Untangling the confounding effects of urbanization and high water level on the cover of emergent vegetation in Cootes Paradise Marsh, a degraded coastal wetland of Lake Ontario. Hydrobiologia. 544: 1-9.
Wei, A., and P. Chow-Fraser. 2006. Synergistic impact of water-level fluctuation
and invasion of Glyceria on Typha in a freshwater marsh of Lake Ontario. Aquat. Bot. (In press).
Wei, A., P. Chow-Fraser, and D. Albert. 2004. Influence of shoreline features on fish distribution in the Laurentian Great Lakes. Can. J. Fish. Aquat. Sci. 61: 1113-1123.
Wilcox, D. A., J. E. Meeker, and J. Elias. 1993. Impacts of water-level regulation on wetlands of the Great Lakes. Phase 2 Report to Working Committee 2. International Joint Commission Water-levels Reference Study, Ottawa, Ontario. Canada and Washington, DC. USA.
Wilcox, D. A., S. I. Apfelbaum, and R. D. Hiebert. 1984. Cattail invasion of sedge meadows following hydrologic disturbance in the cowls Bog Wetland Complex, Indiana Dunes National Lakeshore. Wetlands 4:115-128.
W 1. Wilcox, D. A., K. P. Kowalski, and M. L. Carlson. 2003. Year 3 Report of Relationship between Lake Ontario Water Levels and the Wetlands. Ann Arbor, MI: Great Lakes Science Center, U.S. Geological Survey.
W 2. Evaluation of Water Level Regulation Influences on Lake Ontario and upper St. Lawrence River Coastal Wetland Plant Communities.


