
3
Key Factors Influencing U.S. Leadership in Mechanical Engineering Basic Research
In the previous chapter, the panel evaluates leadership in mechanical engineering as measured by numbers and quality of journal articles and a virtual congress conducted by the panel members. This leadership is influenced by a multitude of factors that are largely the result of national policy, economics, and available resources of each country in the world. Here, the panel focuses on three key factors that influence the international leadership status of U.S. mechanical engineering basic research:
-
Centers, facilities, and instrumentation: the physical infrastructure for conducting mechanical engineering basic research
-
Human resources: the national capacity for producing and employing mechanical engineering students and degree holders.
-
Research and development funding: financial support for conducting mechanical engineering research
CENTERS, FACILITIES, AND INSTRUMENTATION
Modern science and engineering research involves interdisciplinary collaboration, requiring specialized hardware and software often used by multiple disciplines. At the same time, mechanical engineers have specific needs to be met. The health and competitiveness of mechanical engineering research depends on the availability of cutting-edge facilities at U.S. universities and national laboratories. Examples of such facilities are described below. When available, important international facilities are also included. This section does not provide an analysis of the availability of or funding for centers, facilities, and instrumentation— it is meant to highlight the types of such infrastructure resources that are important for carrying out mechanical engineering research.
The types of centers, facilities, and instrumentation of interest to mechanical engineering research fall into the following broad categories:
-
Materials characterization and micro- or nanofabrication
-
Manufacturing, automation, and rapidprototyping
-
Biomechanical engineering
-
Cyberinfrastructure
-
Energy and flow systems
Materials Characterization and Micro- or Nanofabrication
In the mechanics of engineering materials subarea, central facilities are extremely important, especially for the experimental side of the research. As the frontiers of research have moved to an increasingly small scale, access to electron microscopy, scanning probe microscopy and other specialized equipment is essential. These types of equipment are typically not found in individual research labs, they are housed in central facilities on campuses or in other research centers. At the elite research universities in the United States, access to such equipment is quite good, though in some cases usage fees can be excessive. Internationally, the same situation holds, where one potential difference is that in many foreign nations equipment is staffed by trained technicians who can facilitate the consistent quality as well as the speed of work. In addition to this equipment, access to large-scale, unique equipment such as synchrotrons is increasingly important. In the United States these facilities are run by the U.S. government and access for academic work is well supported.
Characterization of materials often requires high-energy light sources—such as synchrotron and neutron sources—or other specialized facilities that need a significant level of funding to operate and maintain. These are typically available only at national facilities both here and abroad.
Examples of important synchrotron sources include the following: 1 Advanced Light Source (ALS), Advanced Photon Source (APS), National Synchrotron Light Source (NSLS), Stanford Synchrotron Radiation Laboratory (SSRL), Los Alamos Neutron Scattering Center, IPNS (Intense Pulsed Neutron Source) at Argonne and High Flux Isotope Reactor at Oak Ridge National Laboratory in the United States; Berliner Elektronenspeicherring-Gesellschaft für Synchrotronstrahlung (BESSY) in Germany; European Synchrotron Radiation Facility (ESRF) in France; INDUS 1/INDUS 2 in India; and National Synchrotron Radiation Research Center (NSRRC) in Taiwan.
Examples of important neutron sources include2 Spallation Neutron Source, Oak Ridge National Laboratory and the University of Missouri Research Reactor Center in the United States; ISIS-Rutherford-Appleton Laboratories in the United Kingdom; and Hi-Flux Advanced Neutron Application Reactor in Korea.
Most research-intensive universities are well equipped with conventional micro- and nanofabrication techniques such as thin-film deposition (e.g. chemical vapor deposition, physical vapor deposition), lithography, chemical etching, and electrodeposition, as well as characterization techniques such as electron microscopy, electron and X-ray diffraction, and probe microscopy that are used routinely to characterize small structures, small volumes, and thin films. However, the ability to characterize extremely small nanostructures or to tailor materials at an atomic level requires much more specialized equipment. The Department of
|
1 |
For a full list of worldwide synchrotron light sources, see http://www.lightsources.org/cms/?pid=1000098. |
|
2 |
For a full list of worldwide neutron sources, see the National Institute of Standards and Technology Center for Neutron Research at http://www.ncnr.nist.gov/nsources.html. |
Energy is now in the process of opening five Nanoscale Science Research Centers3 that will provide just such capabilities. Four of these centers are listed here, and one is mentioned later in the discussion of biological capabilities.
-
The Center for Nanoscale Materials is focused on fabricating and exploring novel nanoscale materials and, ultimately, employing unique synthesis and characterization methods to control and tailor nanoscale phenomena.
-
The Center for Functional Nanomaterials provides state-of-the-art capabilities for the fabrication and study of nanoscale materials, with an emphasis on atomic-level tailoring to achieve desired properties and functions.
-
The Center for Integrated Nanotechnologies features low vibration for sensitive characterization, chemical and biological synthesis labs, and clean rooms for device integration.
-
The Center for Nanophase Materials Sciences is a collaborative nanoscience user research facility for the synthesis, characterization, theory-modeling-simulation, and design of nanoscale materials.
Other agencies and even some universities support key nanofabrication facilities. The National Science Foundation funds several nanofabrication facilities (e.g., at Cornell University) that are available to external users and are part of a larger National Nanotechnology Infrastructure Network (NNIN). 4 The Cornell Nanofabrication Facility5 provides fabrication, synthesis, characterization, and integration capabilities to build structures, devices, and systems from atomic to complex large scales. Carnegie Mellon University independently operates its own user facility that serves the broader community. The Nanofabrication Facility at Carnegie Mellon6 provides facilities for data storage, thin film, and device development and includes extensive cleanroom space.
Manufacturing, Automation, Rapidprototyping
Mechanical engineers are involved in all aspects of manufacturing from product design to process controls. A key infrastructure resource for manufacturing is the Manufacturing Engineering Laboratory (MEL) at the National Institute of Standards and Technology (NIST). MEL conducts research and development, provides services, and participates in standards activities related to mechanical and dimensional metrology. One particular area of success has been in lean manufacturing; many industrial success stories are available on the NIST Manufacturing Extension Partnership website.7 Similar facilities exist at universities, such as the NSF Center for Reconfigurable Machining Systems (RMS) at the University of Michigan, Ann
Arbor. “[RMS) is one designed at the outset for rapid change to quickly adjust its production capacity and functionality in response to sudden market changes and customer demand.”8
Mechanical engineers are concerned with the calibration and quality control of measurement of instruments and manufacturing devices. Microcomputed tomography (microCT) is used for high resolution imaging. Another example is the use of micropatterning (Columbia University has three N.Y. state-funded centers for conducting this kind of research). NIST offers extensive measurement and standardization facilities.
In the area of automation and dynamic systems and controls, many university centers provide important shared facilities, such as the Iowa Driving Simulator at Iowa State University or automated highway research facilities at the University of California at Berkeley.
Physical prototyping infrastructure facilities allow researchers to rapidly produce prototypes of products as a means to better validate theoretical and applied developments. Although a small handful of rapid prototyping centers exist across the nation (e.g., Milwaukee School of Engineering, Georgia Tech, University of Louisville) and isolated prototyping machines at a large number of universities, there is very limited accessible infrastructure dedicated to providing researchers the ability to test and validate their advancements in design. Emerging quickly, largely because of digital advances and global market pressures, is the need for virtual prototyping, allowing researchers to create functional digital models of products and systems while also providing tactile feedback using haptic and virtual reality technologies. Although there are a small handful of design centers with virtual prototyping capabilities (e.g., Iowa State University, University of Iowa, University at Buffalo-State University of New York), and isolated researchers with haptic devices and visualization facilities, there is limited infrastructure dedicated to providing researchers the ability to virtually test and validate their advances in design research.
In addition, more action is being taken to coordinate R&D in manufacturing across federal agencies, including joint solicitations through the efforts of the Interagency Working Group (IWG) on Manufacturing Research and Development.9 One report that will be forthcoming from the IWG is related to manufacturing R&D in three specific areas: (1) nanomanufacturing; (2) manufacturing for the hydrogen economy; and (3) integrated and intelligent manufacturing systems.
Biomechanical Engineering
The need for biomechanical engineering facilities fall into three areas: (1) characterizing signal transduction (cells sensing external signals) such as effects of shear force, which requires multiscale computational power; (2) imaging at smallest length scales (i.e., nanometer) level; and (3) mimicking biological tissues—biomimetics (e.g., tissue engineering). Two examples of new centers providing state-of-the-art facilities and approaches for bioengineering research are given below—starting with one of the DOE’s nanoscale science research centers.
|
8 |
http://www.erc-assoc.org/factsheets/l/html/erc_l.htm (accessed September 24, 2007). |
|
9 |
http://www.ostp.gov/mfgiwg/ (accessed September 26, 2007). |
-
The Molecular Foundry provides instruments and techniques for users pursuing integration of biological components into functional nanoscale materials. 10
-
The Institute for Systems Biology takes a multidisciplinary approach to addressing systems biology that includes integration of research in many sciences including biology, chemistry, physics, computation, mathematics, and medicine. 11
Cyberinfrastructure
According to the National Science Foundation, cyberinfrastructure refers to the distributed computer, information, and communication technologies combined with the personnel and integrating components that provide a long-term platform to empower the modern scientific research endeavor.12 Advances in computational mechanics depend heavily on (1) advances in high-performance computing (HPC) devices; (2) new software that is compatible with the changing computer platforms; and (3) new algorithms and methods to model advanced problems in mechanical engineering, such as multiscale and multiphysics events in nanomanufacturing.
Two examples of engineering cyberinfrastructure capabilities are the following:
-
The Collaborative Large-scale Engineering Analysis Network for Environmental Research (CLEANER) addresses large-scale human-stressed aquatic systems through collaborative modeling and knowledge networks. 13
-
The Network for Computational Nanotechnology connects theory, experiment, and computation in a way that makes a difference to the future of nanotechnology. 14
Energy and Flow Systems
Generally, research in thermal systems and heat transfer relies on small-scale lab experiments. The exception is large flow systems such as wind tunnels and facilities for testing turbine blade cooling systems, nuclear fuel assembly thermal test systems, and other specialized facilities. Large scale wind tunnels for sub-, super-, and hypersonic flow were originally maintained by the National Aeronautics and Space Administration (NASA) under its aeronautics program. This program has been cut back significantly, and many of these facilities have been put in storage or permanently dismantled. Wind tunnels are also used for acoustics and dynamics research. NASA has one at Langley-used for high-noise chambers. Slow-neutron sources (such as the Savannah River Site reactor) are used for real-time imaging of casting and engines.
Turbines are also critical to energy and research in aeropropulsion and turbomachinery, and laboratories or facilities exist mainly at universities—for example the gas turbine laboratory (GTL) at the Massachusetts Institute of Technology, Ohio State University, or Georgia Institute
|
10 |
|
|
11 |
|
|
12 |
See extensive list of links on cyber-infrastructure at http://www.nsf.gov/crssprgm/ci-team/#ecl. |
|
13 |
|
|
14 |
of Technology. There is also a well-known GTL at the National Research Council Canada (NRC) Institute for Aerospace Research, located in Ottawa.
HUMAN RESOURCES
Human resources are an essential component of leadership in mechanical engineering. Below, the panel discusses overall characteristics of worldwide science and engineering human resources, and then focuses on some important features of the U.S. supply of mechanical engineers.
Strong Competition for International S&E Human Resources
In terms of sheer numbers of engineering undergraduate degrees granted, the United States is outpaced by China, Japan, Russia, and South Korea (Table 3-1). In the physical and biological sciences, the United States is behind India, China, and Russia. Moreover, the United States ranks lower than most industrialized nations in the percentage of 24-year-olds who hold their first university degrees (e.g., bachelor’s degree in the United States) in natural sciences and engineering (NS&E: see Figure 3-1). U.S. competitors in Europe and Asia are producing a higher percentage of NS&E degree holders.
TABLE 3-1 Countries with the Greatest Numbers of First University Degrees in Engineering Compared with Degrees in Physical and Biological Sciences
|
|
Engineering |
Physical and Biological Sciences |
|
China (2003) |
351,537 |
103,409 |
|
Japan (2004) |
98,43 |
19,727 |
|
Russia (1999) |
82,409 |
101,320 |
|
South Korea (2002) |
64,942 |
12,864 |
|
United States (2002) |
60,639 |
79,768 |
|
Mexico |
44,682 |
7,695 |
|
Taiwan |
41,947 |
4,294 |
|
India (1990) |
29,000 |
147,036 |
|
Italy |
26,747 |
9,193 |
|
France (2002) |
26,414 |
27,750 |
|
SOURCE: National Science Foundation, Science and Engineering Indicators 2006, Appendix Table 2-37. |
||
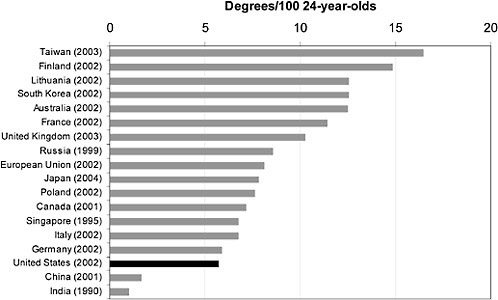
FIGURE 3-1 Ratio of first university natural science and engineering degrees per 100 24-year-olds by country. NS&E includes physical, biological, agricultural, and computer sciences; mathematics; and engineering. SOURCE: National Science Foundation, Science and Engineering Indicators 2006 , appendix table 2-37, based on data from Organization for Economic Cooperation and Development, Center for Education Research and Innovation, Education database, www1.oecd.org/scripts/cde/members/edu_uoeauthenticate.asp; United Nations Educational, Scientific, and Cultural Organization, Institute for Statistics database, http://www.unesco.org/statistics, and national sources.
The United States is the single largest producer of natural science and engineering doctoral degrees (see Figure 3-2). However, the number of U.S. doctorates has been declining gradually since the late 1990s. At the same time, the number of China’s doctorates leveled off after rapid growth in the early 1990s.
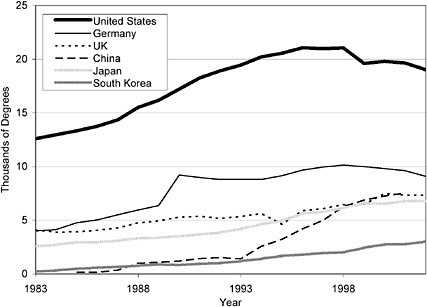
FIGURE 3-2 Natural science and engineering doctoral degrees, 1983-2002. SOURCE: National Science Foundation, Science and Engineering Indicators 2006, Figure 2-34.
The United States also has increasingly relied on foreign-born scientists and engineers. In 2000, 38 percent of U.S. Ph.D.s granted were to foreignborn scientists and engineers, whereas in 1990 only 22 percent were foreignborn. A large portion of those who come to the United States to earn a Ph.D. in science or engineering, stay here. A 2005 study found that 71 percent of foreign citizens who received S&E doctorates from U.S. universities in 2001 lived in the United States in 2003.15 The study also found that among S&E disciplines, the highest stay rates were for computer and electrical and electronic engineering and the physical sciences. Most foreign doctorate recipients come from four countries. The stay rates for two of these countries, China (90 percent) and India (86 percent), are very high, while those for the other two, Taiwan (47 percent) and Korea (34 percent), are well below the average for all countries.
Steady Supply of Mechanical Engineers in the United States
A good measure of the near-term supply of new mechanical engineers is to look at the recent trend in the number of graduate students in the United States, which is discussed in more detail below. A measure of the midterm availability of U.S. research mechanical engineers is provided by the number of B.S. mechanical engineering degrees granted in the United States
(Figure 3-3); which has drifted down by about 6 percent over the most recent decade for which data are available—from 15,297 in 1994 to 14,368 in 2004.16
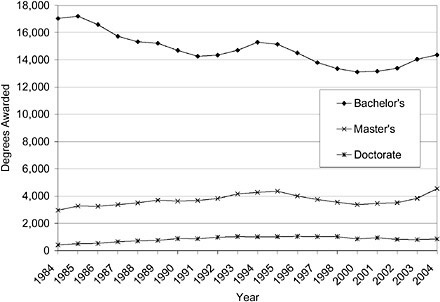
FIGURE 3-3 Mechanical engineering degrees awarded, by degree level: 1984–2004. SOURCE: National Science Foundation, Division of Science Resources Statistics. 2006. Science and Engineering Degrees: 1966–2004. January 2007. Arlington, VA.
On a still longer time scale, the supply of scientists and engineers overall depends on the current state of the U.S. K-12 educational system. Here, there have been ongoing concerns about K-12 math and science education in the United States compared with other countries, based largely on the results of internationally administered tests. In 2004, the NSF summarized the situation: "U.S. students are performing at or below the levels attained by students in other countries in the developed world,” and “In international comparisons, U.S. student performances become increasingly weaker at higher grade levels.”17 More recent results reported by NSF showed a more mixed picture—where U.S. fourth and eighth grade students scored above average on the international tests, but U.S. 15-year-olds scored below average.18
Because of the difficulties in locating quantitative data on mechanical engineering human resources at the international level, the panel concentrated on the trends in the number of U.S.mechanical engineering graduate students and Ph.D.s. The data shown in the following figures demonstrate that the numbers of U.S. graduate students and Ph.D.s have remained fairly steady
over the past 10-20 years due to the growing number of foreign-born mechanical engineering graduate students and Ph.D.s.
Between 1985 and 2005 (Figure 3-4), there was a fluctuating, but overall steady, supply of graduate students enrolling in mechanical engineering. In the late 1990s, there was a decline in the number of U.S. citizens and permanent residents enrolling in mechanical engineering graduate programs that has begun to rebound more recently. Increasing enrollment of temporary residents has compensated for the declines in U.S. citizens and permanent residents.
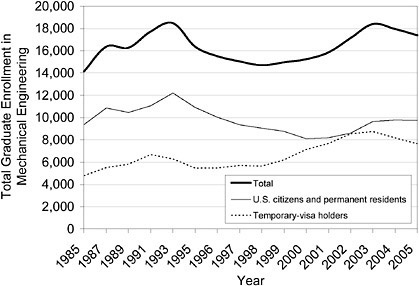
FIGURE 3-4 Total graduate enrollment in mechanical engineering and enrollment based on residency status: U.S. citizen or permanent resident versus temporary residents, 1985-2005. SOURCE: National Science Foundation, Division of Science Resources Statistics (NSF/SRS), Survey of Graduate Students and Postdoctorates in Science and Engineering, Integrated Science and Engineering Resources Data System (WebCASPAR), http://webcaspar.nsf.gov.
A better indicator of current trends, however, is to look at first-time full-time graduate enrollments, because overall graduate student enrollments include individuals who began school up to five or six years ago. Again during the period shown, first-time full-time graduate student enrollments in the United States fluctuated but overall remained above 2,800 (Figure 3-5).
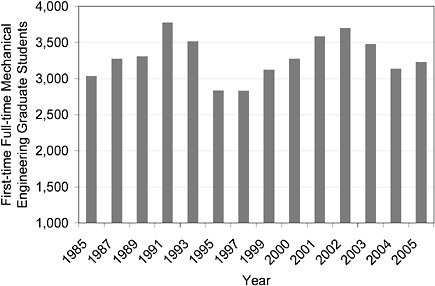
FIGURE 3-5 First-time full-time mechanical engineering graduate students: Selected years, 1985-2005. SOURCE: NSF/SRS, Survey of Earned Doctorates, Integrated Science and Engineering Resources Data System (WebCASPAR), http://webcaspar.nsf.gov.
There has been concern about the potential impacts of immigration policies following the terrorism events on September 11, 2001. A breakdown of first-time full-time enrollments by residency (Figure 3-6) shows that for 2003-2005, temporary resident enrollments fell below those of U.S. citizens and permanent residents.
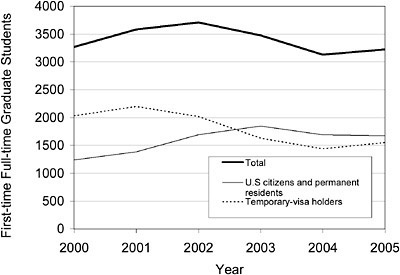
FIGURE 3-6 First-time full-time mechanical engineering graduate student enrollment by citizenship and residency status. SOURCE: NSF/SRS, Survey of Earned Doctorates, Integrated Science and Engineering Resources Data System (WebCASPAR), http://webcaspar.nsf.gov (accessed July 11, 2007).
The competitiveness of mechanical engineering research is dependent on the number of mechanical engineering Ph.D.s granted. As shown in Figure 3-7, between 1975 and 1995, the number of earned mechanical engineering Ph.D.s in the United States more than doubled due to increases in the number of doctorates awarded to both U.S. citizens and temporary residents. Over the past 10 years for which data are available (1995-2005), the number of earned mechanical engineering doctorates awarded each year has fluctuated, but overall remained above 800 doctorates awarded per year. At the same time, there was a significant decline in the number of doctorates awarded to U.S. citizens.
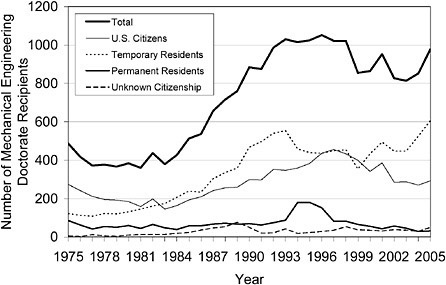
FIGURE 3-7 Earned doctoral degrees in mechanical engineering from U.S. institutions as a function of residency status for 1975-2005. SOURCE: NSF/SRS, Survey of Earned Doctorates, Integrated Science and Engineering Resources Data System (WebCASPAR), http://webcaspar.nsf.gov (accessed September 5, 2006).
Graduate student support also has some impact on the appeal of mechanical engineering research to students and the competitiveness of the discipline. Graduate students in mechanical engineering have been supported adequately over the past 20 years. During this time, graduate research assistantships have increased significantly. Research assistantships (RAs) accounted for more than 50 percent of graduate student support in 2004 (see Figure 3-8), with only a small number of fellowships. In comparison, chemical engineering graduate students received more than 50 percent of their support from RAs, with the rest of the support split nearly equal between fellowships, teaching assistantships (TAs), and other mechanisms.19 Research assistantships for mechanical engineering graduate students have largely been supported by NSF, the Department of Defense (DOD) and other federal sources (see Figure 3-9). Chemical engineering graduate students also receive significant RA support from NSF and from other federal agencies. Chemistry graduate student RAs are supported by NSF, the National Institutes of Health (NIH), and other agencies.
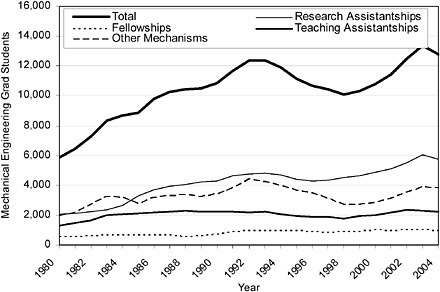
FIGURE 3-8 Full-time mechanical engineering graduate students by mechanism of support, 1980-2004. SOURCE: NSF/SRS, Survey of Earned Doctorates, Integrated Science and Engineering Resources Data System (WebCASPAR), http://webcaspar.nsf.gov (accessed July 11, 2007).
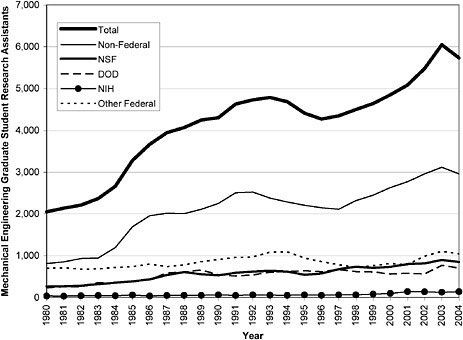
FIGURE 3-9 Full-time graduate students in mechanical engineering on research assistantships, by funding source. NOTE: Nonfederal is likely not directly from federal sources, whereas NSF, DOD, and NIH are directly funded graduate fellowships. SOURCE: NSF/SRS, Survey of Earned Doctorates, Integrated Science and Engineering Resources Data System (WebCASPAR), http://webcaspar.nsf.gov (accessed September 5, 2006).
Favorable Job Prospects and Salaries for U.S. Mechanical Engineers
Employed mechanical engineering degree holders have steadily increased (Figure 3-10). The percentage change increase from 1999 to 2003 was 22 percent overall, 23 percent for bachelor’s, 18 percent for master’s, and 11 percent for Ph.D.s.
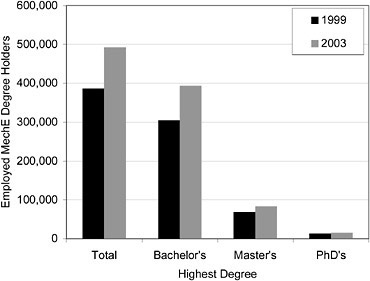
FIGURE 3-10 Comparison of employed mechanical engineering degree holders for 1999 and 2003. SOURCE: NSF, S&E Indicators, 2004, 2006.
Figure 3-11 shows that there was an increase in the number of employed mechanical engineering degree holders across all employment sectors.
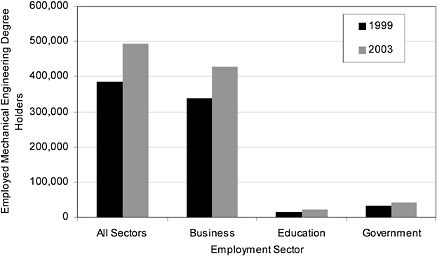
FIGURE 3-11 Comparison of employed mechanical engineering degree holders across different sectors for 1999 and 2003. SOURCE: NSF, S&E Indicators, 2004, 2006.
According to the Bureau of Labor Statistics 2006-2007 Occupation Outlook Handbook,20 mechanical engineers can expect the following employment conditions:
“Mechanical engineers [with S&E degrees) are projected to have an average rate of employment growth [9-17 percent] through 2014. Although total employment in manufacturing industries—in which employment of mechanical engineers is concentrated—is expected to decline, employment of mechanical engineers in manufacturing should increase as the demand for improved machinery and machine tools grows and as industrial machinery and processes become increasingly complex. Also, emerging technologies in biotechnology, materials science, and nanotechnology will create new job opportunities for mechanical engineers. Additional opportunities for mechanical engineers will arise because the skills acquired through earning a degree in mechanical engineering often can be applied in other engineering specialties.”
The expected earnings for mechanical engineers are also quite good. While earnings for engineers vary significantly by specialty, industry, and education—engineers as a group earn some of the highest average starting salaries among those holding bachelor’s degrees. Table 3-2 shows the average starting salary offers for engineers, according to the Fall 2007 Salary Survey by the National Association of Colleges and Employers.
|
20 |
U.S. Department of Labor, Occupational Outlook Handbook, 2006-2007 Edition, Engineers, http://www.bls.gov/oco/ocos027.htm (accessed July 12, 2007). |
TABLE 3-2 Average Starting Salary Offers for Engineers.
|
Curriculum |
Bachelor's |
Master's |
Ph.D. |
|
Aerospace, aeronautical, and astronautical |
$53,626 |
$64,899* |
$73,588* |
|
Agricultural |
49,866 |
61,100* |
— |
|
Bioengineering and biomedical |
51,044 |
58,423* |
— |
|
Chemical |
59,218 |
66,542* |
76,688* |
|
Civil |
48,998 |
51,297 |
62,275* |
|
Computer |
55,920 |
67,304* |
95,250* |
|
Electrical, electronics, and communications |
55,333 |
68,247 |
77,860* |
|
Environmental and environmental health |
47,914 |
— |
— |
|
Industrial/manufacturing |
54,585 |
62,607 |
78,737* |
|
Materials |
53,056 |
— |
— |
|
Mechanical |
54,057 |
63,209 |
70,928* |
|
Mining & mineral (including geological) |
52,624* |
50,167* |
— |
|
Nuclear (including engineering physics) |
55,966 |
62,848* |
— |
|
Petroleum |
59,408* |
57,000* |
— |
|
* Less than 50 offers reported SOURCE: Reprinted from Fall 2007 Salary Survey, with permission of the National Association of Colleges and Employers, copyright holder. |
|||
Earnings for more experienced mechanical engineers (with Ph.D.s) as measured by median annual salary since degree (Figure 3-12), grew 3.1 percent annually between 1993 and 2003, which is 0.7 percent more than inflation.21
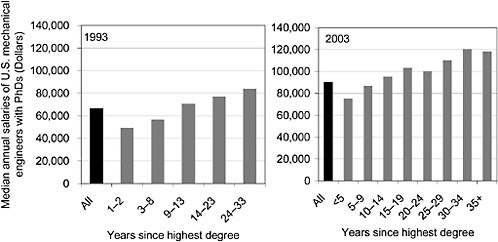
FIGURE 3-12 Median annual salaries for mechanical engineers with Ph.D.s by years since highest degree received, 1993 and 2003. SOURCE: National Science Foundation/Science Resources Statistics, 1993 and 2003 Survey of Doctorate Recipients.
R&D FUNDING
Here the panel looks at trends in international levels and S&E funding and specific R&D funding for mechanical engineering in the United States. As discussed earlier, the U.S. innovation system benefits greatly from the variety as well as consistency of funding sources.
Steady Funding for S&E in the United States
The United States spent more on science and engineering R&D over 1981-2002 than any other OECD (Organisation for Economic Cooperation and Development) country (Figure 3-13). In 2003, the U.S. spent more than $250 billion (constant 2000 U.S. dollars) on total R&D.
About $50 billion of the U.S. expenditures were defense related (Figure 3-14), which is equivalent to Germany’s total S&E expenditures. The United States accounted for more than 40 percent of the yearly international expenditures for S&E. Between 1981 and 2001, the U.S. contribution has declined from 45 percent to 43 percent, and the G7 contribution from 91 percent to 84 percent.
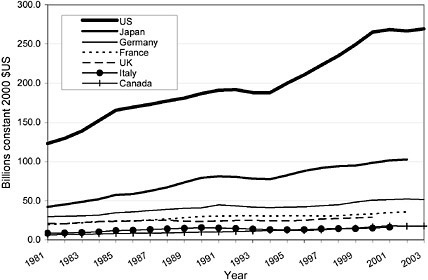
FIGURE 3-13 International R&D expenditures for G7 countries, 1981-2003 in billions of constant 2000 U.S. dollars. SOURCE: NSF, S&E Indicators 2006, Appendix Table 4-42.
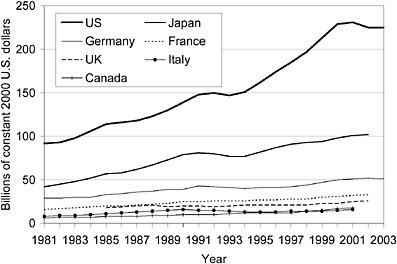
FIGURE 3-14 International nondefense R&D expenditures for select countries, 1981-2003. SOURCE: NSF, S&E Indicators 2006, Appendix Table 4-43.
The intensity of a nation’s investment in S&E is better measured as a percentage of its gross domestic product (GDP) spent on R&D. In 2003 the United States spent a smaller percentage of its GDP (2.2 percent) on nondefense R&D than either Japan (3.1 percent) or Germany (2.5 percent; see Figure 3-15). The European Union has a stated goal of spending 3.0 percent of GDP on research. In December 2006 the European Parliament approved the Seventh Framework Program, a 55 billion Euro, seven-year package to increase the research budget by 40 percent.22
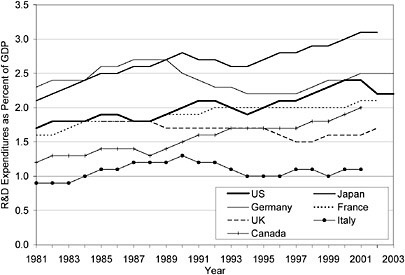
FIGURE 3-15 International nondefense R&D as percentage of GDP, by selected country, 1981-2003. SOURCE: NSF, S&E Indicators 2006, Appendix Table 4-43
Steady, but Unbalanced U.S. Funding for Mechanical Engineering
In 2005, reported academic spending on mechanical engineering R&D totaled more than $900 million (Figure 3-16). Of this, about two-thirds consisted of federal sources.
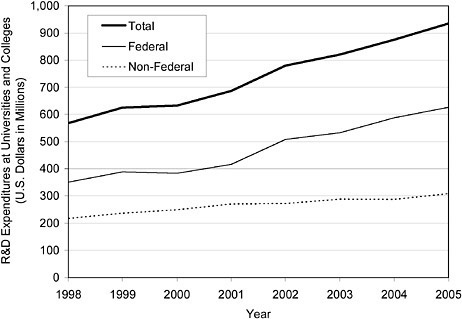
FIGURE 3-16 Federal and nonfederal R&D expenditures at academic institutions in mechanical engineering. Nonfederal expenditures include state and local government, industry, institutionally, and other financed academic R&D expenditures. SOURCE: NSF/SRS, Survey of Research and Development Expenditures at Universities and Colleges, FY 2004.
In terms of constant 2000 dollars, the reported U.S. federal government funding (obligations)23 for total research in mechanical engineering declined from a high of almost $550 million in 1993 to just over $250 million in 2003 (Figure 3-17), which is similar to levels in the early 1980s. There could be multiple reasons for this decline. One that has been documented in the past has to do with changes in NSF classification of funding by field of research, which changed in 1996.24 Federal obligations for mechanical engineering over the period 1999-2003 were on average about 1 percent of the total U.S. R&D budget.
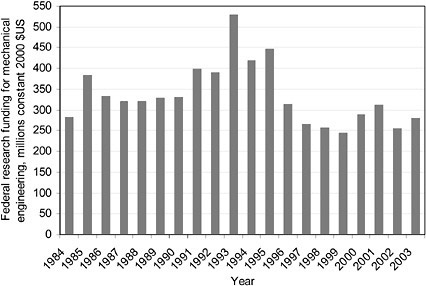
FIGURE 3-17 Federal obligations for total research in mechanical engineering. SOURCE: NSF, S&E Indicators 2006, Appendix Table 4-32
Federal funding for mechanical engineering research is comparable with spending for the other “big four” engineering fields of civil and chemical engineering, with the exception of electrical engineering, which has traditionally been better funded than chemical, civil, and mechanical engineering (Figure 3-18).
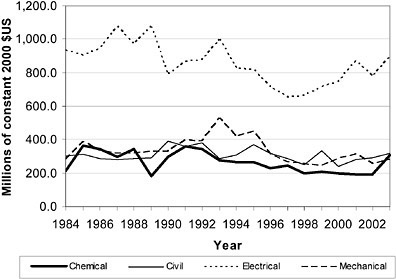
FIGURE 3-18 Federal obligations for total research, by engineering field: FY 1984-2003. SOURCE: NSF, S&E Indicators 2006, Appendix Table 4-32
DOD has accounted for the largest proportion of federal obligations for mechanical engineering research over the years (Figure 3-19). However, in the past, other agencies accounted for a larger proportion, especially for basic research (Figure 3-20). In 1994 DOD accounted for 70 percent of the federal obligations for mechanical engineering research, whereas in 2004, DOD accounted for 84 percent.
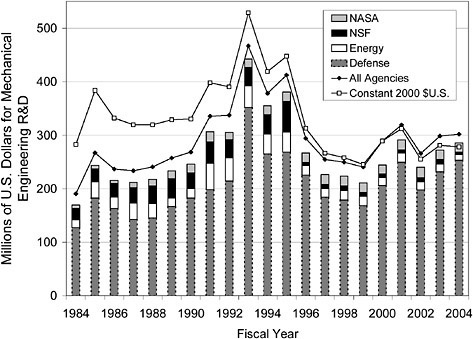
FIGURE 3-19 Federal obligations for total research in mechanical engineering, 1984-2004. SOURCE: NSF, Federal Funds for R&D, http://www.nsf.gov/statistics/fedfunds/ (accessed July 12, 2007).
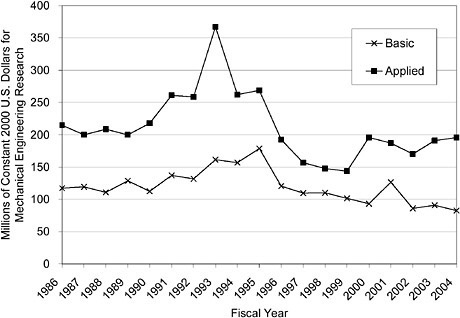
FIGURE 3-20 Federal obligations for applied versus basic research in mechanical engineering in constant 2000 U.S. Dollars, fiscal years 1986-2004. SOURCE: NSF, Federal Funds for R&D, http://webcaspar.nsf.gov (accessed September 19, 2007).
The dominance of DOD funding for mechanical engineering is significant for basic research, because other agency contributions have been diminished (Figure 3-21). NSF in particular contributed significantly less in 2004 than in 1994. The dominance of a single agency has likely created uneven funding opportunities in mechanical engineering.
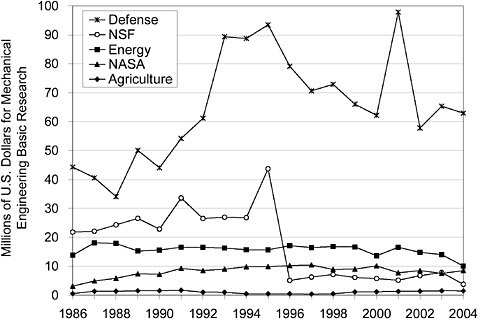
FIGURE 3-21 Federal obligations for Basic Research in Mechanical Engineering by Agency for Fiscal Years 1986-2004. SOURCE: NSF, Federal Funds for R&D, http://webcaspar.nsf.gov (accessed September 19, 2007).
DOD obligations for basic research in mechanical engineering largely come from the Air Force, Army, and Navy (Table 3-3). Specific information on the breakdown of DOD funding for specific areas of mechanical engineering is not readily available, but the type of mechanical engineering research funded is described on the various DOD organization websites. According to the Army Research Office website,25 “it supports fundamental investigations in the areas of solid mechanics, structures and dynamics, combustion and propulsion, and fluid dynamics.” The Air Force Office of Scientific Research website26 indicates it supports “A wide range of fundamental research addressing structures, structural materials, solid mechanics, fluid dynamics, propulsion, and chemistry.”
|
25 |
http://www.arl.army.mil/www/default.cfm?Action=29&Page=187 (accessed September 18, 2007) |
|
26 |
http://www.afosr.af.mil/ResearchAreas/research_aero.htm (accessed September 18, 2007) |
TABLE 3-3 U.S. Department of Defense Obligations for Mechanical Engineering Research (U.S. Dollars in thousands)
|
|
1994 |
2004 |
||||
|
Total |
Basic |
Applied |
Total |
Basic |
Applied |
|
|
Total |
252,999 |
76,705 |
176,294 |
253,400 |
62,901 |
190,499 |
|
Defense agencies |
33,876 |
20 |
13,876 |
14.391 |
2,172 |
12,219 |
|
Defense Advanced Research Projects Agency |
372 |
0 |
372 |
10,750 |
0 |
10,750 |
|
Balistic Missile Defense |
12,165 |
|
12,165 |
|
|
|
|
Defense Nuclear |
1,339 |
|
1,339 |
|
|
|
|
Washington Headquarters Services |
20,000 |
20,000 |
0 |
3,641 |
2,172 |
1,469 |
|
Air Force |
33,789 |
11,646 |
22,143 |
34,727 |
7,696 |
27,031 |
|
Army |
97,517 |
13,586 |
83,931 |
147,973 |
26,962 |
121,011 |
|
Navy |
87,817 |
31,473 |
56,344 |
56,309 |
26,071 |
30,238 |
|
SOURCE: National Science Foundation, Survey of Federal Funds for Research and Development, 1994 and 2004. |
||||||
Other federal agencies also vary in the specific information they provide on the breakdown of funding for specific areas of mechanical engineering. Below is a comparison of Department of Energy Basic Energy Sciences funding for core research areas in materials (Figure 3-22) for fiscal year 2001 and fiscal year 2005, which includes the core research area of mechanical behavior and radiation effects. According to DOE, “This activity supports basic research to understand the deformation, embrittlement, fracture, and radiation damage of materials with an emphasis on the relationships between mechanical behavior and radiation effects and defects in the material. This research builds on atomic level understanding of the relationship between mechanical behavior and defects in order to develop predictive models of materials behavior for the design of materials having superior mechanical behavior such as at very high temperatures.”
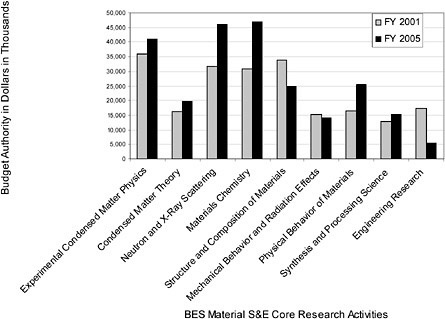
FIGURE 3-22 Department of Energy Basic Energy Sciences Funding for Material Science and Engineering Core Research Activities. SOURCE: http://www.er.doe.gov/bes/brochures/CRA.html.
Figure 3-23 shows the breakdown for funding for the NSF Engineering Directorate. NSF support for mechanical engineering research comes largely from Civil, Mechanical and Manufacturing Innovation (CMMI) Division. CMMI funds research in a various areas of mechanical engineering, including architectural and mechanical systems, dynamics and control systems, manufacturing machines and equipment, mechanics and structure of materials, and nano/bio mechanics. Mechanical engineering basic research in thermal systems and fluid mechanics, as well as a work in micro- and nanofluids and heat transfer is funded by CBET.
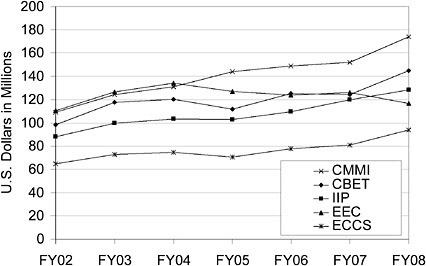
FIGURE 3-23 NSF Engineering Directorate funding for divisions in millions of U.S. dollars: Civil, Mechanical and Manufacturing Innovation (CMMI); Chemical, Bioengineering, Environmental and Transport Systems (CBET); Industrial Innovation and Partnerships (IIP); Engineering Education and Centers (EEC); and Electrical, Communications and Cyber Systems (ECCS).
NOTE: FY2007 and FY2008 are proposed budgets. SOURCE: NSF fiscal year 2008 budget request, available at http://www.nsf.gov/about/budget (accessed July 12, 2007).
Table 3-4 shows the overall research proposal funding rate for CMMI. While, the number of awards has remained fairly stable and the median annual size of awards has increased between 1997 and 2006, the funding rate for awards has decreased by 11 percent, from 28 percent in 1997 to 17 percent in 2006. 27 The funding rate for awards in CBET decreased by 13 percent, from 30 percent in 1997 to 17 percent in 2006. In comparison, the funding rate for the NSF engineering directorate and NSF as a whole declined by only 8 percent during this same time period. Comparable data on proposal funding rates for other funding agencies were not readily available.
|
27 |
NSF Budget Internet Information System, http://dellweb.bfa.nsf.gov/ |
TABLE 3-4 Research Proposal Funding Rate for NSF CMMI Division, FY 1997 to 2006
|
FY |
No. of Proposals |
No. of Awards |
Funding Rate (%) |
Median Annual Size |
|
2006 |
2,860 |
478 |
17 |
$83,332 |
|
2005 |
2,644 |
475 |
18 |
$81,700 |
|
2004 |
2,576 |
515 |
20 |
$78,000 |
|
2003 |
2,618 |
515 |
20 |
$79,916 |
|
2002 |
2,418 |
489 |
20 |
$74,076 |
|
2001 |
2,205 |
403 |
18 |
$72,000 |
|
2000 |
1,891 |
480 |
25 |
$66,711 |
|
1999 |
1,514 |
422 |
28 |
$62,017 |
|
1998 |
1,753 |
383 |
22 |
$59,335 |
|
1997 |
1,574 |
434 |
28 |
$60,522 |
|
SOURCE: NSF Budget Internet Information System, http://dellweb.bfa.nsf.gov/ (accessed July 12, 2007). |
||||
SUMMARY
U.S. research leadership in mechanical engineering basic research is the result of a combination of key factors, including a national instinct to respond to external challenges and to compete for leadership. Over the years, the United States has been a leader in innovation as a result of cutting-edge facilities and centers, and a steady flow of mechanical engineers and research funding.
-
Major centers and facilities provide key infrastructure and capabilities for conducting research and have provided the foundation for U.S. leadership. Key capabilities for mechanical engineering basic research include the following
-
Measurement and standards
-
Materials characterization and micro- and nanofabrication
-
Manufacturing and automation
-
Biomechanical engineering
-
Supercomputing and cyberinfrastructure
-
Small- and large-scale flow systems
-
-
There is increasingly strong competition for international science and engineering human resources. The United States has maintained a steady supply of Ph.D. mechanical engineering graduates over the years. This is largely the result of increased reliance upon foreign-born students. Between 1997 and 2005, the number of U.S. citizens who received mechanical engineering Ph.D. degrees declined 35 percent.
-
Research funding for S&E overall and mechanical engineering in particular has been steady. In 2005, more than $900 million was spent on mechanical engineering R&D at academic institutions. Of this, about two-thirds were federal expenditures. Federal support for U.S. mechanical engineering research between 1999 and 2003 was on average about one percent of the total U.S. R&D budget, with the largest portion (more than 70 percent) coming from DOD.


