
CHAPTER TWO
Aligning Priorities with Societal Risks from Tsunamis
SUMMARY
This chapter reviews progress toward understanding the nation’s tsunami risk, which is the first step in a comprehensive tsunami program. The knowledge of the hazards tsunamis pose is evolving. The nation is just beginning to understand the populations and social assets that tsunamis threaten, the readiness of individuals and communities to evacuate, and the losses of life and property they may cause. Although much has been learned about the nation’s tsunami risk, the nation remains far from understanding enough of its tsunami risk to set priorities and allocate resources for tsunami mitigation efforts based on risk.
The chapter evaluates progress and identifies opportunities for the National Oceanic and Atmospheric Administration (NOAA) and the National Tsunami Hazard Mitigation Program (NTHMP) to advance the goal of hazard and evacuation mapping and a comprehensive national risk assessment. Among other things, hazard modeling serves as the basis to produce evacuation maps, which are a critical tool in educating and preparing the public. The committee concludes that it is unclear whether current evacuation maps are sufficient for enabling effective evacuations or preparing the public due to the absence of uniform quality standards, evaluative metrics, or guidelines on what constitutes effective mapping approaches.
The advice, directed mainly at NTHMP partners and listed here in summary form, includes:
-
Completion of an initial, national tsunami risk assessment in the near term to inform program prioritization.
-
Periodic reappraisal of tsunami sources and modeling codes, achieved in part through workshops and peer review.
-
Greater consistency, across state boundaries, in the methods, criteria, and judgments employed in modeling of tsunami inundation, achieved in part through collaboration among federal and state partners and through external review of inundation maps.
-
Evaluations of the effectiveness of hazard maps, leading to standards that increase the overall quality and consistency of these maps.
-
Recurring inventories of the number and kinds of people in tsunami hazard zones, with special attention to high-risk groups including children, the infirm, and tourists.
-
Identification of areas where successful evacuation from a tsunami would require buildings or engineered berms.
INTRODUCTION
Understanding risk is a prerequisite to effectively preparing and warning endangered people of potential and imminent tsunamis. To that effect, officials must understand in advance (1) where and to what extent tsunami inundation may occur and the amount of time before waves arrive, (2) the characteristics of the population and communities in tsunami-prone areas, and (3) how prepared individuals and communities are for evacuation.
Risk, as used in this report, is a concept used to give meaning to things, forces, or circumstances that pose danger to people or what they value (see also Box 2.1). It takes into account
|
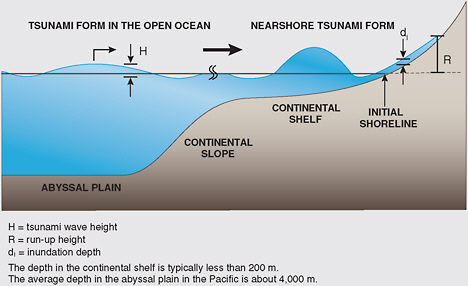
BOX 2.1 Definitions Risk is a concept used to give meaning to things, forces, or circumstances that pose danger to people or what they value. Risk descriptions are typically stated in terms of the likelihood of harm or loss of a vulnerable thing or process (e.g., health of human beings or an ecosystem, personal property, quality of life, ability to carry on an economic activity) due to a physical event (i.e., hazard) (National Research Council, 1996a). Some researchers have used the term risk to quantify the likelihood of future tsunamis, while others have defined it as a product of the probability of tsunami-attributable social damage (e.g., buildings, lives, businesses) and the magnitude of that damage. Research shows that managers, policy makers, and members of the public rarely define risk as an objective calculation; instead, perceptions vary according to differences in awareness, experiences, and social context (Fischhoff et al., 1984; Weichselgartner, 2001). Hazard is the physical characteristics of an event (e.g., tsunami: speed of onset, impact forces, currents, inundation area) that can pose a threat to people and the things they value. Vulnerability is the personal or situational conditions that increase the susceptibility of people or resources to harm from the hazard. Inundation refers to the process of coastal flooding due to tsunamis or storm waves regardless of the impact to human activities. Run-up height is the vertical elevation of the most landward penetration of the tsunami wave with respect to the initial sea level (figure opposite page). Run-up is a vertical distance, while inundation is a horizontal distance. Inundation models determine the areas likely to be flooded by a tsunami and involve numerical computations of tsunami evolution for specific tsunami scenario or consider an ensemble of tsunami scenarios that might affect the map area. Hazard maps depict inundation areas on base maps that typically include contours, imagery, buildings, roads, and/or critical infrastructure and take into account local geologic knowledge. Evacuation maps depict areas that need to be evacuated in the event of a tsunami and to show evacuation routes to safe havens. Evacuation maps are based on the same inundation zones in hazard |
the likelihood and physical characteristics of tsunamis (i.e., the hazard), the personal or situational conditions that increase the susceptibility of people or resources to harm from the tsunami (i.e., vulnerability), and associated uncertainties.
This chapter first introduces tsunami risk assessment by identifying roles it may play in reducing the losses of life and property to tsunamis and by summarizing broad approaches to risk assessment. The rest of the chapter reviews progress in assessing tsunami hazard and tsunami vulnerability. Aspects of perceptions, knowledge, and preparedness levels that influence individual resilience are discussed in the following chapter.
COMPREHENSIVE RISK ASSESSMENT
Tsunami risk assessment is fundamental to the nation’s tsunami programs, because it can help support and guide risk reduction efforts, including tsunami education, preparedness planning, and warning system development. In particular, it can help allocate resources according to greatest risk and thus ensure that efforts are prioritized to protect the most people. The following three examples illustrate the benefits of such an assessment:
-
Priorities among states. A comprehensive tsunami risk assessment could improve resource allocations among states, territories, and commonwealths. In 2006, the Government Accountability Office (GAO) observed that “with the likely expansion of the NTHMP from 5 state participants to potentially 28 state and territorial participants in 2006, it will be difficult for NOAA to ensure that the most threatened states receive the resources they need to continue and to complete key mitigation activities without an updated, risk-based strategic plan” (Government Accountability Office, 2006). To this date, NTHMP resources are being allocated on the basis of estimated hazards, without regard for vulnerability (National Tsunami Hazard Mitigation Program, 2009a).
-
Priorities among program elements. A comprehensive tsunami risk assessment coupled with cost-benefit analyses could also help NOAA weigh the value of warning and forecasting on the one hand against that of education and community preparedness on the other. The GAO’s 2006 report noted that
NOAA’s initial strengthening efforts emphasize detection and warning for distant tsunamis, while the greater risk to most locations in the United States— according to NOAA data as well as the National Science and Technology Council’s (NSTC) December 2005 report on tsunami risk reduction—[is] likely to be posed by local tsunamis. For example, the deployment of Deep-ocean Assessment and Reporting of Tsunamis (DART) stations and warning center enhancements will not reduce the local tsunami risk as directly as other strategies such as educating vulnerable populations to immediately head for high ground when the earth shakes near the coast (Government Accountability Office, 2006).
-
Program development. Understanding tsunami risk helps averts surprises. In the 1980s, the Cascadia subduction zone became known as a source of catastrophic tsunamis, first from geophysical clues that it might produce such waves and then through geological signs that it had (Atwater et al., 2005). These discoveries about the tsunami hazard were the first indication of the need for Washington, Oregon, and California to take steps to prepare to build tsunami-resilient communities before the next great Cascadia tsunami strikes. These discoveries also helped create the NTHMP itself. When the NTHMP originated in the mid-1990s, it was founded in part on then-recent discoveries about tsunami risk. Oregon’s concern about Cascadia tsunami hazards played a central role in the NTHMP’s establishment, according to committee members’ interviews with founding members of the NTHMP steering group.
Tsunami risk assessments are challenging due to (1) the paucity of information about the frequency, sources, and characteristics of past tsunamis, (2) the complex and interdependent nature of coastal communities in larger economic or sociopolitical systems, (3) the poorly defined mix of near-field and far-field tsunami hazards that coastal communities face, and (4) the uncertainty of potential impacts of future events. Although societal risk from tsunamis is challenging to assess, it is critical information for the development and prioritization or risk-reduction efforts, such as education, preparedness planning, warning-system development, mitigation planning, and response strategies.
An effective risk characterization should be undertaken with local decision makers in mind and should be directed toward informing specific choices of public officials and affected individuals (National Research Council, 1996a). When developing the analysis for decision tools (e.g., inundation maps, vulnerability assessments, evacuation maps), scientists need to engage and deliberate with decision makers to assess their information needs and create useful decision tools (e.g., Fischhoff et al., 1978; National Research Council, 1996a, 2007; Gregory and Wellman, 2001; Bostrom et al., 2008; Renn, 2008). Risk analysis involves the systematic collection and interpretation of quantitative or qualitative data to better understand hazards and vulnerable communities (National Research Council, 1996a). Risk deliberation is any communicative process in which technical experts, public officials, and affected parties collectively consider risk issues to ensure that decision-relevant knowledge and diverse perspectives are included in any risk reduction process (National Research Council, 1996a).
There is no single method to properly characterize all aspects of risk from tsunamis; different techniques are needed to address different aspects (e.g., demographic sensitivity, structural fragility, financial exposure) and their potential risk-reducing adjustments (e.g., education programs, structural mitigation, insurance). However, best practices suggest including assessments of possible exposure sources and pathways (including geospatially specific susceptibilities to tsunamis), potential consequences, the effects of feasible risk reduction options, and the probabilities and uncertainties of exposures and ensuing effects. Probabilistic assessment can be a tool to provide a basis for cost-benefit analysis and design considerations for tsunami mitigation efforts (e.g., design criteria of an evacuation structure) and a transparent basis for prioritizing resources. Geographic information system (GIS)-based analyses of socioeconomic exposure to tsunamis are useful for identifying demographic sensitivities within a community that could impact evacuations. Assessments of adaptive capacity and resilience can identify educational needs and pre-event preparedness levels.
The level of sophistication, accuracy, resolution, and format required for assessing societal risk to tsunamis will depend on the intended use of the information. For example, education efforts designed to raise hazard awareness, such as teaching people to recognize natural cues, may only require oral histories from tsunami survivors (Dudley, 1999) or coarse delineations of run-ups from past events (Theilen-Willige, 2006) to indicate tsunami-prone areas (see Box 2.1 for definitions). By contrast, evacuation planning usually requires computer modeling of various tsunami evacuation scenarios (Katada et al., 2006; Yeh et al., 2009). Urban planning or detailed assessments of economic impacts require even higher resolution calculations (Borrero et al., 2005).
So far, no comprehensive risk assessments have been undertaken that could guide the setting of priorities at the state or national level. Existing risk assessments are uneven and are typically isolated efforts for specific sites (e.g., González et al., 2006). The only national assessment to date is an evaluation of tsunami hazards, based on the written historical records available at the NOAA/National Geophysical Data Center (NGDC) (Dunbar and Weaver, 2008) with the rationale being that “the state of geologic knowledge [of tsunami sources] does not permit the calculation of meaningful probabilities of occurrence.”
Although hazard researchers may be uncomfortable with the lack of information about occurrence, probabilistic risk assessment can be an indicator for the relevance and import of existing evidence, despite the uncertainties. Probabilistic risk assessment for nuclear power plants and for earthquakes show how risk assessments can be constructed for rare, high-consequence events in order to inform planning efforts and designs (e.g., McGuire and Becker, 2004; McGuire, 2008). Where data are sparse, expert judgment can be used to qualify the available data appropriately. For example, tsunami planning has been so far based on worst-case scenarios, with inconsistent choices made about specific scenarios and little understanding of consequences or expected losses. Where extremely rare, high-consequence events are the worst case, communities that are much more likely to see smaller yet damaging tsunamis may not be prioritized for funding. Such tradeoffs deserve to be explicitly considered and can be incorporated into quantitative and qualitative risk assessments using expert judgment in a deliberative process (National Research Council, 1996a).
Conclusion: The United States lacks a national tsunami risk assessment that characterizes the hazards posed by tsunamis, inventories the populations and social assets threatened by tsunamis, measures the preparedness and ability of individuals and communities for successful tsunami evacuations, and forecasts expected losses. This information is needed to help spur and prioritize investments in preparedness, education, detection, and warning efforts and for developing long-term strategic planning at the local, state, and federal level.
Recommendation: NOAA and its NTHMP partners, in collaboration with researchers in social and physical sciences, should complete an initial national assessment of tsunami risk in the near term to guide prioritization of program elements. The national tsunami risk assessment should (1) incorporate the best possible relevant science (social and behavioral science, geography, economics, engineering, oceanography, and geophysics) and (2) include broad stakeholder and scientific participation to ensure that efforts are responsive to the needs of at-risk communities and decision makers.
TSUNAMI HAZARD ASSESSMENT
Tsunami hazard assessments focus on characterizing and visualizing the physical characteristics of future tsunamis (e.g., speed of onset, impact forces, currents, inundation area) that can pose a threat to people and the things they value. Understanding where tsunami inundation is likely and how much time at-risk individuals have to evacuate frame the discussion of societal risk to tsunamis and are the foundations upon which education, preparedness plans, response plans, and mitigation strategies are developed. Tsunami hazard assessments typically entail three elements: (1) inundation models to determine the areas likely to be flooded, (2) hazard maps that portray inundation-model outputs on community base maps (e.g., roads, elevation, structures), and (3) evacuation maps that depict areas that may need to be evacuated in the event of tsunamis. The purpose of this section is to describe each of these elements, progress in the development and implementation of each element, and areas for improvement.
Before discussing each individually, it is important to distinguish the differences between the three elements. For example, although hazard and evacuation maps are both used for reducing tsunami risk, the two types of tsunami maps are developed in different ways and for different purposes (Figure 2.1). Inundation model outputs simply denote the physical characteristics of tsunami generation, propagation, and inundation areas and do not recognize political boundaries. Tsunami hazard maps portray inundation model outputs with some modification to reflect local knowledge of land conditions, are organized by communities, and include basic societal assets (e.g., roads, major structures). Tsunami evacuation maps incorporate the same inundation areas as hazard maps, but typically denote larger zones to accommodate local risk tolerance and to allow for easier identification of landmarks (e.g., at-risk individuals can identify major roads easier than a specific elevation contour). Evacuation maps also differ from hazard maps in that they are educational tools designed to be easily understood by non-scientists and typically identify evacuation shelters and assembly sites (both natural and manmade), suggested routes, locations of warning loudspeakers, and transportation infrastructure to facilitate evacuations (e.g., streets, bridges). Inundation models and hazard maps are developed by scientists to identify and communicate maximum inundation areas and flow conditions, whereas evacuation maps are designed by scientists in collaboration with local, state, and federal emergency management and public safety agencies to identify areas of public safety concern.
Inundation Modeling
Credible tsunami inundation modeling requires three elements: (1) an understanding of the tsunami source that generates the tsunami, usually through estimation of seafloor displacement; (2) accurate and precise bathymetric and topographic data to understand the surface over which the waves propagate; and (3) a robust hydrodynamic computational model to simulate tsunami evolution. Each of these three elements are treated below in turn and offer two sets of conclusions and recommendations—one on ways of reducing uncertainties about tsunami sources and the other on hydrodynamic modeling.
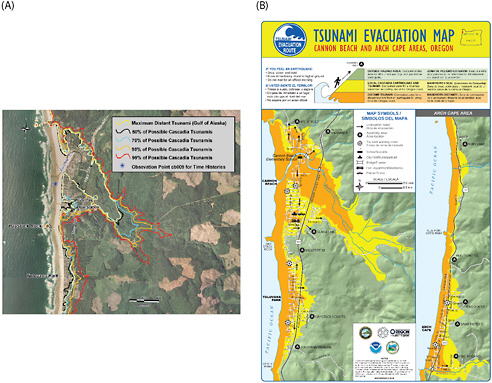
FIGURE 2.1 Tsunami maps for Cannon Beach, Oregon, including (A) a tsunami hazard map developed for a Cascadia subduction zone earthquake scenario and (B) an evacuation map that includes evacuation zones for a Cascadia-related tsunami (in yellow) and a far-field tsunami (in orange). SOURCE: http://www.oregongeology.org/sub/default.htm; image courtesy of DOGAMI.
Tsunami Sources
The societal value of inundation models depends largely on estimates of tsunami sources (Synolakis et al., 1997). If a modeler underestimates a tsunami source, a real tsunami may inundate places the modeling had deemed safe and lives could be unnecessarily lost as a result. If instead the modeler overestimates the tsunami source, risk reduction efforts may be cost-prohibitive and more people and businesses may be unnecessarily affected in future evacuations.
Large uncertainties remain concerning the sources of tsunamis that could inundate U.S. shorelines. These sources include subduction zones of the Pacific Rim and Caribbean, underwater landslides off the Atlantic and Gulf Coasts and off southern California, and volcanoes in
Alaska (Figure 2.2, Appendix A). The next six paragraphs illustrate unknowns that are spelled out more fully as questions in Appendix A.
Far-field heights of tsunamis from circum-Pacific sources. For hazard and evacuation mapping, simulations of far-field tsunami heights on U.S. Pacific shores require estimates about tsunami sources at subduction zones on the Ring of Fire (Figure 2.2). The simulations are sensitive to earthquake size because far-field tsunami height increases substantially with earthquake magnitude (Abe, 1979). For example, to make worst-case simulations for Pearl Harbor, a NOAA group used 18 tsunami sources, together spanning all subduction zones on the Pacific Rim (Tang et al., 2006). For each source, the group used an earthquake of magnitude 9.3 (McCaffrey, 2008). For some of the subduction zones, the assumed magnitude 9.3 differs from the largest known earthquake magnitude of the past, which falls short of 8.0 or 8.5 (blue or brown, respectively, in Figure 2.2). This difference in assumed source magnitude results in the corresponding worst-case tsunami on distant U.S. shores to be larger by a factor of about 10 from the tsunamis of the past.
Far-field hazards from Alaskan sources. Earthquake-generated tsunamis from sources along the Aleutian-Alaskan subduction zone pose far-field tsunami hazards in Washington, Oregon, California, and Hawaii. If a hazard map is to give each of these sources appropriate weight, it is necessary to estimate how large the earthquakes can get and how often they happen (Geist and Parsons, 2006; González et al., 2006). For tsunamis from most of the Aleutian-Alaskan subduction zone, currently there is almost no basis for such weighting except for geophysical estimates of how much plate motion gets spent on earthquakes of various sizes (González et al., 2006; Wesson et al., 2008). Little is known about how often the tsunamis actually recur except for the source of the oceanwide 1964 Alaskan tsunami (Carver and Plafker, 2008). Even for the 1964 source, it is unclear whether the next large tsunami is expected to recur sooner than average because the 1964 earthquake ended a recurrence interval, which was 300 years longer than the previous 600-year average.
Near-field hazards from Cascadia tsunamis. Although documented geological histories of great Cascadia earthquakes extend thousands of years into the past, persistent uncertainties about them have yielded wide-ranging estimates of tsunami hazards. A probabilistic analysis of tsunami hazards in Seaside, Oregon, showed the hazard to be sensitive to variability in earthquake size and recurrence (González et al., 2006). A subsequent hazard map for nearby Cannon Beach doubled the maximum tsunami height relative to previous estimates (Priest et al., 2009).
Caribbean hazards. Islands of the Caribbean are threatened by tsunamis mainly from local tectonic sources and the subsequent potential for submarine landslide. One tsunami source, near Puerto Rico, may even threaten coastlines as far away as Massachusetts. Local tsunami sources caused loss of life in the Virgin Islands in 1867 and in western Puerto Rico in 1918 (O’Loughlin and Lander, 2003). The 1867 tsunami began during an earthquake (Reid and Taber, 1920; McCann, 1985), as did the 1918 tsunami (Reid and Taber, 1919). However, the 1918
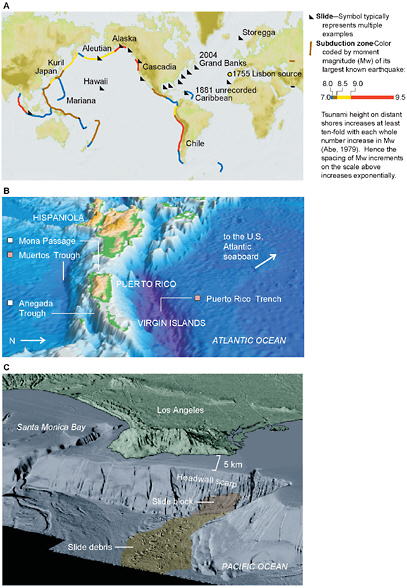
FIGURE 2.2 Illustrations of various tsunami sources. (A) Global sketch of subduction zones and landslides known or inferred to pose tsunami hazards. The blue, brown, and yellow lines do not necessarily represent maximum earthquake size, as discussed in the text and further illustrated in Appendix A. The depiction of landslides emphasizes those regarded as posing a tsunami threat to the United States and its territories. SOURCE: Committee member. (B) The offshore area of Puerto Rico. SOURCE: Image courtesy of Uri ten Brink. (C) The offshore area near Los Angeles. SOURCE: Normark et al., 2004; with permission from Elsevier.
tsunami may owe most of its size to a submarine landslide in the earthquake’s focal region (López-Venegas et al., 2008). The 1867 and 1918 disasters are probably just the tip of an iceberg; they represent but a sample, during the geological instant of the past 150 years, of Caribbean tsunami sources that can be inferred from the region’s active tectonics (McCann, 1985; Grindlay et al., 2005; Mercado-Irizarry and Liu, 2006) and from its abundance of steep submarine slopes (ten Brink et al., 2004, 2006). Probably the biggest open question about these many Caribbean sources is the tsunami potential of the highly oblique subduction zone marked by the Puerto Rico Trench. This hypothetical tsunami source faces the low-lying metropolis of San Juan (pop. 0.5 million) and, farther afield, may threaten the Atlantic seaboard from the Carolinas to Massachusetts (Geist and Parsons, 2009). In addition to having all these tsunami sources of its own, the Caribbean bore the brunt of the documented far-field effects of the 1755 Lisbon tsunami (Barkan et al., 2009; Muir-Wood and Mignan, 2009). The tsunami did not appear to have a significant effect on San Juan, based on the absence of documentation in the extensive Spanish-language records from that part of the 18th century (McCann et al., undated).
Near-field hazards from slides off U.S. coasts. Submarine slides abound off the Atlantic coast, particularly in the Caribbean (above) and off New England and the Middle Atlantic states (Twichell et al., 2009). Submarine slides are also present beneath the Gulf of Mexico (Trabant et al., 2001) and off southern California (Lee, 2009). The probabilistic tsunami hazard the slides pose is poorly known. It may be low because most of the sliding appears to have occurred soon after the last glaciation, at a time when sediment supply and sea levels greatly differed from today’s (Lee, 2009). Much remains to be learned about slide size, speed, and duration (Locat et al., 2009), all of which affect a slide’s efficiency in setting off a tsunami (Geist et al., 2009).
Tsunami sources that have escaped notice. That such sources remain undiscovered can be inferred from the recent identification of tsunami threats that had previously gone unrecognized—from great earthquakes on the Cascadia subduction zone (Atwater et al., 2005), faults and landslides beneath Puget Sound (Bucknam et al., 1992), outsize subduction earthquakes off northeast Japan (Nanayama et al., 2003), and landslides off Norway (Haflidason et al., 2005), Puerto Rico (ten Brink et al., 2006), the U.S. Atlantic coast (ten Brink, 2009), and southern California (Lee, 2009).
Determining worst-case source scenarios. Decisions about worst-case tsunami sources for the purpose of inundation modeling (see below) vary among NTHMP members. Inundation modeling in Alaska uses historical events (e.g., the 1964 Great Alaskan Tsunami) as well as a set of hypothetical tsunami scenarios unique for each local community for the tsunami sources. Inundation modeling in Hawaii is also based on historical distant tsunamis (1946 Aleutian, 1952 Kamchatka, 1957 Alaska, 1960 Chile, and 1964 Alaska tsunamis). Inundation modeling in California is based on 6 to 15 local and distant sources (depending on map location) that result in a single maximum tsunami inundation scenario. The primary subduction-type fault threat for northern California is the Cascadia scenario, and other potentially important tsunami sources include distant tsunamis (e.g., earthquakes near Alaska or Japan) and submarine landslides.
Like northern California, the Oregon and open-ocean Washington coastlines are threatened by tsunamis generated by the Cascadia subduction zone earthquakes, and the different modeling approaches taken by each state illustrate the disparities in tsunami source determinations. Inundation modeling for the open-ocean coast of Washington related to a Cascadia scenario is based on tsunami source determinations conducted over 10 years ago in Oregon (Priest, 1997). Modeling efforts for the Oregon coast related to Cascadia scenarios are based on newer methods and source determinations (González et al., 2006; Priest et al., 2009), but those in the state of Washington were not. Input received by the committee from NTHMP representatives from Oregon and Washington revealed differences in opinions on the costs and benefits of newer modeling approaches. Oregon representatives believed improvements in inundation modeling approaches are essential for hazards assessments, whereas Washington representatives consider the existing maps to be sufficient and instead focus NTHMP funds on education and other preparedness efforts. The committee cannot fully comment on which philosophy is more appropriate because there has not been adequate discussion within the NTHMP on the relative costs, benefits, and utility of higher order models compared to existing methods. Until these discussions occur, individual states will likely continue their independent approaches. In addition, not all these source determinations are subject to rigorous peer-review. One consequence of these independent efforts is that different tsunami-source determinations in two states for the same tsunami scenario (e.g., Cascadia) complicate national efforts to compare societal risk from tsunamis.
With so many unknowns, what overall strategies are likely to define the sources of tsunamis that threaten the United States the most? One strategy is to focus on sources for near-field tsunamis. This focus is suitable for Alaska, the Cascadia coast of Washington, Oregon, and northern California, and the Caribbean. It can be justified by existing simulations of tsunami inundation that show greater flooding from near-field tsunamis than from far-field tsunamis in Alaska, Oregon, and northern California (Appendix C). It can also be justified by the importance of public education about tsunami hazards as a means of saving lives from near-field tsunamis (Chapter 3). Yet another reason to focus on near-field tsunamis is their sensitivity to local properties of their sources. These include the coastwise extent, depth range, and localized concentration of slip on a fault plane, and the orientation and speed of a landslide.
A second overall strategy is to look further back in time. A tsunami hazard assessment based on U.S. written history alone would overlook nearly all the tsunami hazards from earthquakes on the Cascadia subduction zone and the Seattle fault, and from most of the landslides off southern California and the U.S. Atlantic coast. Time intervals, or recurrence intervals, between earthquakes causing catastrophic tsunamis can be as long as centuries or millennia. The 2004 Indian Ocean tsunami, for example, seemingly lacked historical precedent because its most recent predecessor occurred 550-700 years ago (Jankaew et al., 2008). The preliminary hazard assessment by Dunbar and Weaver (2008) explicitly recognizes this issue and addresses it partially by drawing on national probabilistic seismic hazard mapping that incorporates earthquake histories, inevitably incomplete, that are drawn from geological records that span centuries or even millennia.
A third and final strategy is to employ tsunami source research. The uncertainties noted above, and in Appendix A, make clear that wide-ranging research is needed to advance the understanding of tsunami sources. The challenge is how to keep abreast of, and selectively encourage, research on the myriad sources of tsunamis that threaten U.S. shores. Nearly all this research is supported outside NOAA’s Tsunami Programs, through the National Science Foundation (NSF), the U.S. Geological Survey (USGS), and other organizations. The research engages physical scientists and engineers worldwide, illustrated by the research papers cited in Appendix A. Two elements of the National Earthquake Hazards Reduction Program (NEHRP) illustrate how the nation’s tsunami programs might harness their efforts to help define the subset of tsunami sources that are located near U.S. shores. The first of these elements is the periodic assessment of the nation’s seismic hazards. Every six years, the USGS produces, for use in the seismic provisions of building codes, a set of probabilistic National Seismic Hazard Maps (http://pubs.usgs.gov/fs/2008/3017/). These are supplemented by probabilistic seismic hazard maps of regional scope—Alaska, the Pacific Northwest, California. Updates to the earthquake maps involve a series of workshops (held in various parts of the country) that bring together scientists from government, academia, and consulting companies. The workshops provide a venue for new findings to be shared and vetted, earlier findings and assumptions to be checked, and new collaborations and research directions to be inspired. Much of this research bears directly on tsunami sources that adjoin U.S. shores. A second NEHRP element that might be adapted by the nation’s tsunami programs is an external grants program. NEHRP external grants administered by the USGS support research that commonly complements the earthquake research carried out internally by the USGS. A parallel external research program through NOAA might be used, in part, to help reduce uncertainties about key tsunami sources.
Conclusion: Because knowledge about the sizes and the recurrence intervals of tsunami sources are only emerging, improving the understanding of the tsunami sources is critical to producing comprehensive tsunami risk assessment. Currently, no formal procedures for periodic re-evaluation of tsunami risks exist. The NEHRP serves as an example of a successful and useful approach to periodic national assessments.
Recommendation: NOAA and its NTHMP should institute a periodic assessment of the sources of tsunamis that threaten the United States, focusing mainly on earthquakes, but also on landslides and volcanoes.
These assessments could be modeled after, and made jointly with, the assessments for National Seismic Hazard Maps. Like those maps, the appraisals could be updated every six years, but with regional assessments as needed. Key unknowns emphasized through this process could then become priority areas for an external research program that NOAA could model on the external grants program of the NEHRP in the USGS.
Bathymetry and Coastal Topography Data
Because of the wavelength of tsunamis being very long relative to the depth (typically on the order of several tens to hundreds of kilometers in deep water), tsunami propagation from source area to coastlines is strongly affected by the ocean bathymetry and coastal topography over which it travels. Therefore, inundation modeling requires integrated bathymetry data over the entire ocean basin and coastal topographic data. Requirements for horizontal resolution of bathymetric data are not constant and vary depending on depth. The General Bathymetric Chart of the Oceans (GEBCO) group recommends grid spacing of no more than 1 arc-minute (≈ 2 km) in a 4,000 m deep open ocean, 10 arc-second (≈ 300 m) in a 100 m deep continental shelf, 3 arc-second (≈ 90 m) in 10 m deep near-shore waters, and even smaller resolutions for modeling onshore run-up motions (Intergovernmental Oceanographic Commission and International Hydrographic Organization, 2005).
These recommendations for bathymetric data resolution are largely being met for the majority of the U.S. coastline. Gridded global bathymetry data with 30 arc-second (≈ 1 km) resolution recently became available from GEBCO (http://www.gebco.net/), and data were generated by the combination of ship depth soundings with interpolation between sounding points guided by satellite-derived gravity data from radar altimetry (Sandwell and Smith, 2009). High-resolution digital elevation models (DEMs) for U.S. coastal regions are being developed by NOAA’s NGDC (http://www.ngdc.noaa.gov/mgg/inundation/tsunami/inundation.html). Coastal bathymetric, topographic, and shoreline data are combined and integrated to yield the grid size ranging from 1/3 arc-second (~10 m) to 36 arc-seconds (~1 km) based on data compiled from various data sources (e.g., NGDC, National Ocean Service (NOS), USGS, Federal Emergency Management Agency (FEMA), U.S. Army Corps of Engineers (USACE), and other federal, state, and local government agencies, academic institutions, and private companies). These DEMs were developed specifically to support tsunami modeling efforts with NOAA’s numerical code Method of Splitting Tsunami (MOST) operated at NOAA/Pacific Marine Environmental Laboratory (PMEL) but are publicly available (http://www.ngdc.noaa.gov/mgg/inundation/tsunami/inundation.html). Although efforts by GEBCO and NOAA/NGDC have accelerated the development and access of precise bathymetric data, certain regions of the United States still lack adequate data to perform inundation modeling. For example, in coastal Alaska, only 3 sets of 1/3 arc-second data are currently available, whereas 16 sets are available for the Washington, Oregon, and California coasts.
Hydrodynamic Computational Models
Hydrodynamic modeling of tsunami generation, propagation, and run-up is challenging because of its complexity and multi-scale nature. It is complex because it involves multiphase (water, air, solid) interactions in a three-dimensional domain where some hydrodynamic fundamentals (e.g., turbulence) remain unsolved. The starting point for all inundation models is the source and how the bottom motion, in the case of tectonic displacements at the seafloor,
translates to the water-surface displacement. This requires advancing the understanding of the source and its rupture mechanisms given the current uncertainties around many of the potential sources. In addition to the source parameters, there is inherent uncertainty in the models and the accuracy of topographic and bathymetric data that precludes the possibility of a completely accurate and precise tsunami inundation model. It is multi-scale because of differences in the wavelength of tsunamis (on the order of hundreds of kilometers) and the effects of their inundation (to be described at scales of a few meters or less),and as such, numerical simulations must use nested or adapted grids (e.g., large grids for the propagation across the abyssal plain, smaller grids across the continental shelf, and the smallest grids for onshore run-up motions). The current state of knowledge regarding hydrodynamic modeling at various stages of tsunami propagation is discussed in the following section.
Tsunami propagation is usually computed based on the shallow water wave theory. The theory comprises conservations of fluid volume and linear momentum with the assumptions of hydrostatic pressure field, uniform horizontal velocities over depth, and water being incompressible. The shallow water wave theory can be justified because tsunamis from a seismic source are very long and the depth of ocean is relatively shallow (on the order of 4 km). Although tsunamis contain a wide range of spectral components at the source, most of the energy is contained in the long wave components, and shorter-length (higher frequency) waves are soon left behind and disperse. For tsunami propagation in the open ocean, the nonlinearity effect may be insignificant because the wave amplitude (less than a few meters) is much smaller than the depth; hence the linear shallow water wave theory with large spatial grid size (but less than 1 minute = 2 km) may be adequate for the propagation computations (Scientific Committee on Oceanic Research, 2001). Given that the actual resolution of the seafloor data is generally much poorer than 2 km, however, the impact of potential, realistic variability (e.g., assuming bathymetry obeys a power law) should be studied.
When the tsunami reaches the continental slope, a portion of incident tsunami energy could reflect back to the ocean, depending on the abruptness of the depth change. For the tsunami that travels onto the continental shelf, the amplitude will increase due to the shoaling effect; hence, the nonlinearity effect (i.e., measured by the ratio of wave amplitude to the depth) increases. At the same time, the dispersion effect (i.e., measured by the ratio of water depth to the wave length) could become important depending on the length of the incoming tsunami and the width of the continental shelf. When the continental shelf is sufficiently wide in comparison to the tsunami wavelength, a single pulse of the incoming tsunami could be transformed to a series of shorter waves. This phenomenon is often called “fission” (Madsen and Mei, 1969) when the incident wave is specifically a solitary wave—a stable permanent-form wave in shallow water. Although co-seismically generated tsunamis do not evolve to the “exact” form of solitary waves because of the insufficient distance to evolve in any oceans (Hammack and Segur, 1978), it is anticipated that the fission-like phenomenon must take place. When the width of the continental shelf is much smaller than the incoming tsunami wavelength, the intruding tsunami does not have sufficient time to split itself into a series of shorter waves; hence the tsunami could reach shore without significant dispersion. In the former case (i.e., dispersion effects are important), the model based on the Boussinesq approximation (weakly nonlinear and weakly
dispersive model) may be appropriate (Yeh et al., 1996; Liu et al., 2008), and in the latter case (i.e., nondispersion), it is appropriate to use the fully nonlinear shallow water wave theory to model tsunami propagation. Because the tsunami wavelength becomes shorter on the shelf than in the abyssal plain, and the bathymetry becomes more complex, a finer grid size is required for the simulation model in the continental shelf (Scientific Committee on Oceanic Research, 2001).
Once the tsunami commences the run-up onto the beach, hydrodynamic models need to consider and parameterize natural and human configurations (e.g., buildings, trees, mounds, roads) by assigning proper values to the friction factors. More sophisticated numerical models (e.g., based on 3-D Navier-Stokes model) may need to be implemented to assess the detailed effect of tsunami forces on structures (Yeh et al., 1996). Although modelers acknowledge the importance of natural and human configurations in influencing tsunami run-up, there is still significant uncertainty of their effect on tsunami propagation and inundation models.
More than 10 years ago, NOAA/PMEL attempted to initiate a tsunami community modeling activity to develop a functionality to coordinate and improve hydrodynamic models specifically used for tsunami prediction practice (Titov et al., 1999). The activity was intended to provide sharing of community models and databases, which would promote accelerating improvement of the models and applications. Because of lack of support this activity did not materialize at PMEL. However, similar concepts have been carried on elsewhere. The Arctic Regional Super-computing Center (ARSC) and Northwest Alliance for Computational Science & Engineering (NACSE) have developed the “Tsunami Computational Portal” (https://tsunamiportal.arsc.edu/). The portal provides a common interface for running and comparing the results of different hydrodynamic models for tsunamis and provides uniform access to the topographic and bathymetry data. Another instance is a model repository within one of NSF’s EVOs (Engineering Virtual Organization, Inundation Science & Engineering Cooperative (ISEC): http://isec.nacse.org/). The source codes of hydrodynamic models and full documentation are available in the repository, and the site includes a discussion forum. There appears to be a trend toward making hydrodynamic models, once proprietary codes are developed by individuals or organizations, more transparent and more easily shared, facilitating further improvement and applications.
Conclusion: Rapid improvements in the global and regional bathymetry datasets are substantial and provide adequate data for inundation modeling efforts in most places throughout the nation. However, some regions, such as coastal Alaska, still lack bathymetric data of sufficient quality and quantity, which impedes their hazard and evacuation mapping efforts. Regarding hydrodynamic models, the accuracy and precision of run-up models are hampered by uncertainties associated with the effects of coastal bathymetry, topography, vegetation, and structures.
Recommendations: To improve tsunami inundation modeling, the NTHMP, through workshops convened with the USGS and academic institutions, should periodically review progress in hydrodynamic models, including peer-reviews of modeling codes and discussions on how to better incorporate variations in coastal bathymetry, topography, vegetation, and buildings into inundation models.
Hazard Maps
The development of tsunami hazard maps in the United States has had three distinct historical phases: (1) before the establishment of the NTHMP in 1995; (2) between the establishment of the NTHMP in 1995 and the Tsunami Warning and Education Act in 2006; and (3) after the Tsunami Warning and Education Act of 2006. Prior to the development of the NTHMP in 1995, tsunami maps were only available in Hawaii and Alaska. With the creation of the NTHMP, funding became available for tsunami inundation modeling and mapping in the five Pacific states. Efforts were implemented within each state, with the intention of building local modeling capacity, improving tsunami awareness, leveraging state funds, and creating local stakeholders that could sustain tsunami efforts through periods of low federal funding. Progress in hazard mapping efforts as of 2001 was significant but not uniform across the states (Table 2.1; González et al., 2001).
Following the 2004 Indian Ocean tsunami, demand by coastal communities for hazard and evacuation maps increased, and several NTHMP members began to produce next generation maps at much higher resolution (Barberopoulou et al., 2009; Priest et al., 2009). The most recent tabulation of completed mapping efforts provided by the NTHMP (Table 2.2) yields little detailed information and no ability to compare the current inventory to the 2001 inventory; hence, it is difficult to assess progress since 2001 with regard to the numbers of coastal communities for which hazard mapping efforts had been completed. In general, however, it appears there has been some progress (yet not uniform as was the case in 2001) in mapping efforts across the NTHMP. Many NTHMP members cite a lack of resources as one of the key challenges to making progress in mapping inundation zones. Despite an increase in demand for tsunami hazard maps in the wake of the 2004 Indian Ocean tsunami, federal support to undertake mapping efforts did not increase and, in contrast, some states actually received fewer financial resources thereafter (Figure 2.3).
The 2006 Tsunami Warning and Education Act (P.L. 109-424) represents a new phase in tsunami inundation and hazard mapping because of mandates and recommendations in the public law. In response to language in the 2006 Act and a report by the Government Accountability Office (2006) to strengthen mapping efforts, the NTHMP formed a Mapping and Modeling Subcommittee (MMS) to coordinate its efforts. Additional language in the 2006 Act calls on the NOAA Tsunami Program to “provide tsunami forecasting capability based on models and measurements, including tsunami inundation models and maps” (P.L. 109-424, Section 4(b)(4)) and for the NTHMP to “use inundation models that meet a standard of accuracy defined by the Administration (i.e., NOAA) to improve the quality and extent of inundation mapping … in a coordinated and standardized fashion to maximize resources and the utility of data collected” (P.L. 109-424, Section 5(c)). The remainder of this sub-section discusses current efforts in relation to this new language.
Tsunami generation, propagation, and inundation are solely physical problems and do not recognize political borders. However, the committee found (contrary to the 2006 Tsunami Warning and Education Act) that the development and use of inundation modeling is not occurring in a standardized fashion across the NTHMP and that each NTHMP state member
TABLE 2.1 Status of Inundation Mapping
|
|
Pre-NTHMP |
NTHMP |
|
|
|
|
|
|
Completed |
Completed |
In Progress |
Planned |
Remaining |
Total |
|
ALASKA |
|
|
|
|
|
|
|
Maps |
1 |
1 |
20 |
[30] |
52 |
|
|
Communities |
5 |
13 |
40 |
89 |
147 |
|
|
Pop. At-Risk |
9,608 |
7,192 |
60,247 |
45,103 |
122,150 |
|
|
CALIFORNIA |
|
|
|
|
|
|
|
Maps |
2 |
5 |
1 |
1 |
[11] |
18 |
|
Communities |
7 |
42 |
8 |
8 |
97 |
155 |
|
Pop. At-Risk |
28,052 |
857,915 |
3,433 |
89,539 |
963,926 |
1,948,813 |
|
HAWAIIa |
|
|
|
|
|
|
|
Maps |
66 |
2 |
4 |
2 |
[13] |
21 |
|
Communities |
69 |
9 |
13 |
4 |
37 |
63 |
|
Pop. At-Risk |
348,524 |
66,916 |
133,199 |
6,287 |
176,878 |
383,280 |
|
OREGON |
|
|
|
|
|
|
|
Maps |
58b |
6 |
1 |
6 |
[15] |
28 |
|
Communities |
31 |
7 |
1 |
11 |
12 |
31 |
|
Pop. At-Risk |
95,094 |
41,743 |
2,220 |
23,371 |
27,760 |
95,094 |
|
WASHINGTON |
|
|
|
|
|
|
|
Maps |
5 |
1 |
5 |
[8] |
19 |
|
|
Communities |
25 |
3 |
46 |
30 |
104 |
|
|
Pop. At-Risk |
44,383 |
11,056 |
241,297 |
601,500 |
898,236 |
|
|
TOTALS |
|
|
|
|
|
|
|
Maps |
124 |
19 |
8 |
34 |
[77] |
138 |
|
Communities |
100 |
88 |
38 |
109 |
265 |
500 |
|
Pop. At-Risk |
443,618 |
1,020,565 |
191,100 |
420,741 |
1,815,167 |
3,447,573 |
|
a Not listed for Hawaii are two additional maps in progress for the Hilo and Kahului area funded by NASA’s Solid Earth and Natural Hazards Program. b Many of these Oregon maps cover populated regions that lack Census 2000 designated communities. SOURCE: Reprinted from González et al., 2001. |
||||||
continues to independently conduct its own inundation modeling efforts. In doing so, each NTHMP state member uses its own choice of tsunami source, bathymetry, topographic data, and numerical code for the hydrodynamic simulations (Table 2.3).
Under the recently adopted NTHMP strategic plan (National Tsunami Hazard Mitigation Program, 2009a), the MMS plans to address these issues through developing of national guidelines and an approval process for inundation mapping, as well as establishing priorities of areas to be mapped. However, at the time of this committee’s evaluation (2010), little
TABLE 2.2 NTHMP Inventory of State Inundation/Evacuation Products (last updated April 2009)
|
State/ Region |
Product |
Communities |
Comments |
|
AK |
Report and maps of tsunami inundation |
3 areas completed: Kodiak and vicinity, Homer and Seldovia, Seward |
Significant challenge in obtaining recent bathymetric and topographic data of sufficient quality to generate accurate high-resolution DEMs for inundation mapping |
|
CA |
Report and maps of tsunami inundation |
Inundations maps (131) for emergency response covering almost all risk, populated areas within California (+100 cities/towns; 15 coastal and 5 interior bay area counties) completed at 90 m grid resolution, enhanced by 3 to 10 m DEMs on shore |
Inundation maps for several remaining communities are planned. Evaluation of 10 m DEM modeling will determine if another generation of maps are needed. Additional work will include evacuation and possible creation of tsunami hazard maps for land-use planning. |
|
HI |
Report and maps of tsunami inundation |
Evacuation maps from 1-D modeling for state completed; Updating 28 communities with 2-D modeling; Oahu modeling/ inundation mapping complete and Hawaii in progress; Expected completion Dec 2009 |
Initial 725 of 1,500 km of coastlines completed with 1-D modeling; Credible worst-case scenarios used; 2-D numerical modeling of five major trans-Pacific tsunamis during the past century under way; Validation with historical run-up records; Identified 10 locations of the current evacuation maps that may need modification |
|
OR |
Report, maps, GIS projects |
Detailed hazard maps for 10 communities completed; Tsunami evacuation zone maps for 23 communities completed |
Distinguish between a tsunami caused by an undersea earthquake near the Oregon coast (local tsunami) and an undersea earthquake far away from the coast (distant tsunami) |
|
Puerto Rico |
Report and maps of tsunami inundation |
Puerto Rico inundations maps completed; U.S. Virgin Islands pending |
|
|
WA |
Report and maps of tsunami inundation |
|
|
|
U.S. East Coast |
Working on inventory of products and methods |
|
Recent appointment, no established tsunami mapping practice common to all region; No combined inventory available yet |
|
Gulf of Mexico |
Working on inventory of products and methods |
|
Recent appointment, no established tsunami mapping practice common to all region; No combined inventory available yet |
|
SOURCE: NTHMP Mapping and Modeling Subcommittee; courtesy of R. Witter and S. McLean, co-chairs. |
|||
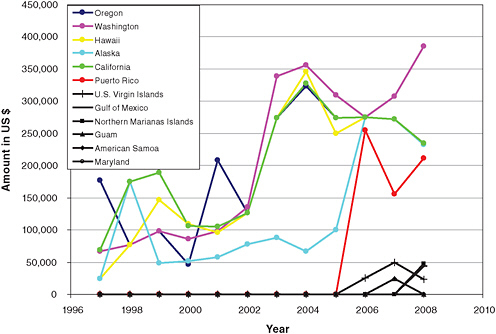
FIGURE 2.3 Federal funding for state efforts received from the NTHMP. SOURCE: Based on data from NOAA.
progress had been made. Potential tsunami sources to be examined collectively as regions, as opposed to current state-centric perspectives on segments of a source, could include (a) an Aleutian-Alaska tsunami along the Alaskan coasts, (b) a Cascadia tsunami along the Washington, Oregon, and northern California coasts, (c) an East-Caribbean tsunami for Puerto Rico, and (d) distant-source tsunamis around the Pacific Basin with special attention to Hawaii. With limited resources to devote to tsunami modeling, initial priorities could focus on sources near U.S. shores, because nearby sources pose the greater tsunami hazard, provide the least amount of time for at-risk individuals to react and evacuate, and details of slip distribution on a fault plane, or of the orientation of a landslide block, tend to have their greatest effects on tsunami heights nearby.
In addition to tsunami sources, several different numerical codes are being used by NTHMP members, including MOST, Cornell Multi-grid Coupled Tsunami Model (COMCOT), Non-hydrostatic Evolution of Ocean WAVE (NEOWAVE), University of Alaska, Fairbanks (UAF), Semi-implicit Eulerian-Langrangian Finite (SELFE), and TSUNAMI-N2. Some numerical codes are freely available in the public domain, such as COMCOT (http://ceeserver.cee.cornell.edu/pll-group/comcot.htm), for running through the Tsunami Computational Portal (https://tsunamiportal.arsc.edu/),
TABLE 2.3 Current Practice for Inundation Mapping
|
State/Region |
Organization Conducting Inundation Modeling |
Description |
|
Alaska |
Alaska Earthquake Information Center, University of Alaska |
Alaskan inundation models are based on the UAF tsunami code that involves nonlinear shallow water wave theory. Historical events (e.g., the 1964 Great Alaskan Tsunami) as well as a set of hypothetical tsunami scenarios unique for each local community are used for the tsunami sources. Alaskan inundation modeling is challenging because of large tidal fluctuations (more than 7 m in some localities) and the lack of accurate bathymetry data. |
|
Atlantic and Gulf Coasts |
University of Delaware and Texas A&M University |
It is unclear who is in charge of inundation modeling. Modelers at the University of Puerto Rico plan to create maps for some selected areas in the Gulf and East Coast. Modelers at the University of Delaware and Texas A&M University may also be responsible for the Gulf and East Coast, respectively. |
|
California |
University of Southern California and California Geological Survey (CGS) |
Inundation maps were released in 2009 and were based on the MOST numerical code. CGS has modified the inundation maps using GIS smoothing and other techniques. Each map uses 6 to 15 local and distant sources resulting in a single maximum (“worst-case”) tsunami inundation. The Cascadia subduction zone is the primary local tsunami threat for northern California, but the state lacks clear tsunami sources for the area south of Mendocino. Other potential but important tsunami sources would be distant tsunamis and those generated from submarine landslides. |
|
Hawaii |
University of Hawaii |
Hawaiian inundation maps have used the COMCOT numerical code (http://ceeserver.cee.cornell.edu/pll-group/comcot.htm), which is a model based on nonlinear shallow water wave theory. Current efforts are transitioning to the non-hydrostatic model called NEOWAVE (Yamazaki et al., 2009).The maximum flow depth, inundation, and maximum wave elevation are obtained from the simulations. Hawaii’s inundation model is based on five historical distant tsunamis (1946 Aleutian, 1952 Kamchatka, 1957 Alaska, 1960 Chile, and 1964 Alaska tsunamis). After checking other hypothetical distant tsunamis as well as local sources from the west flank of the island of Hawaii, it was confirmed that those five historical events are the worst cases for Hawaii. |
|
State/Region |
Organization Conducting Inundation Modeling |
Description |
|
Oregon |
Oregon Health and Science University |
Oregon inundation maps are based on the SELFE numerical code, which is a semi-implicit finite-element Eulerian-Lagrangian algorithm to solve the shallow water wave equations using an unstructured grid. Modelers use Cascadia source scenarios that are an extension from their previous study (Priest, 1997) but different from the different from the scenarios suggested by the USGS (Geist, 2005).The modeling utilizes information on the geological paleo-tsunami deposit data (both offshore and onshore deposits). Oregon produces two-tier inundation maps (for local and distant tsunami scenarios, e.g., see Figure 2.1), a GIS database with metadata, maximum wave elevation, maximum wave velocities, wave height time series, and 2- and 3-D animations. |
|
Puerto Rico |
University of Puerto Rico |
Inundation maps were produced in 2003 using the numerical code called TSUNAMI-N2. The code is based on a finite-difference, shallow water wave model that was developed at Tohoku University, Japan. There are plans to compare results from TSUNAMI-N2 and MOST using the latest Light Detection and Ranging (LIDAR) topography/ bathymetry data. Modelers here are inclined to use MOST instead of TSUNAMI-N2, although no reason for their choice has been given. |
|
Washington |
NOAA/PMEL |
Washington inundation maps are based on the MOST numerical code (from NOAA/PMEL), which involves nonlinear shallow water wave theory. The MOST code selects the grid sizes and the time increments so that wave dispersion behaviors can be compensated for by the numerical dispersion inherent in the finite difference scheme. For Pacific coast sites, the Cascadia source scenarios recommended by the state of Oregon (Priest, 1997) are used for open-ocean sites and for sites along the Strait of Juan de Fuca. For Puget Sound sites, the Seattle fault deformation model that simulates the 900–930 AD event is used as a credible worst-case scenario. |
|
SOURCE: Committee member. |
||
while others, such as MOST, which has received substantial support from NOAA, are available to NTHMP partners upon request. Lastly, states also vary in their approach to post-processing of the inundation modeling output.
Similar to tsunami source determinations, inundation model outputs and the numerical codes that produced them have not been universally peer-reviewed or subject to quality control standards. A recent NOAA report is the first attempt at a general framework for achieving quality control of numerical codes for inundation modeling (Synolakis et al., 2007). Only in the fall of 2008 did the NTHMP MMS adopt this technical memorandum expressing its criteria for
model benchmarking. The memorandum recommends that, at a minimum, inundation models should be examined by testing basic hydrodynamics and examining errors in mass conservation, and further describes 10 benchmark problems that should be used for model validation. The benchmarking comprises analytical, laboratory, and field data (e.g., comparisons to historical datasets of tsunami observations) with allowable error criteria of no more than 5 percent in mass conservation, 5 percent or 10 percent in analytical and laboratory, and 20-25 percent in the run-up accuracy for field data. NTHMP participants agreed to use the Office of Oceanic and Atmospheric Research (OAR) PMEL-135 for its benchmarking process, to share information, and to develop a process for model validation. Although this process is a good start toward achieving and maintaining quality control for different modeling practices performed by NTHMP member states, the OAR PMEL-135 has not been used consistently in the production of inundation maps among the states, and the outcomes have not been peer-reviewed. Therefore, progress is difficult to assess, and it is not clear whether current maps suffice to plan safe evacuations or prepare the public, given that they may have been produced with outdated technology. Use of benchmarked models is undoubtedly needed for improved hazard assessments and defensible evacuation and hazard maps.
Although the goal of the NTHMP MMS is to provide the guidance for accuracy and to coordinate and standardize the mapping efforts as called for by Congress, this mechanism for coordination has not resulted in more standardized maps. Coordination and standardization of modeling approaches may prove to be difficult within the current MMS structure, given the potential conflicts of interest of the state tsunami modelers that typically comprise the subcommittee.
Because of the MMS difficulty in developing consistent mapping approaches or standards, the committee discussed several options to reaching the goal of benchmarking models and meet agreed upon standards. Instead of developing a standardized approach through the MMS, the committee discussed the benefits of NOAA/PMEL providing the results of its hydrodynamic inundation modeling efforts to states. Because of the technical resources available at PMEL, such an approach might provide the necessary consistency in modeling methodology and input parameters across the states. This approach may also alleviate strains on state budgets and the lack of financial resources, which were cited by many NTHMP members as one of the key challenges to making progress in producing the next generation of inundation maps. This approach follows language in the 2006 Tsunami Warning and Education Act, which calls for the NOAA Tsunami Program to provide “tsunami inundation models and maps for use in increasing the preparedness of communities” (Section 4(b)(4)) and for NTHMP members to “use inundation models that meet a standard of accuracy defined by the Administration (NOAA) to improve the quality and extent of inundation mapping, including assessment of vulnerable inner coastal and nearshore areas” (Section 5(c)(1)).
During the NTHMP meeting of 2008, the option of PMEL providing the inundation modeling was indeed discussed, and PMEL offered the modeling output, but states did not express interest in using these results due to a lack in transparency regarding the choice of source parameters. Given the somewhat unstable history of federal support and funding, states may also be reluctant to rely on federally produced inundation efforts instead of in-house expertise
that has been developed over the past decades. The committee acknowledges the foregoing states’ concerns, in addition to their long-term investments in inundation model development and tsunami source research.
Alternatively, a model accreditation system might be designed to ensure greater adherence to guidelines, formal criteria and procedures, and minimum quality standards developed by the MMS (e.g., OAR PMEL-135). This model accreditation system could be administered by a body that uses peer-review or another objective and transparent process to judge whether modeling efforts meet these aforementioned guidelines, criteria, and minimum quality standards. Ideally, NTHMP would only make funding available to states that have been officially accredited. This body administering the accreditation system needs to be free of conflicts of interest.
Conclusion: The development and use of inundation models is not occurring in a coordinated or standardized fashion across the NTHMP. Each NTHMP member state independently selects the tsunami source, bathymetric and topographic data, and numerical code when modeling inundation to create tsunami hazard maps. This state-based approach to tsunami inundation modeling, coupled with inadequate coordination and consensus among NTHMP modelers and no external peer-review, has created significant disparities in the methods, criteria, and judgments employed in tsunami inundation modeling and resulting tsunami hazard maps. There is also inadequate understanding and discussion on the cost, benefits, and utility of employing new higher order models over existing models. Disparities in modeling approaches and source determination also hamper the nation’s ability to compare societal risk to tsunami hazards. Solving these issues may be difficult within the current MMS structure, given the potential conflicts of interest of the state tsunami modelers that comprise the subcommittee. An alternative approach might need to be identified, such as an accreditation system.
Recommendation: The NTHMP should seek ways to reduce needless disparities among states and territories in their approaches to inundation modeling. Inundation from tsunami threats that transcend political boundaries (e.g., Cascadia subduction zone) should be modeled consistently across state lines, instead of the current state-centric approaches. To eliminate these unnecessary and costly differences in inundation modeling approaches, the committee recommends that inundation modeling be conducted consistently across state lines and be executed through a cooperative partnership among NOAA, the USGS, and NTHMP members, and not by the individual NTHMP members as is the current practice.The committee proposes the following strategy:
-
First, NOAA could take a lead to organize a workshop to establish community hydrodynamic models used for tsunami inundation modeling: one set for co-seismic tsunami sources and another set for landslide tsunami sources. To ensure continuing community support and improvement, the models—including full documentation and source code—should be accessible in a virtual repository that will be maintained by NOAA. The repository should host a discussion forum.
-
Second, the USGS could take a lead to organize a series of workshops to determine the design tsunami sources. Tsunami sources should be determined for the regional base without state boundaries. (For example, the Cascadia scenario could be studied for (overlapped) subregions: north, central, and southern parts of the subduction zones.) The actual inundation modeling could be conducted by NTHMP members, and the outcomes of the inundation modeling must be transparent and accessible in the foregoing virtual repository.
-
Alternatively, NOAA could undertake inundation modeling using a community of models; again, the outcomes would be accessible in the virtual repository. Throughout the task of inundation modeling, the committee emphasizes that NTHMP members would continue to be responsible for producing hazard maps that reflect local conditions and needs.
Evacuation Maps
Evacuation maps depict areas that may need to be evacuated in the event of a tsunami and are designed to be understood and used by at-risk individuals and by local emergency managers in their evacuation-planning efforts. The committee found it difficult to review progress made in evacuation mapping since 2006 with regard to the number of maps completed as well as the quality and the level of coordination of these efforts because of: (1) the lack of a comprehensive and continuous inventory of available evacuation maps relative to the number of at-risk communities and (2) inconsistencies in product quality. As mentioned in the previous section, the most recent tabulation of completed efforts provided by the NTHMP (Table 2.2) provides no information on the number of communities with evacuation maps relative to the number of communities with evacuation maps in 2001 or the total number of at-risk communities. Therefore, the committee cannot accurately assess progress with regard to the numbers of coastal communities for which evacuation-mapping efforts have been completed.
Although the production of evacuation maps is essential for emergency preparedness and evacuation planning, the committee observed that efforts to produce such maps vary substantially nationwide. This observation is based on input provided by the NOAA Tsunami Program and NTHMP members during the course of the committee’s review, as well as information gathered via an online search for tsunami evacuation maps (see Appendix D for a list of evacuation maps). Oregon and Hawaii have tsunami inundation zones for their entire coastlines and evacuation maps for all coastal communities, and are currently updating their evacuation maps in select communities. Although most evacuation maps currently available only delineate a single tsunami scenario, the Oregon Department of Geology and Mineral Industries (DOGAMI) has recently created a new type of evacuation map that includes near- and far-field tsunami inundation scenarios (Figure 2.1). Washington lacks a statewide tsunami inundation zone but has evacuation maps for all communities on the open-ocean coast (e.g., Clallam, Jefferson, Pacific, and Grays Harbor counties) and for several Puget Sound communities (e.g., Whatcom County) that are threatened by tsunamis generated by the Cascadia subduction zone and
earthquake faults in Puget Sound (e.g., the Seattle Fault, Tacoma Fault). California has recently completed new tsunami inundation mapping and is currently producing tsunami evacuation maps for all populated areas of the coastline. In other states and territories (Alaska, Puerto Rico, Guam), tsunami evacuation maps are available only for certain communities, and few are available online. No tsunami evacuation maps currently exist for communities in the Gulf of Mexico or the eastern U.S. coastline. As outlined in its strategic plan (National Tsunami Hazard Mitigation Program, 2009a), the NTHMP plans to inventory all tsunami evacuation maps by 2010 and to thereafter increase the number of maps annually by 10 percent.
The majority of evacuation maps across the United States are available as digital PDFs or printed brochures (Table 2.4). Public access to digital copies of evacuation maps is not consistent or intuitive across the states. For example, local evacuation maps are available online at the state geology department in Oregon and at a university-based seismic network organization in Puerto Rico, while in most other states, they are provided by the state emergency management or civil defense agency (Table 2.4). Hawaii was the first state to create a dynamic online map-
TABLE 2.4 Availability and Format of Tsunami Evacuation Maps in Several U.S. States and Commonwealths
|
State/Commonwealth |
Online Location for Tsunami Evacuation Maps |
Format of Available Maps |
|
Alaska |
• Alaska Department of Natural Resources |
• Hazard maps for selected communities (pdf) |
|
California |
• California Emergency Management Agency |
• Brochures (available online as PDF) • Online mapping application—“My Hazards” |
|
Guam |
• Guam Office of Civil Defense |
• Text-based descriptions of evacuation plans |
|
Hawaii |
• Hawaii State Civil Defense |
• Stand-alone evacuation maps (PDF) • Online mapping application (Google-enabled) |
|
Oregon |
• Oregon Department of Geology and Mineral Industries • Oregon Coastal Atlas |
• Brochures (available online as PDF) |
|
Puerto Rico |
• Puerto Rico Seismic Network, based at the University of Puerto Rico-Mayaguez |
• Brochures (available online as PDF) |
|
Washington |
• Washington State Emergency Management Division • Washington Dept. of Natural Resources |
• Brochure (available online as PDF) |
|
SOURCE: Committee member. |
||
ping application (based on Google Maps) that allows individuals to find specific addresses and see tsunami evacuation zones relative to more identifiable landmarks (Appendix D). Because it is critical for individuals to understand the extent of tsunami evacuation zones in their communities, the committee commends the NTHMP for acknowledging a deficiency in map availability and citing the need for guidelines for the approval and distribution of maps in its 2009-2013 draft strategic plan. Efforts to centralize the availability of evacuation maps, or at the very least to develop a NTHMP portal that guides individuals to disparate state archives, will enable individuals to more easily find evacuation materials and prepare for future events.
In addition to inconsistencies in map access, tsunami evacuation maps are inconsistent with regard to formats, colors, and noted landmarks (e.g., bridges, assembly areas, hospitals, hotels to help tourists, instructions on whether to evacuate by foot or car). The formats of currently available tsunami evacuation maps vary and include community-based maps that emphasize landmarks (see Appendix D; Alaska), single tsunami evacuation zones (see Appendix D; Washington, California, Oregon, Puerto Rico), and multiple tsunami evacuation zones to differentiate between local and distant tsunamis (see Appendix D; Cannon Beach, Oregon; Figure 2.1). Recent updates to the Cannon Beach map that show two tsunami evacuation zones (one for a distant tsunami and another for a near-field event; see Figure 2.2) may be the most scientifically justified, but no studies have been conducted to determine whether at-risk individuals in this community understand these differences and would know whether to evacuate certain areas given live drills of the two scenarios. In general, there is no rigorous evaluation of how people respond to or interpret maps. Evacuation maps in Oregon, Washington, California, and Puerto Rico use yellow to denote tsunami evacuation zones, while in Hawaii the static maps found online denote the hazard zones as gray and the maps in phone books in red. Variations also exist among tsunami evacuation maps with regard to accompanying text on the map products that explains how to use the map and to prepare for future tsunamis (Table 2.5).
To date, state mapping efforts have largely relied on their own state advisory groups to guide evacuation map development. Because tsunami scenarios that form the basis for evacuation maps will vary among states (e.g., distant versus local events or worst-case versus most likely), map content will always need to be tailored to the special facilities and populations in tsunami-prone areas. However, the preparation and presentation of this information (e.g., symbols, colors) in a consistent way across the United States helps create a consistent voice in public education and is encouraged (see Chapter 3 for additional details). For example, a resident of the Oregon coast who works in a neighboring coastal town in Washington or is vacationing in Hawaii should be able to recognize and understand tsunami evacuation maps with little interpretation. State agencies have not evaluated the effectiveness of various map formats (either based on surveys and interviews or by testing their utility during evacuation drills) in promoting individuals to take protective action, and there are no NTHMP guidelines for evacuation map preparation.
Although consistency in evacuation map preparation does not currently exist, the committee commends the NTHMP for noting the need for guidelines on evacuation map preparation (including assistance to non-English speaking communities and criteria for defining evacuation routes and sites) in its 2009-2013 strategic plan (National Tsunami Hazard Mitigation Program,
TABLE 2.5 Availability of Explanatory Text with Tsunami Evacuation Maps in Various NTHMP States and Commonwealths
|
Text Included in Tsunami Evacuation Maps |
Hawaiia |
Oregon |
California |
Puerto Ricob |
Washington |
|
|
Static Mapb |
On-line Mapping Application |
|||||
|
Tsunami explanation |
|
X |
X |
X |
|
X |
|
Instructions to evacuate tsunami zone |
|
X |
X |
X |
|
X |
|
Distant vs. local tsunamis distinction |
|
X |
X |
X |
|
X |
|
Risk-reduction strategies (e.g., family plan, emergency kit) |
|
X |
X |
X |
|
X |
|
Natural cues described |
|
X |
X |
X |
|
X |
|
Evacuation signage described |
|
|
X |
X |
|
X |
|
Vehicle- vs. foot-based evacuation discussed |
|
X |
X |
X |
|
X |
|
Where to evacuate to (e.g., assembly areas) |
|
X |
X |
X |
|
X |
|
Directions for more information |
|
1 |
X |
X |
|
X |
|
Checklist for immediate action after warning |
|
X |
X |
X |
|
X |
|
Post-tsunami actions to take |
|
|
X |
X |
|
X |
|
Mention of special-needs populations |
X |
X |
||||
|
a Three of the four links for more information at county civil defense departments did not work. The fourth link (to Hawaii County Civil Defense) was active, but led to the static PDFs of evacuation maps for the island. b For the static evacuation maps in Hawaii and in Puerto Rico, no accompanying documentation was included in the map or could be found. SOURCE: Committee member. |
||||||
2009a). The need for best practices or standards for evacuation map preparation was also noted in the 2007 NTHMP five-year review. These guidelines or best practices need to be based on an evaluation of how people process the maps and what conventions are most effective.
Conclusion: Evacuation maps are critical tools for understanding and communicating population vulnerability to tsunamis. Most at-risk communities in the Pacific states (Hawaii, Alaska, Washington, Oregon, and California) and Puerto Rico have produced evacuation maps with a single line indicating a worst-case scenario, except for Cannon Beach, Oregon, where the map includes evacuations zones for far- and near-field tsunamis. Approaches to evacuation map production vary greatly among NTHMP members (e.g., format, choice of scenarios); therefore, at-risk populations are expected to interpret different state-developed representations of tsunami risk. It is unclear whether current evacuation maps are sufficient for enabling effective evacuations or preparing the public due to the absence of uniform quality standards, evaluative metrics, or guidelines on what constitutes effective mapping approaches.
Recommendation: The NTHMP Mapping and Modeling Subcommittee should develop guidelines on evacuation map production that foster consistency in format and quality across the nation and that are based on sound cartographic principles, although map content must be tailored to the relevant facilities, populations, and characteristics of the local communities. To improve public access to evacuation maps, the NTHMP should develop a national, online repository for tsunami evacuation maps and host a consistent online mapping application for all tsunami evacuation zones across the United States. The NTHMP should annually update the inventory of evacuation maps relative to the number of at-risk communities.
VULNERABILITY ASSESSMENTS
Societal vulnerability to tsunamis refers to the physical, social, economic, and environmental conditions or processes that increase the potential for individuals or communities to incur losses or damages from future tsunamis (International Strategy for Disaster Reduction, 2004). Common elements of vulnerability within the natural hazard literature include exposure, sensitivity, and resilience (Dow, 1992; Hewitt, 1997; Cutter, 2003; Turner et al., 2003). Exposure refers to hazard proximity, sensitivity refers to differential degrees of potential harm given similar exposure (e.g., different building types), and resilience addresses the coping and adaptive capacities of an individual or community during and after an extreme event. Understanding societal vulnerability to tsunamis provides emergency managers with the required information to protect their communities and to determine whether individuals have the capacity to take protective actions.
Although this information is considered critical to reducing tsunami risk, until recently relatively little has been written about societal vulnerability to tsunamis compared to the amount
of literature devoted to the physical characteristics of tsunamis (Keating, 2006; National Research Council, 2007). One possible reason is that vulnerability is not an integral part of the NTHMP and is not addressed by its subcommittees (Warning Coordination, Mapping and Modeling, Mitigation and Education). The NTHMP Mitigation and Education Subcommittee notes the importance of understanding vulnerability to tsunamis in the development of mitigation and education strategies but has not dedicated resources to doing such assessments or providing guidelines on how to do so. Efforts to describe societal vulnerability to tsunamis have come from other federal agencies (e.g., the USGS) and academic institutions. As the tsunami research community increases its efforts into assessments of population exposure and other elements of vulnerability assessment, it would benefit from leveraging ongoing efforts for other hazards in the various agencies.
Individual and community vulnerability to tsunami hazards are dynamic processes that require monitoring due to changing coastal populations, risk perceptions, and use of tsunamiprone areas. Methods of characterizing vulnerability vary depending on the intended use of the results (e.g., evacuation planning, land-use planning, infrastructure siting, and mitigation projects). Due to the committee’s focus on national preparedness to tsunamis, we limit our discussion of vulnerability in this chapter to issues that relate to an individual’s ability to evacuate tsunami-prone areas, including (1) population exposure and sensitivity to tsunamis and (2) evacuation potential for at-risk individuals in tsunami-prone areas. The purpose of this section is to briefly describe each element, progress in the nation’s understanding of vulnerability, and areas for improvement.
Population Exposure and Sensitivity
Tsunamis pose risks only if they have the potential to impact humans or things they value. Therefore, a first step in understanding vulnerability is to inventory the number and types of individuals in tsunami hazard zones. Population exposure can be estimated for small geographic areas (e.g., a single coastal community) via building inventories in tsunami-prone areas (Morgan, 1984; Papathoma et al., 2003; Wood and Good, 2004; Dall’Osso et al., 2006) or community workshops that leverage local knowledge (Wood et al., 2002). For large geographic areas (e.g., counties, states), decadal population data gathered by national census agencies (e.g., U.S. Census Bureau) or business databases gathered by private companies can be integrated with tsunami hazard data using GIS tools to determine the number of individuals in tsunami-prone areas. Other regional approaches to estimating population exposure to tsunamis include global population models (Balk et al., 2005), and landcover data (Wood, 2009).
In addition to determining the number of individuals in tsunami-prone areas, it is important for emergency managers to assess their demographic characteristics, as these can amplify an individual’s potential for losses and affect their ability to receive and understand warning messages (Mileti and Sorenson, 1990; Miller et al., 1999; Morrow, 1999; Cutter, 2003). People in tsunami-prone areas will vary in their hazard awareness, risk perception and tolerance, and ability to prepare or respond to an extreme event. If officials are to effectively motivate people
to take protective measures in response to a tsunami warning, then they need to understand who they are trying to motivate and their capacity to respond. Assessing the types of people in tsunami-prone areas helps officials determine placement of warning signage and technology (e.g., sirens), tailor the format and delivery of education efforts to reach different populations (see Chapter 3 for additional discussion on education), and identify those who may need special assistance during an evacuation (e.g., elderly populations).
Characterizing the demographic attributes of individuals in tsunami-prone areas does not imply that all individuals of a certain demographic group will exhibit identical behavior during or after a tsunami since multiple demographic characteristics of an individual or neighborhood interact and likely amplify each other. Variations in local cultures and situations, as well as in individual and community resilience, will influence the extent of these demographic sensitivities. Individuals have multiple demographic characteristics (e.g., age, gender, economic status) and the interaction of factors may heighten or reduce their sensitivity to tsunamis (Wood et al., 2010). The importance of demographic sensitivities will also be influenced by characteristics of the hazard; for example, a high fraction of elderly people in a tsunami-prone area will be a larger issue if the likely warning time before inundation is 30 minutes (e.g., near-field tsunami) compared to several hours (e.g., far-field tsunami). With these caveats in mind, the following demographic groups may have higher sensitivity to tsunami hazards:
-
the very young and the very old (Balaban, 2006; McGuire et al., 2007);
-
households of racial and ethnic minorities becuase of historical societal inequalities (Laska and Morrow, 2006) and to potential exclusion from disaster preparedness efforts (Morrow, 1999);
-
renters, who are less likely than homeowners to prepare for catastrophic events and have more limited exposure to hazard information (Morrow, 1999; Burby et al., 2003);
-
individuals with pre-existing socioeconomic issues (e.g., homeless, living in poverty, low literacy levels, inability to speak the primary language of an area) that may inhibit their ability to prepare for future events (Wisner et al., 2004);
-
individuals at hospitals, psychiatric facilities, adult residential care centers, daycare centers, schools, and correctional facilities that may have difficulty (e.g., hospital patient) or be incapable (e.g., correctional-facility inmate) of evacuating on their own and will require external assistance to evacuate; and
-
employees or tourists who may have low or no exposure to awareness efforts or evacuation drills (Wood and Good, 2004; Johnston et al., 2007).
The committee found that by 2010, reports attempting to inventory the number and types of people in tsunami hazard zones in coastal communities have been completed for the tsunami-prone areas of Hawaii (Wood et al., 2007), Oregon (Wood, 2007), and the open-ocean coast of Washington (Wood and Soulard, 2008). In each of these reports, census block data from the 2000 U.S. Census and national business data were merged with tsunami hazard data to identify, by community, the number and types of residents, employees, and facilities that attract tourists and house special-needs populations in tsunami-prone areas. As a first ap-
proximation of economic exposure, these reports also include inventories of the amount and percentage of tax-parcel values, employee distributions, and business sales volume in tsunami hazard zones of each community and county. In reviewing the tsunami and risk/vulnerability assessment sections of several FEMA-approved state mitigation plans, the committee found little information related to the diversity of populations in tsunami-prone areas of the various coastal states. Some state plans estimate the number of individuals in tsunami hazard zones of each county, some simply list the communities with populations with tsunami risk, and some only discuss general tsunami-related population issues. Many plans, however, did include detailed information on financial, structural, and critical facility exposure, suggesting that plans are written to help document potential long-term economic impacts and not preparedness issues to save lives.
Conclusion: There is no national assessment of population exposure and sensitivity to tsunamis, including the number and types of individuals in tsunami hazard zones. The NTHMP’s current subcommittee structure (Mapping and Modeling, Warning Coordination, and Mitigation and Education) does not coordinate mapping the exposure of at-risk individuals and communities and therefore does not provide leadership on this topic. The absence of this information and the leadership to attain it impacts national preparedness to tsunamis in several ways. First, the NTHMP will be unable to reach its stated goal of a national tsunami risk assessment (see earlier conclusion in this chapter on this topic). Second, efforts to develop realistic evacuation plans are compromised in communities threatened by far-field tsunamis if the magnitude of the at-risk population is not known. Third, communities threatened by near-field tsunamis cannot develop public awareness and education efforts that are tailored to local conditions and needs (discussed in the following chapter) without an understanding of the types of at-risk individuals.
Recommendation: The NTHMP should collaborate with state and federal agencies (e.g., the USGS, the Census Bureau) to periodically inventory the number and types of people in tsunami hazard zones at intervals no less frequently than that of the U.S. Census, with special attention to children, the infirm, tourists, and other groups whose heightened sensitivity to tsunamis could constrain their ability to prepare for and evacuate from future tsunamis. The NTHMP should expand Mapping and Modeling Subcommittee efforts to explicitly include community vulnerability. The NTHMP should establish a Science Advisory Committee to help develop guidelines on consistent approaches for identifying and mapping populations in tsunami-prone areas. The NTHMP should also provide guidelines on how to use this information to tailor evacuation planning and education efforts.
Evacuation Potential
In addition to population exposure and sensitivity, an individual’s capacity to learn from past disasters, implement risk reduction measures, adapt during an event, and persevere after an
event is another significant factor in understanding societal vulnerability to tsunamis (National Science and Technology Council, 2005). These resilience factors influence the ability of an individual to prepare for future tsunamis and to take self-protective measures when a tsunami occurs. This sub-section on evacuation potential focuses on assessing the ability of individuals to evacuate tsunami-prone areas based on physical characteristics of the tsunami hazard zone (e.g., distance to higher ground, integrity of egress routes, island with no high ground), while the role of perceptions, knowledge, and preparedness levels in increasing resilience is discussed in the following chapter on education, preparedness, and evacuation coordination.
Evacuation modeling estimates the amount of time necessary for people to reach safe havens from various locations in tsunami hazard zones (Post et al., 2008), which is especially critical for U.S. coastal communities that are threatened by tsunamis reaching shores in an hour or less. Such modeling efforts have been used to study the influence of congestion due to crowds and road bottlenecks on the ability of individuals to evacuate tsunami hazard zones (e.g., Lammel et al., 2008); the effectiveness of official routes in managing the typical number of people who will need to evacuate (Ismail et al., 2008); the likelihood of casualties (Koshimura et al., 2006); or the need for vertical evacuation structures (e.g., buildings, engineered berms) in places where time is not available to reach naturally occurring higher ground (Yeh et al., 2005; Federal Emergency Management Agency, 2008). Such analysis can answer fundamental questions that might ultimately determine the survival of people: Under what circumstances is it most effective to evacuate on foot instead of car due to congestion or earthquake-damaged infrastructure? Under what circumstances is it best to use vertical evacuation (e.g., tall buildings, engineered berms) because ground-based evacuations may not be practical in communities that must evacuate thousands of people from a large tsunami-prone area?
Although there is basic research focused on tsunami evacuation modeling, the committee found little applied evacuation modeling research (e.g., Yeh et al., 2009) to examine specific U.S. coastal communities that may only have minutes to an hour to evacuate thousands of individuals from tsunami-prone areas (e.g., Seaside, Oregon; Ocean Shores, Washington). In areas where ground-based evacuations may not be feasible (due to short times before inundation and substantial distances to higher ground) and where there are no existing structures or features capable of serving as a vertical refuge, workshops are being held in coastal communities (e.g., Cannon Beach, Oregon, in September, 2009; Long Beach, Washington, in January 2010) to further discuss the opportunities and constraints of vertical evacuation structures for tsunamis (e.g., buildings, engineered berms). Although engineering guidelines have been published and officials in some coastal communities are expressing interest in new structures (Federal Emergency Management Agency, 2008), the committee found no case studies that delve into the social and economic aspects of vertical evacuation structures in at-risk communities. In addition, because there is very limited information about current velocities as the tsunami interacts with the built environment (and currently no measurements are being taken), it is difficult to estimate the forces involved with a tsunami flow field and to assess what structures might remain intact during a tsunami. Before communities commit significant time and funds to these structures, communities need a careful determination of the feasibility and issues related to near-field tsunami evacuations.
To date, no structures have been built in the United States specifically to serve as vertical evacuation sites for tsunamis. In communities with high-rise buildings in low-lying areas (e.g., Honolulu, Los Angeles), vertical evacuation into existing buildings to avoid inundation from far-field tsunamis is promoted by local emergency managers. In communities threatened by near-field tsunamis, officials should examine the structural integrity of buildings that may be used for vertical evacuation. Earthquakes that precede the tsunami may make certain building types (e.g., unreinforced masonry) unsafe for entry or for tsunami refuge and the subsequent tsunami waves may overtop or destroy wood-based buildings that survive the initial earthquake.
Strong ground motions, ground failure, and land subsidence from earthquakes that precede near-field tsunamis may also damage key egress routes, bridges, and critical facilities in coastal communities, thereby putting additional constraints on an individual’s ability to evacuate a tsunami-prone area. Communities in Alaska, the Pacific Northwest, and Puerto Rico are likely to experience several minutes of strong ground motions with tsunami inundation arriving only minutes later. An initial large earthquake would likely result in damage to critical infrastructure in the evacuation zone (e.g., roads, bridges) and create barriers for individuals trying to evacuate from an imminent tsunami (e.g., toppled power lines, building debris in roads, etc.). Initial observations of the Chilean earthquake in February 2010 indicate this was the case in many coastal communities. In addition, critical facilities, such as emergency management offices, police stations, and fire stations, could be destroyed by the original earthquake or blocked by earthquake-related debris, possibly leaving emergency responders unable to manage local evacuations. Radio and television stations and the towers that transmit their signals could also be damaged, thereby limiting the dissemination of warning or all-clear messages. The number of critical facilities in tsunami-prone areas has been documented in several studies (e.g., Charland and Priest, 1995; Lewis, 2007; Wood, 2007) and hazard mitigation plans (e.g., State of Hawaii Multi-Hazard Mitigation Plan). However, these efforts are simple inventories that do not delve into evacuation and response consequences of earthquake-damaged infrastructure and facilities or whether there are redundant facilities and access routes.
Conclusion: Although many communities in the United States are threatened by a tsunami that originates from a source at close or intermediate distance, few evacuation studies have been conducted to evaluate the ability of at-risk individuals to reach higher ground before tsunami waves arrive. A related problem is that there have been no studies to assess the potential impact of local earthquakes that generate near-field tsunamis on egress routes, supporting infrastructure (e.g., bridges), or facilities considered critical in response efforts. Without such information, emergency managers are not able to identify where targeted outreach is needed and where potential vertical evacuation structures (e.g., buildings, engineered berms) may be warranted.
Recommendation: For all communities with close or intermediate proximity (i.e., arrival times ranging from minutes to about an hour) to a potential tsunami source, the NTHMP should conduct evacuation modeling studies to assess the likelihood of successful horizontal evacuations. These studies should include the potential impacts of preceding
earthquakes on key egress routes and consideration of any special-needs populations in tsunami-prone areas. In communities where the time required for at-risk individuals to reach higher ground is likely greater than predicted tsunami wave arrival times, the NTHMP should conduct feasibility and effectiveness studies of various vertical evacuation strategies (e.g., buildings, engineered berms) that include engineering considerations and social and economic constraints of at-risk communities.


