
1
Introduction
THE NATURE OF THE PROBLEM
Wherever tank vessels travel, laden with crude oil or petroleum products, the threat of pollution exists. The magnitude of the risk in U.S. waters is related to many factors, which this chapter will attempt to define.
Factors that warrant examination include tank vessel traffic patterns around the United States, the types of vessels involved, and local hazards. Also worth considering are historical patterns of accidents and oil spills, which reflect all of the factors listed above.
From the following discussion, a set of facts will emerge that should guide any attempt to reduce the pollution risk. These facts assisted the committee in determining which tank vessel design alternatives would be most effective.
Clearly, in the current popular view, too much oil is lost, particularly in the occasional very large spills. In other words, the risk of pollution is unacceptably high. The present study represents an attempt to identify, and recommend ways to reduce, that risk.
Tanker Traffic in U.S. Waters Is Heavy and Is Increasing
Along every U.S. coast, the low silhouette of a laden tank vessel—a tanker or barge—is a common sight. These vessels carry the leading commodity in international trade, crude oil, and its many refined products such as gasoline.
Since the end of World War II, tank vessels have become more numerous and more imposing. More than 3,0001 are in service each day, some making voyages of more than a month, others putting to sea for only days at a time. They can be mammoth, up to roughly 400 meters in length. These giants are the largest moving objects made by man; a single cargo tank can hold more than twice as much oil as an entire World War II-era tanker.
Tank vessel traffic around the United States is heavy and likely to increase. Of the 1.7 billion tons2 of crude oil and products transported by sea annually worldwide (including intercoastal trade), more than a third (0.6 billion tons) passes through U.S. waters.3 On average, nearly five tankers (10,000 DWT and larger) a day call on Houston, and four a day on New York, the nation's first and second busiest ports for tanker traffic (10,000 DWT and greater).4 In 1988,5 more than 97 million tons of crude oil were shipped from Valdez, Alaska, the only major U.S. crude loading port (these "exports" go to other U.S. ports and to the Caribbean). The same year, more than 101 million tons of crude and product passed through New York, the port handling the greatest volume. Figure 1-1 reflects U.S. seaborne movements of crude and product for the leading 15 ports in the United States.
This activity is expected to intensify throughout the 1990s, due to the nation's growing thirst for oil coupled with its declining domestic production. In a 1988 report, the Department of Energy projected that daily crude oil
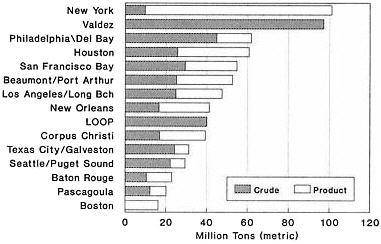
FIGURE 1-1 Petroleum volume by major port complexes: crude and product import/export—1988. Source: U.S. Army Corps of Engineers.
consumption would rise from roughly 17 million barrels per day (mbd) (2.3 million tons) to 19 mbd (2.5 million tons) by the end of the century, while domestic production is expected to fall from 10.5 mbd (1.4 million tons) per day to less than 8.6 mbd (1.2 million tons). (Energy Information Administration, 1989) In fact, this predicted increase in consumption may be conservative, preliminary 1990 data indicate. Although the precise effect on imports will be influenced by the price of oil, the EIA projects an increase in import volume of up to 50 percent by the end of the century.6 Figure 1-2 reflects the range of projected imports for 1990, 2000, and 2010 and their relation to the oil price. These estimates preceded the current war in the Persian Gulf; while significant changes in supply, demand, and oil cost may be brought about by this conflict, any attempt to adjust projections at this stage would be highly speculative.
In 1988, more than 7 mbd (equivalent to 360 million tons per year) of crude oil and refined products were loaded or discharged through U.S. ports by tanker, in an estimated 14,000 port calls.7 The average tanker size was 80,000 DWT. The projected increase in seaborne imports would lead to a 50 percent increase in tanker port calls to 21,000 by the year 2000, assuming no change in average tanker size.
Regardless of the extent of the increase, these data portend the nation's growing reliance on foreign oil and petroleum products—and on seaborne transport, which brings in most of the foreign supply. This year (1990), half of the nation's oil demand will be met by foreign suppliers. The continental United States will continue to receive oil shipments from Alaska by sea, but existing production levels in that northernmost state are expected to decline sharply during the decade. This supply would be replaced in the late 1990s either by development of present arctic oil reserves, or,
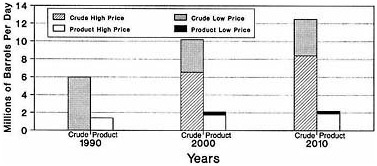
FIGURE 1-2 U.S. petroleum import projections: high and low oil price scenarios. Source: U.S. Department of Energy.
more likely, by foreign imports. In sum, the amount of crude and product imported to North America by tankship is expected to increase steadily in the current decade.
Traffic Is Heaviest from Alaska to the West Coast and Along the Gulf of Mexico and for Imports to the East Coast
Most of the tank vessel activity in U.S. coastal waters involves the importation of foreign crude oils and products. Thirty percent of the oil comes from the Middle East, 25 percent from the Caribbean, and 20 percent from West Africa. Smaller but still substantial amounts come from Northern Europe and Southeast Asia.
During 1989, seaborne movements of crude oil and product in U.S. waters consisted of the following major traffic patterns.8:
-
Traffic along the West Coast was mostly crude shipments from Alaska to the West Coast ports and Panama (97 million tons). This traffic, involving an average of more than 850 tanker loadings or trips per year, accounts for nearly one-sixth of the tanker traffic in U.S. waters, including intracoastal movement. Foreign imports and intracoastal domestic movements bring the total West Coast traffic to 131 million tons. By the end of the decade, much of this oil supply is likely to be replaced by foreign tanker-borne imports from Indonesia and the Caribbean region, as well as pipeline imports from Mexico and other parts of the United States. (Projections of imports from the Middle East are highly speculative at present.)
-
Traffic along the U.S. Gulf of Mexico consists of crude oil imports to Gulf ports and product shipments along the Gulf and to the East Coast (approximately 310 million tons). Crude imports come primarily from the Persian Gulf and the Caribbean; the remainder comes from Africa and the North Sea, as well as from Alaska via Panamanian pipelines and transshipment by tanker.
-
Traffic along the East Coast is primarily foreign imports of crude and refined products from the Persian Gulf, Africa, and the Caribbean. In addition, domestic movements from the Gulf to the East Coast brought total movements to an estimated 151 million tons. Tanker traffic (barges are not included) passing through the Florida Straits is reflected by the number of laden transits and the size of tankers shown in Figure 1-3. This is one of the most concentrated maritime shipping lanes along U.S. coasts.
Intercoastal and Intracoastal Activity Is a Large Part of U.S. Trade
Intercoastal and intracoastal trade by tankers or ocean-going barges 9 is a significant portion of the petroleum tank vessel activity in U.S. waters,
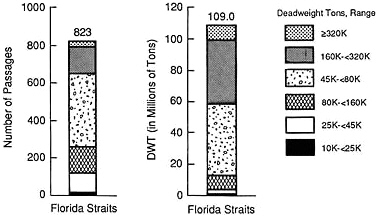
FIGURE 1-3 Number and tonnage of laden transits in the Florida Straits. Source: Lloyd's Maritime Information Services, Ltd.
comprising over a fifth of the total seaborne crude and product trade (125 million tons in 1988). Most coastal activity, for tank vessels over 10,000 DWT, consists of lightering10 of crude oil from large tankers to refineries along the Gulf Coast (22 percent). Product distribution by tanker along the Gulf Coast and from there to the East Coast is also significant (38 percent of the total). Large ocean-going barges carry most of the product transported along the East Coast (17 percent of the total national coastal tonnage). Barges play a secondary role to tankers in Gulf product distribution; barges are not a major element on the West Coast.
Coastal trade in crude oil remained steady from 1983 to 1988. Over the same time period, coastal product shipments declined by about 17 percent to about 85 million tons; the difference was replaced by increased product imports.
A significant result of the expected need for seaborne imports,11 added to possible increases in coastwise tanker traffic and cargo transfer from large to smaller tankers (lightering), will be a major increase in the number of tank vessels in U.S. intercoastal and intracoastal service. Because of port limitations, vessel size often is limited to about 80,000 DWT. The average size of vessels calling on U.S. ports may increase, however, as product increasingly is delivered directly from overseas in ships that are larger than those typically employed in domestic trade. In addition, offshore ports may be expanded, or new ports built to accommodate larger tankers, by the end of this decade or later.
The Type and Control of Tank Vessels in U.S. Trade Varies
In 1989, 1,500 different tankers visited (often more than once) the 15 busiest U.S. port complexes surveyed by the committee (see Figure 1-4). The vast majority—over 80 percent—were foreign flag.12 The exceptional case is the Alaska trade, in which U.S.-flag ships command 96 percent of the activity due to legal requirements.
Overall, about 50 percent of the tanker calls in U.S. ports are made by ships under direct U.S. control, as indicated by the activity in 15 major U.S. ports shown in Figure 1-4. However, much of the Valdez, Seattle, and Los Angeles/Long Beach activity accounted for exports and imports of Alaskan oil; foreign-flag tankers dominate the remainder of U.S. import activity. Of the active worldwide fleet, in tonnage (approximately 250 million DWT for tankers over 10,000 DWT), 92 percent is owned and operated by foreign-flag companies and countries. Owners are primarily independent shipping companies (67 percent of total worldwide tonnage), and the remainder are oil companies (17 percent) and governments (16 percent), as shown in Figure 1-5. Of 3,048 tankers in the world fleet, 203 or 7 percent are U.S. owned (Maritime Administration, 1990), and 257 tankers or 8 percent are U.S. flag.13
The condition of these tankers, both foreign- and U.S.-flag, varies widely. Construction standards typically are implemented by legislation in each flag
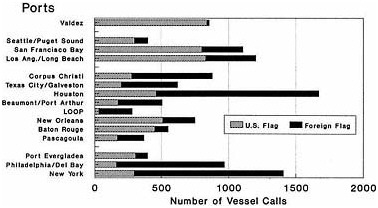
FIGURE 1-4 U.S.- and foreign-flag tanker calls* to major U.S. ports—1989. Source: Lloyd's Information Service, Ltd., and committee estimates from U.S. Army Corps of Engineers data. Note: Texas City/Galveston, New Orleans and Seattle/ Puget Sound port calls are committee estimates derived from U.S. Army Corps of Engineers 1988 data. * Calls are for tankers, 10,000 DWT and greater.
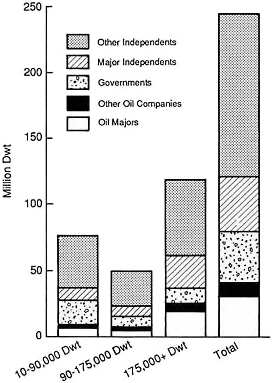
FIGURE 1-5 World tanker fleet ownership—1990. Source: Drewry Shipping Consultants, Ltd.
state and by the various ship classification societies; thus, standards differ. Moreover, even though ships must pass periodic surveys and inspections to remain "in class," shipowners adopt different approaches to vessel manning, maintenance, and equipment.
Construction practices also vary worldwide. Ships built for the U.S. ocean-going domestic trade (ships operating between U.S. ports) are required by law to be constructed in U.S. shipyards (so-called "Jones Act" ships). No such constraint applies to ships engaged in international trade with U.S. ports; therefore, ships are built at the yards offering lowest costs and are built to acceptable international design and construction standards. At present, no tankers over 10,000 DWT are being built in the United States.14
In recognition of varying flag-state regulations, the United States is among the nations that have adopted a practice of "port state control" to guard against the hazards posed by unsafe vessels. Thus, the Coast Guard may inspect foreign-flag vessels entering U.S. ports to ensure compliance with international standards for safety of life and structural condition. In addition, U.S. law requires that a foreign vessel's casualty and pollution history be evaluated prior to its entry into U.S. waters (U.S. Coast Guard, 1990b). Coast Guard practices regarding both domestic and foreign vessels are discussed in Chapter 2.
In all, the material condition of a tanker is influenced by a host of factors, including age, size, country of registry, classification society, and owner maintenance policies (U.S. Coast Guard, 1990b).
With the preceding uncertainties noted, some specifics can be ascertained regarding tank vessels serving the United States.
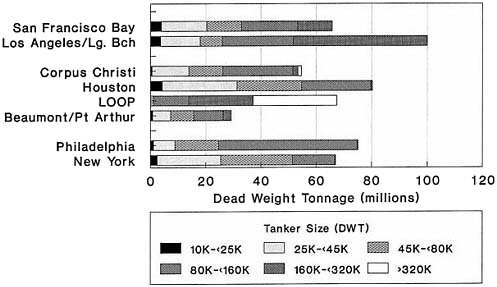
The size of vessel chosen for a particular trade route depends on the length of the voyage, the type of cargo, the storage capacity at the receiving end, and physical port restrictions (primarily water depth) at the ports visited. Because of port depth limitations, most voyages in U.S. waters are made by tankships in the midsize (50,000-100,000 DWT) category. In 1989, 301 such vessels—nearly half of the world total of 618 in this size range—made 1,369 trips, and possibly two to three times as many port calls, in U.S. waters.15 The largest tankers (above 320,000 DWT) can call on only one U.S. port, the deepwater Louisiana Offshore Oil Port (LOOP), although larger tankers lighter off the U.S. Gulf Coast. A breakdown of the tanker sizes calling on eight leading U.S. ports is shown in Figure 1-6.
The vast majority of tankers calling on the United States—and most of those in the Valdez/West Coast crude oil trade16 —have a single hull,17 Indeed, 79 percent of tankers (10,000 tons and greater) worldwide have a single skin (Tanker Advisory Center, 1990). In the U.S. fleet, nearly one of every six tankers carrying crude oil or product (40 tankers) has a double bottom or full double hull. (These hull designs are described in Chapter 5.) U.S.-flag operational experience with double-hull and double-bottom tankers is extensive: more than 500 ship-years with 27 groundings reported (Tanker Advisory Center, 1990), none of which resulted in major damage or pollution. A similar finding was reported by the Coast Guard in an assessment of the pollution-control performance of tankships with double bottoms. In 54 groundings in U.S. waters between 1977 and 1987, no pollution resulted; foreign-flag tankers caused no pollution in 12 groundings (U.S. Coast Guard, 1990e). As a point of reference, overall casualty reports (for both U.S.and foreign-flag tankers of single- or double-hull designs, involved in either groundings or collisions) indicated a pollution involvement (not defined) for about 9 percent of the casualties (U.S. Coast Guard, 1990e).
The average U.S. double-bottom or double-hull tanker is approximately 70,000 DWT. About 12 percent of the combined crude and product tonnage, both U.S. and foreign, passing through the 15 largest U.S. ports is carried in these hull designs. Most double-hull vessels carry petroleum products, which are less corrosive than crude oil.
In general, smaller double-bottom tankers carry petroleum products or chemicals, and larger double-bottom tankers are crude oil or "combination carriers" for both dry and liquid cargo.
Ocean-Going Barges
Compared to the diverse tanker fleet, the ocean-going barge fleet serving the United States is relatively homogenous. Barges operating in U.S. waters are all engaged in the domestic trade, and are all U.S.-built and flagged. The number of seagoing barges over 5,000 GT (approximate 10,000 DWT) is small, only 72, all committed to handling petroleum products. Of these, nine have double bottoms and six have double hulls (American Waterways Operators, letter report to the committee, April 6, 1990).
Barges generally are smaller than tankers, rarely exceeding 30,000 DWT (see Figure 1-7). The cargo tanks are smaller as well, and they are more likely to contain product than crude oil. In addition, barges normally are unmanned and do not move under their own power; they are towed or pushed by tugboats. The Coast Guard routinely inspects all tank barges that carry combustible or flammable liquid cargo in bulk. Ordinarily, these vessels are inspected internally and drydocked at least every three years; they undergo operational inspections annually.
Tank Vessel Pollution Accidents Are Diverse
There is no "typical" tank vessel accident scenario that leads to pollution. Nonetheless, a general understanding of the causes, nature, and consequences of accidents should aid in selection of the measures most useful in preventing or reducing pollution.18
Accident-related spillage of crude oil and petroleum products from ocean-going tank vessels is not the major source of petroleum inputs to the sea, as shown in a 1985 report by the National Research Council. According to this analysis, tanker accidents accounted for approximately 13 percent (0.4 million tons) of the 3.3 million tons of petroleum hydrocarbons entering the marine environment each year from all sources. 19 (See Table 1-1.) Larger inputs came from tanker operations (non-accident) and municipal and industrial wastes and runoff, based on data estimated a decade ago. A more recent estimate of spillage from maritime transportation (both accidental and operational) indicates that accidents contribute 114,000 tons or 20 per-
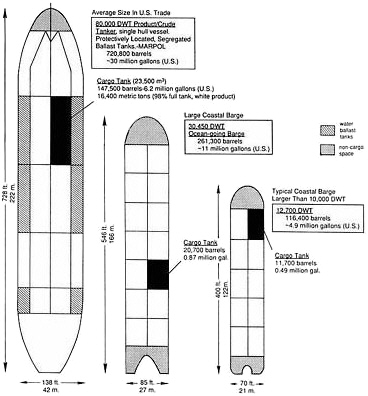
FIGURE 1-7 Comparison of tanker and ocean-going barge size. Sources: Tankers: Mobil Shipping and Transportation Company. Barges: MARITRANS and the American Waterways Operators.
cent of the 569,000 tons of oil entering the world's seas annually from maritime transportation (U.S. Coast Guard, 1990d). (See Table 1-2.) These total losses, while large, reflect a major reduction from the nearly 1.5 million tons (estimated) spilled annually worldwide from both tanker operations and accidents during the late 1970s and early 1980s (National Research Council, 1985). The decrease can be attributed to international cooperation in development and execution of rules for tanker design, clean ballasting, and vessel operations, and the supportive action of most major maritime states.
TABLE 1-1 Input of Petroleum Hydrocarbons into the Marine Environment—1985 Estimates
|
Source |
"Best Estimated" Million Tons Annually (mta) |
|
|
Natural Sources |
|
0.25 |
|
Offshore Production |
|
0.05 |
|
Maritime Transportation |
|
|
|
Tanker Operation |
0.70 |
|
|
Tanker Accidents |
0.40** |
|
|
Other |
0.40** |
1.50** |
|
Atmospheric Pollution Carried to the Sea |
|
0.30 |
|
Municipal and Industrial Wastes and Runoff |
|
1.18 |
|
Total |
|
3.3** |
|
SOURCE: National Research Council, 1985. |
||
|
** Data rounded to the nearest 0.1 mta. |
||
The number and volume of major accidental and operational spills from tankers also have decreased significantly during the last decade (see Figure 1-8). Tanker accident rates—collisions, groundings, fires and explosions, structural failures, and other incidents causing loss of life and/or pollution—were particularly high from 1976 to 1979 before returning to a lower level throughout the 1980s, although the volume of oil spilled continued to vary from year to year.
The rate of serious casualties to oil and chemical tankers (6,000 GRT
TABLE 1-2 Estimated World Maritime Operational and Accidental Sources of Oil Entering the Marine Environment (million tons annually)
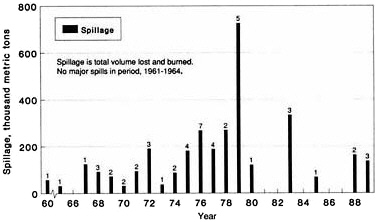
FIGURE 1-8 Tanker spillage and number of events: 50 major oil spills, 1960–1989. Source: The International Tanker Owners Pollution Federation Ltd.
and above, roughly equivalent to 10,000 DWT and above) reported by the International Maritime Organization was 1.92 incidents per 100 operating tankers in 1988. An analysis by the committee, comparing the estimated metric ton-miles of seaborne trade for crude oil and products to the number of serious casualties for the same tanker population, shows less change during the 1980s in serious casualties worldwide20 (see Figure 1-9).
Most Tanker Casualties Do Not Cause Pollution
The vast majority of casualties do not result in pollution. Only 6 percent (518) of the accidents reported in an assessment of 9,276 accidents resulted in oil outflow (Lloyd's Register of Shipping, 1990). (In 18 percent of the cases—1701—information was insufficient to determine whether pollution had occurred.) At the request of the committee, Lloyd's analyzed its database of casualties resulting in outflow greater than 30 tons from tankers 10,000 DWT and larger. The results, covering 370 pollution-related accidents, are broken down by cause in Figure 1-10. These data show that, worldwide, groundings/strandings and collisions/rammings (contact) cause roughly equal numbers of major pollution incidents (those resulting in spillage of more than 30 tons, or approximately 10,000 gallons) for tanker sizes considered by the committee. This finding is also valid when considering volume spilled. The breakdown of attributed accident causes for the 50 largest tanker spills between 1960 and 1989 is shown in Table 1-3. This
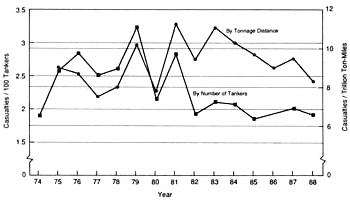
FIGURE 1-9 Worldwide rates of serious casualties to oil/chemical tankers, 1974-1988 (6,000 GT and above). Source: International Maritime Organization Analysis of Serious Casualties to Sea-Going Tankers, 1974-1988. Tonnagedistance analysis was prepared by the committee based on IMO casualty statistics and International Association of Independent Tanker Owners for miles data. *Casualties/trillion ton-miles data covers period 1975-1988.
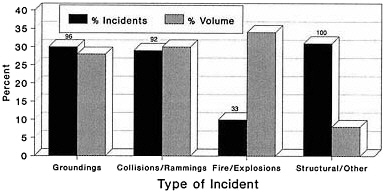
FIGURE 1-10 Major oil spills from tankers and causes: number of incidents and volume—world, 1976-1989. Source: Lloyd's Register of Shipping.
table shows the nearly equal prevalence of the various causes (grounding, collision, structural and machinery failure, and fires and explosions) in the 50 largest spills from tankers. Table 1-4 shows the years in which these spills occurred.
Particularly noteworthy in this table is the large volume of spillage resulting from a relatively small number of fires and explosions. As the initiating cause, fires and explosions produced the greatest outflow of the 50 largest spills. Two recent disasters were vivid reminders of this historical pattern: the KHARK 5, which sustained an explosion and fire leading to release of 76,000 tons of crude oil off Morocco in 1989 (the 11th largest spill since 1960), and the MEGA BORG, which caught fire in the Gulf of Mexico off Texas in 1990, losing 14,000 tons of crude. Fires and explosions also may cause pollution following a collision or other accident. Tanker spill databases are often unclear as to whether the "cause" refers to the casualty or the final event leading to loss of oil. This ambiguity can be misleading. For example, in the world's third-largest spill, the AMOCO CADIZ, oil outflow was due to grounding (stranding), while the casualty usually is attributed to failure of the steering system (machinery failure).
Groundings and Infrequent Large Spills Dominate U.S. Outflow
In U.S. waters, for tankers over 10,000 DWT, grounding events clearly dominate in terms of both numbers of accidents, and, particularly, volume spilled (see Figure 1-11). This should be no surprise in view of the shallow access to Gulf of Mexico and East Coast ports. Examples of shallow-water groundings include the ARGO MERCHANT in 1976 (approximately 25,000 tons outflow), the ALVENUS in 1984 (7,389 tons outflow), the ESSO PUERTO RICO in 1988 (4,050 tons), and the AMERICAN TRADER in 1990 (975 tons). These groundings account for a large portion of accidental spills from tankers that have occurred in U.S. waters since 1980.
Compared to worldwide spillage from major pollution incidents, major oil spills in U.S. waters are relatively low in volume, as shown in Figures 1-12a and 1-12b. The years 1982, 1984, and 1986, when particularly high or average U.S. spillage coincided with unusually low world spillage, are exceptions to this record. There is no evidence of a correlation between U.S. and world losses. The random nature of major spill events is reflected in the list of 50 major outflow incidents (shown in Table 1-3): The frequency, attributed causes, cargo losses, and locations all appear to lack any discernible pattern. The erratic nature of pollution is also evident in Figure 1-13: A few very large spills dominate the total outflow, comprising nearly 95 percent of spillage; but such spills comprise less than 3 percent of the events. In addition to the major groundings noted previously, the 13-year U.S. record is influenced strongly by the BURMAH AGATE (1979), the PUERTO
TABLE 1-3 50 Major Oil Spills from Tankers and Combined Carriers 1960 and 1965–1989
|
|
|
TANKER SIZE |
SPILLAGE |
|
|
|
|
|
|
|
||
|
RANK/RATING* |
NAME |
GRT |
DWT |
TONS |
BARRELS |
TYPE |
LOCATION |
CAUSE |
||||
|
× 103 |
× 103 |
|
|
CO |
GRN |
F/E |
S/H |
N/K |
||||
|
(Metric) |
|
|
|
|
|
|
|
|
||||
|
1 |
ATLANTIC EMPRESS |
128,398 |
292,666 |
257 |
1,890 |
CRUDE |
WEST INDIES |
x |
|
|
|
|
|
2 |
CASTILLO DE BELLVER |
138,823 |
271,540 |
239 |
1,760 |
CRUDE |
SOUTH AFRICA |
|
|
x |
|
|
|
3 |
AMOCO CADIZ |
109,700 |
237,439 |
221 |
1,628 |
CRUDE |
FRANCE, ATLANTIC |
|
|
|
x |
|
|
4 |
ODYSSEY |
65,746 |
138,392 |
132 |
925 |
CRUDE |
MID ATLANTIC |
|
|
x |
|
|
|
5 |
TORREY CANYON |
61,263 |
121,000 |
124 |
909 |
CRUDE |
U.K., CHANNEL |
|
x |
|
|
|
|
6 |
SEA STAR |
63,989 |
120,300 |
123 |
902 |
CRUDE |
GULF OF OMAN |
x |
|
|
|
|
|
7 |
HAWAIIAN PATRIOT |
45,246 |
101,038 |
101 |
742 |
CRUDE |
HAWAIIAN ISLANDS |
|
|
|
x |
|
|
8 |
INDEPENDENTA |
88,690 |
152,408 |
95 |
696 |
CRUDE |
TURKEY, BOSPORUS |
x |
|
|
|
|
|
9 |
URQUIOLA |
59,723 |
111,225 |
91 |
670 |
CRUDE |
SPAIN, NORTH COAST |
|
x |
|
|
|
|
10 |
IRENES SERENADE |
50,903 |
105,460 |
82 |
600 |
CRUDE |
GREECE |
|
|
x |
|
|
|
11 |
KHARK 5 |
138,394 |
284,632 |
76 |
560 |
CRUDE |
MOROCCO, MEDITER. |
|
|
x |
|
|
|
12 |
NOVA |
118,654 |
239,435 |
68 |
500 |
CRUDE |
IRAN, GULF OF |
x |
|
|
|
|
|
13 |
WAFRA |
36,697 |
68,600 |
62 |
480 |
CRUDE |
SOUTH AFRICA |
|
x |
|
|
|
|
14 |
EPIC COLOCOTRONIS |
37,469 |
64,000 |
58 |
427 |
CRUDE |
WEST INDIES |
|
x |
|
|
|
|
15 |
SINCLAIR PETROLORE |
35,744 |
56,000 |
57 |
420 |
CRUDE |
BRAZIL |
|
|
x |
|
|
|
16 |
YUYO MARU NO 10 |
43,724 |
52,836 |
42 |
375 |
WH. PROD |
JAPAN |
x |
|
|
|
|
|
17 |
ASSIMI |
33,847 |
59,032 |
50 |
370 |
CRUDE |
OMAN |
|
|
x |
|
|
|
18 |
ANDROS PATRIA |
99,460 |
122,173 |
48 |
350 |
CRUDE |
SPAIN, NORTH COAST |
|
|
x |
|
|
|
19 |
WORLD GLORY |
28,323 |
45,000 |
46 |
337 |
CRUDE |
SOUTH AFRICA |
|
|
|
x |
|
|
20 |
BRITISH AMBASSADOR |
27,114 |
44,929 |
46 |
337 |
CRUDE |
JAPAN |
|
|
|
x |
|
|
21 |
METULA |
104,379 |
206,719 |
45 |
330 |
CRUDE |
CHILE |
|
x |
|
|
|
|
22 |
PERICLES G.C. |
38,915 |
59,096 |
44 |
324 |
CRUDE |
QATAR |
|
|
x |
|
|
|
23 |
MANDOIL II |
25,313 |
45,000 |
41 |
300 |
CRUDE |
USA, WEST COAST |
x |
|
|
|
|
|
24 |
JAKOB MAERSK |
48,252 |
88,000 |
41 |
300 |
CRUDE |
PORTUGAL |
|
x |
|
|
|
|
25 |
BURMAH AGATE |
32,285 |
62,663 |
41 |
300 |
CRUDE |
USA, GULF |
x |
|
|
|
|
|
26 |
J. ANTONIO LAVALLEJA |
68,931 |
131,663 |
38 |
280 |
CRUDE |
ALGERIA |
|
x |
|
|
|
|
27 |
NAPIER |
23,690 |
38,561 |
37 |
270 |
CRUDE |
CHILE |
|
x |
|
|
|
|
28 |
EXXON VALDEZ |
94,999 |
214,861 |
36 |
267 |
CRUDE |
USA, ALASKA |
|
x |
|
|
|
|
29 |
CORINTHOS |
30,705 |
56,882 |
36 |
266 |
CRUDE |
USA, DELAWARE R. |
x |
|
|
|
|
|
30 |
TRADER |
21,999 |
35,000 |
36 |
263 |
FUEL (CGO) |
GREECE |
|
|
|
x |
|
|
31 |
ST. PETER |
20,678 |
34,730 |
33 |
246,700 |
CRUDE |
ECUADOR |
|
|
x |
|
|
|
32 |
GINO |
26,167 |
48,760 |
32 |
240 |
CARBON BLK |
FRANCE, ATLANTIC |
x |
|
|
|
|
|
33 |
GOLDEN DRAKE |
16,231 |
30,004 |
32 |
238 |
CRUDE |
BERMUDA |
|
|
x |
|
|
|
34 |
IONNIS ANGELICOUSSIS |
35,269 |
68,106 |
32 |
236 |
CRUDE |
ANGOLA |
|
|
x |
|
|
|
35 |
CHRYSSI |
19,183 |
29,653 |
32** |
232 |
CRUDE |
BERMUDA |
|
|
|
x |
|
|
36 |
IRENES CHALLENGE |
21,090 |
34,884 |
31 |
228 |
CRUDE |
PACIFIC OCEAN |
|
|
|
x |
|
|
37 |
ARGO MERCHANT |
18,743 |
28,691 |
28 |
225 |
FUEL (CGO) |
USA, EAST COAST |
|
x |
|
|
|
|
38 |
HEIMVARD |
35,335 |
55,000 |
31 |
225 |
CRUDE |
JAPAN |
x |
|
|
|
|
|
39 |
PEGASUS |
11,089 |
— |
25** |
225 |
WH. PROD |
USA, EAST COAST |
|
|
|
|
x |
|
40 |
PACOCEAN |
17,328 |
30,016 |
31 |
225 |
CRUDE |
NORTH WEST PACIFIC |
|
|
|
x |
|
|
41 |
TEXACO OKLAHOMA |
20,084 |
35,072 |
29 |
225 |
FUEL (CGO) |
USA, EAST COAST |
|
|
|
x |
|
|
42 |
SCORPIO |
26,031 |
42,000 |
31 |
225 |
CRUDE |
MEXICO, EAST COAST |
|
x |
|
|
|
|
43 |
ELLEN CONWAY |
27,931 |
47,566 |
31 |
225 |
CRUDE |
ALGERIA |
|
x |
|
|
|
|
44 |
CARIBBEAN SEA |
18,589 |
30,661 |
30 |
225 |
CRUDE |
EAST PACIFIC OCEAN |
|
|
|
x |
|
|
45 |
CRETAN STAR |
19,674 |
30,372 |
27 |
218 |
CRUDE |
INDIA, WEST COAST |
|
|
|
|
x |
|
46 |
GRAND ZENITH |
18,736 |
29,930 |
26 |
213 |
FUEL (CGO) |
SOUTH AFRICA |
|
|
|
x |
|
|
47 |
ATHENIAN VENTURE |
18,251 |
31,016 |
26 |
200 |
WH. PROD |
CANADA, NEWFOUND. |
|
|
x |
|
|
|
48 |
VENOIL |
152,328 |
330,954 |
26 |
191 |
CRUDE |
SOUTH AFRICA |
x |
|
|
|
|
|
49 |
ARAGON |
122,583 |
238,959 |
24 |
175 |
CRUDE |
MADEIRA |
|
|
|
x |
|
|
50 |
OCEAN EAGLE |
12,065 |
18,824 |
21 |
157 |
CRUDE |
PUERTO RICO |
|
x |
|
|
|
|
Code: CO — Collision/Allision |
S/H — Structure, Hull, or Machinery Failure |
Total, Number Accidents |
11 |
13 |
12 |
12 |
|
|||||
|
GRN — Grounding/Stranding; F/E — Fire/Explosion |
NK — Not Known |
Total, Tons (× 103) |
792 |
693 |
851 |
653 |
|
|||||
|
SOURCE: The International Tanker Owners Pollution Federation, Ltd. (ITOPF) / Ship Tonnage from Lloyd's Register of Shipping (Technical Report No. STD R2-0590) and ITOPF. * Ranking is based on barrels spilled. ** Spillage data in doubt. Items italicized in bold occurred in U.S. waters. |
||||||||||||
TABLE 1-4 50 Major Oil Spills from Tankers and Combined Carriers 1960 and 1965–1989
|
Rank/Rating* |
Name |
Spillage Tons ×103 (metric) |
1960 |
65 |
66 |
67 |
68 |
69 |
70 |
71 |
72 |
73 |
74 |
75 |
76 |
77 |
78 |
79 |
80 |
81 |
82 |
83 |
84 |
85 |
86 |
87 |
88 |
89 |
Rank/ Rating* |
|
1 |
ATLANTIC EMPRESS |
257 |
|
|
|
|
|
|
|
|
|
|
|
|
|
|
|
x |
|
|
|
|
|
|
|
|
|
|
1 |
|
2 |
CASTILLO DE BELLVER |
239 |
|
|
|
|
|
|
|
|
|
|
|
|
|
|
|
|
|
|
|
x |
|
|
|
|
|
|
2 |
|
3 |
AMOCO CADIZ |
221 |
|
|
|
|
|
|
|
|
|
|
|
|
|
|
x |
|
|
|
|
|
|
|
|
|
|
|
3 |
|
4 |
ODYSSEY |
132 |
|
|
|
|
|
|
|
|
|
|
|
|
|
|
|
|
|
|
|
|
|
|
|
|
x |
|
4 |
|
5 |
TORREY CANYON |
124 |
|
|
|
x |
|
|
|
|
|
|
|
|
|
|
|
|
|
|
|
|
|
|
|
|
|
|
5 |
|
6 |
SEA STAR |
123 |
|
|
|
|
|
|
|
|
x |
|
|
|
|
|
|
|
|
|
|
|
|
|
|
|
|
|
6 |
|
7 |
HAWAIIAN PATRIOT |
101 |
|
|
|
|
|
|
|
|
|
|
|
|
|
x |
|
|
|
|
|
|
|
|
|
|
|
|
7 |
|
8 |
INDEPENDENTA |
95 |
|
|
|
|
|
|
|
|
|
|
|
|
|
|
|
x |
|
|
|
|
|
|
|
|
|
|
8 |
|
9 |
URQUIOLA |
91 |
|
|
|
|
|
|
|
|
|
|
|
|
x |
|
|
|
|
|
|
|
|
|
|
|
|
|
9 |
|
10 |
IRENES SERENADE |
82 |
|
|
|
|
|
|
|
|
|
|
|
|
|
|
|
|
x |
|
|
|
|
|
|
|
|
|
10 |
|
11 |
KHARK 5 |
76 |
|
|
|
|
|
|
|
|
|
|
|
|
|
|
|
|
|
|
|
|
|
|
|
|
|
x |
11 |
|
12 |
NOVA |
68 |
|
|
|
|
|
|
|
|
|
|
|
|
|
|
|
|
|
|
|
|
|
x |
|
|
|
|
12 |
|
13 |
WAFRA |
62 |
|
|
|
|
|
|
|
x |
|
|
|
|
|
|
|
|
|
|
|
|
|
|
|
|
|
|
13 |
|
14 |
EPIC COLOCOTRONIS |
58 |
|
|
|
|
|
|
|
|
|
|
|
x |
|
|
|
|
|
|
|
|
|
|
|
|
|
|
14 |
|
15 |
SINCLAIR PETROLORE |
57 |
x |
|
|
|
|
|
|
|
|
|
|
|
|
|
|
|
|
|
|
|
|
|
|
|
|
|
15 |
|
16 |
YUYU MARU NO 10 |
42 |
|
|
|
|
|
|
|
|
|
|
x |
|
|
|
|
|
|
|
|
|
|
|
|
|
|
|
16 |
|
17 |
ASSIMI |
50 |
|
|
|
|
|
|
|
|
|
|
|
|
|
|
|
|
|
|
|
x |
|
|
|
|
|
|
17 |
|
18 |
ANDROS PATRIA |
48 |
|
|
|
|
|
|
|
|
|
|
|
|
|
|
x |
|
|
|
|
|
|
|
|
|
|
|
18 |
|
19 |
WORLD GLORY |
46 |
|
|
|
|
x |
|
|
|
|
|
|
|
|
|
|
|
|
|
|
|
|
|
|
|
|
|
19 |
|
20 |
BRITISH AMBASSADOR |
46 |
|
|
|
|
|
|
|
|
|
|
|
|
x |
|
|
|
|
|
|
|
|
|
|
|
|
|
20 |
|
21 |
METULA |
45 |
|
|
|
|
|
|
|
|
|
|
|
x |
|
|
|
|
|
|
|
|
|
|
|
|
|
|
21 |
|
22 |
PERICLES G.C. |
44 |
|
|
|
|
|
|
|
|
|
|
|
|
|
|
|
|
|
|
|
x |
|
|
|
|
|
|
22 |
|
23 |
MANDOIL II |
41 |
|
|
|
|
|
x |
|
|
|
|
|
|
|
|
|
|
|
|
|
|
|
|
|
|
|
|
23 |
|
24 |
JAKOB MAERSK |
41 |
|
|
|
|
|
|
|
|
|
|
|
x |
|
|
|
|
|
|
|
|
|
|
|
|
|
|
24 |
|
25 |
BURMAH AGATE |
41 |
|
|
|
|
|
|
|
|
|
|
|
|
|
|
|
x |
|
|
|
|
|
|
|
|
|
|
25 |
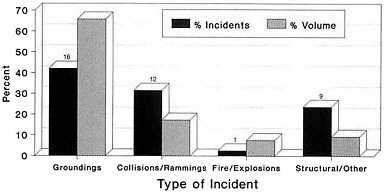
FIGURE 1-11 Major oil spills from tankers and causes: number of incidents and volume—U.S. waters. Source: Temple Barker & Sloane, Inc.
RICAN (1984), the GEORGIA, and the OLYMPIC GLORY (both in 1980). The record of outflow from smaller spills (under 30 tons or 10,000 gallons) in U.S. waters shows significant improvement since the 1970s and has remained relatively constant, between 0.1 and 0.2 thousand tons, since 1983.
Since 1984, the total annual volume of small spills has been less than 5 percent of the major spills. However, the reverse has been true regarding the number of incidents: On average, there have been over 50 times as many small spills as major spills.
The few but calamitous large spills, such as from the EXXON VALDEZ, emerge clearly from the statistics, but the smaller spills that are not among the top 50 also may have significant environmental consequences. In 1989 and early 1990, four tanker spills over 200,000 gallons (equivalent to 650 tons of crude, or 600 tons of fuel oil) occurred near the continental U.S. coast; they received much public attention and were noted by Congress prior to passage of the Oil Pollution Act of 1990. They were:
-
The WORLD PRODIGY, which grounded and spilled 900 tons (also reported as high as 1,365 tons) of light fuel oil off southern Rhode Island in 1989. Fortunately, most of the oil evaporated quickly, but some local environmental damage was sustained.
-
The PRESIDENTE RIVERA, which grounded in the Delaware River near Marcus Hook, Pennsylvania, in 1989 and spilled nearly 900 tons of fuel oil. Local environmental damage was sustained.
-
The RACHEL B, which collided with a coastal towed barge and lost more than 800 tons of partially refined crude in the intersection of the Houston Ship Channel and Bayport Ship Channel.
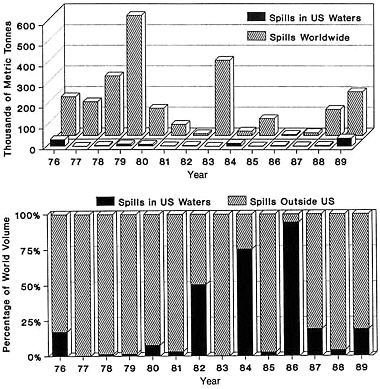
FIGURE 1-12 Comparison of major spills—U.S. versus worldwide. * Over 30 tons, or approximately 10,000 gallons (U.S.).
-
The AMERICAN TRADER, which grounded one mile off Huntington Beach, California in 1990 and spilled an estimated 1,200 tons (395,000 gallons) of light crude. While over a third of the light Alaskan crude oil was recovered, local pollution and beach damage was sustained.
-
The B.T. NAUTILUS, which grounded in the Kill van Kull waterway, New York Harbor, in 1990, and spilled over 700 tons of fuel oil.
Another accident, in 1988, demonstrated how a spill smaller than those listed above (220 tons), which occurred in an ecologically sensitive area, can be damaging and can capture the public attention, causing international repercussions. The barge NESTUCCA was struck while under tow on Puget Sound, and the hull was breached. The released oil, which floated inshore and affected beaches and shorelines in Washington, reached well along the
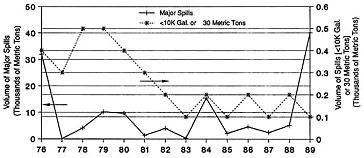
FIGURE 1-13 Tanker oil spills in U.S. waters—volume of spills *>10,000 gallons (U.S.) or approximately 30 tons metric (crude oil). Source: U.S. Coast Guard/Temple, Barker & Sloane, Inc.
coast of Vancouver Island, Canada, causing significant short-term shoreline damage over much of the island and adjacent Puget Sound areas.
These accidents underscore the need to consider, when developing new design and operational practices, the types, sizes, and condition of vessels (and their areas of operation) engaged in the brisk import and coastal petroleum trade.
Vessel Size and Age May Play a Role in Casualties
The IMO database for the world tanker fleet (IMO, 1989) provides a large sample of incidents, both polluting and non-polluting, in most accident categories to offer some valid insight about accidents and tanker characteristics over a 15-year period ending in 1988.
Size of Tanker
The size of tanker21 most common in U.S. waters—50,000 to 100,000 DWT—is within size range with the worst overall worldwide casualty rate of all size categories based on IMO data.22 The casualty rate for collisions and groundings for this size range is about equal to that for all tankers, but the rate for fires/explosions exceeds the average by 33 percent (a rate of 0.76 per 100 ships per year compared to 0.57). Unfortunately, data related to many fire and explosion causes either are lacking or are inconclusive.
Age
There is some evidence of a link between vessel age and serious casualties: Older vessels have more accidents, particularly fires/explosions and
structural/machinery damage (Ponce, 1990). However, the rate for collisions is relatively constant for all age groups. There is no clear evidence of a link between the rate for cargo-related explosions (range 0.18-0.25) and ship age between 5 and 25 years (Lloyd's Register of Shipping, 1990).
Safety of Life
Fires and explosions are the major accidental cause of injuries and death aboard tankers. Any consideration of tank vessel hull design configurations and operations must take into account the influence on risk to the crew of fire and explosion. Unfortunately, there is little accident data that might relate crew casualties to the cause of the accident or the environment, or that might allow detailed analysis of how ship structure, compartment arrangements, ventilation, and safety systems relate to fatalities and injuries. The committee recognized, however, that steps to reduce pollution from tank vessels should not be taken without regard to the safety of the ship's crew.
Again, the 1989 analysis conducted by IMO provides the only comprehensive guidance available to the committee. Over the 15-year period 1974-1988, an average of six major cargo fire incidents occurred per year (IMO, 1990). There was a noticeable reduction in cargo fires and explosions during the years 1986 through 1988; this suggests that the international requirement for inert gas systems (IGS, described in Chapter 3) is having a positive effect. Cargo fires represent about a third of all tanker fires (others occur in the pump room or machinery spaces) and pose the greatest hazard to the crew.
The IMO analysis in this area covers not only oil and chemical carriers, but also combination and gas carriers. Over the 15-year period, 1,209 lives were lost—an average of 81 persons per year. Of these deaths, 67 percent (829) resulted from fires and explosions, and over half of these (480) were due to cargo fires and explosions; 167 lives were lost because of fires and explosions on ships under repair, including 83 in a single casualty in 1978.
The fatality record, in some cases, does not clearly reflect the effect of secondary causes such as a fire or foundering following a collision. Secondary causes account for the loss of many of the 149 persons linked to collisions over a 15-year period.
REDUCING THE RISK OF POLLUTION FROM TANK VESSELS
Background
The world at large has enjoyed the benefits of industrial technology for almost two centuries. Historically, owners and managers of industry and transportation, as well as the public, have focused on the benefits and typically have underestimated or even ignored the inherent risks in deployment
of these technologies. Society has reaped the benefits first and has delayed paying the price of risk until later.
In the last 20 years or so, affluent societies have begun to acknowledge that there are risks associated with these benefits. Risk and safety issues have moved to the forefront of public discussion. Almost daily, newspapers and television news provide coverage of risk in modern society. Regulatory agencies are playing a growing role in risk assessment and its management. Society is more risk conscious than ever before.
Major accidents, with attendant media coverage, underscore the risks: The nuclear accident at Three Mile Island; the chemical accident at Bhopal, India; the nuclear accident at Chernobyl in the U.S.S.R.; the explosion of the space shuttle Challenger; and the wreck of the EXXON VALDEZ. Economic factors and litigation are also compelling industrial owners and managers to consider risk along with the benefits.
Defining Risk
The term ''risk" can be defined as the possibility of suffering harm from a hazard. A hazard is a source of risk and refers to a substance (such as crude oil), an event (e.g., an oil spill) that harms the environment, or a natural hazard (e.g., a hurricane).
In contemplating alternative designs and operations for tank vessels, one way to define risk is to ask the following fundamental questions:
-
What can go wrong?
-
What is the likelihood of that happening?
-
If it does happen, what are the consequences?
The answers to these questions constitute a risk analysis or assessment. For purposes of this report, the answers might be arranged in three columns, with headings such as (1) tank vessel accident scenario, (2) the likelihood or frequency of that scenario, and (3) magnitude or volume of oil spilled in that scenario.
Is the Existing Risk of Pollution Acceptable?
Risk cannot be eliminated but it can be reduced to a level acceptable to society. There are no universally acceptable risks, so decision makers typically identify levels of risk that are tolerable.
In the case of the EXXON VALDEZ, society enjoys the benefits of oil transportation but demands, and subsequently requires action to achieve, a substantial risk reduction.
Figure 1-14 illustrates in a simplified manner the concept of acceptable versus unacceptable risks. Prior to risk-reduction efforts, the risk coordi-
nates (F1, C1) typically fall into the "unacceptable" region. In industry and transportation, changes typically come in the form of design modifications, operational enhancements, administrative features, and changes affecting the management's (e.g., tank vessel owner's) safety/environmental culture. Such changes, if properly executed, can result in substantial risk reduction.
Before deciding how much risk reduction may be desirable, the magnitude of existing risks must be assessed. In the case of tank vessels, the ratio of oil gallons spilled per gallon transported may be useful. Based on Coast Guard statistics for 1974 through 1978, the ratio for tankers is 3.32 × 10⁻⁵, (i.e., 3.3 gallons lost per 100,000 gallons transported) and for barges (both oceangoing and inland) 1.73 × 10 -5 (National Research Council, 1981).
A perspective on the 1980s can be gleaned from statistics gathered by the committee (presented in Chapter 6, in Table 6-1). In the average year, 9,000 tons of oil are spilled in U.S. waters, and 100,000 worldwide; in the worst year, those numbers rise to 40,000 and 360,000, respectively. For comparative purposes, the volume of oil moved annually is roughly 600 million tons in U.S. waters and 1,500 million tons worldwide.
From these figures,23 the ratio of oil spilled to oil transported is:
|
Location |
Average Year |
Worst Year |
|
U.S. |
1.5 × 10⁻⁵ |
6.7 × 10⁻⁵ |
|
World |
6.7 × 10⁻⁵ |
24.0 × 10⁻⁵ |
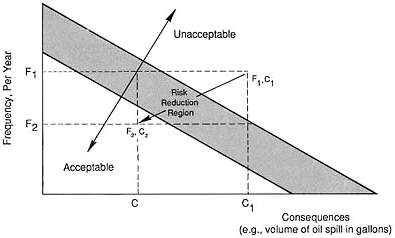
FIGURE 1-14 Unacceptable/acceptable risks for oil spills— frequency versus consequence diagram.
The record suggests that the average risk in U.S. waters has decreased somewhat since the 1970s, but the reluctance of society to accept that risk has increased.
However, to put these numbers in perspective, risk ratios from other industries are useful. For example, recent statistics for the offshore oil pipeline industry indicate that the ratio is 1 × 10⁻⁵ (Ronald E. Prehoda/Department of the Interior, personal communication to D. Perkins, National Research Council, November 1990). In the airline industry, the probability of a landing being aborted is less than 1 × 10⁻⁷ per landing (or one in 10 million, or 1/100 of the pipeline example). The latter example may not be entirely comparable, as landing accidents are a direct threat to human life, while tank vessel accidents often are not. Nevertheless, there is certainly reason to attempt to make significant reductions in risk; a comprehensive risk-assessment study could be undertaken, as the basis for establishing risk-based design goals for tank vessels.
SUMMARY
The preceding discussion makes several points that will influence the analysis in later chapters. First, a threat of pollution exists wherever tank vessels travel, and traffic around the United States appears to be increasing. In addition, the type and condition of tank vessels traveling in U.S. waters varies, and this affects safety and risk; control over these factors is limited. Finally, pollution incidents are so diverse in nature that it may be difficult to select one pollution control measure that would be effective in all, or even most, cases. However, groundings have been the dominant cause of accidental oil pollution in U.S. waters.
The historical record shows that most spills are small, and there is no discernible pattern by which to predict the less frequent large spills. But vessels in the size range most common in U.S. waters appear to have the worst casualty record, based on worldwide data.
Finally, it appears that the risks of transporting oil by tanker may be greater than in related industries, such as the offshore oil pipeline system. A comprehensive risk-assessment study could be undertaken, as the basis for establishing future risk-based design goals for tank vessels, with attendant compliance guidance.
NOTES
|
|
pounds), short tons (2000 pounds), or barrels (42 U.S. gallons). U.S. imports and exports originally were expressed in short tons in U.S. Army Corps of Engineers data; these have been converted to metric tons for this report. (One billion is one thousand million, or 109.) |
|
3. |
Includes import/export, inter- and intracoastal shipping statistics. Sources: Temple, Barker and Sloane, Inc., Energy Information Administration (EIA, 1989), British Petroleum Statistical Review of the World Oil Industry, and statistics provided to the committee by the U.S. Army Corps of Engineers. |
|
4. |
The Port of Houston handled 1,670 port calls in 1989 by tankers over 10,000 DWT, the largest number of any U.S. port; the Port of New York and New Jersey followed with 1,409 port calls that year. (Data provided to the committee by Llyod's Maritime Information Services Ltd.) |
|
5. |
Data presented here refer to 1998 for statistics concerning petroleum import projections and volume in specific ports (source: EIA), and to 1989 for tanker calls in major U.S. ports (source: Lloyd's Maritime Information Services Ltd.) and exports and imports (source: EIA). |
|
6. |
The "base case" EIA estimate is that imports would increase from 6.6 mbd (in 1998) to 10.0 mbd in the year 2000. By then, the forecast calls for consumption to range from 17.5 to 19.9 mbd, domestic production to range from 7.8 to 9.4 mbd, and net imports to range from 8.1 to 12.2 mbd (EIA, 1989). |
|
7. |
A tanker or barge may make several port calls before its entire cargo is unloaded. As an example, a tanker out of Valdez, Alaska, might discharge at Puget Sound and San Francisco Bay. |
|
8. |
Import data are from the Energy Information Administration (EIA, 1989); Alaskan shipments are based on Lloyd's data; intercoastal and intracoastal non-Alaska data are derived from Corps of Engineers statistics for 1988 but are indicative of present activity for tankers and barges over 10,000 DWT. Data are stated in metric tons. |
|
9. |
Refers to barges over 5,000 gross registered tons (GRT) or about 10,000 DWT. GRT are a measurement of the volumetric capacity of a vessel. |
|
10. |
Lightering, a cargo transfer practice, is described in Chapter 2. |
|
11. |
Beyond the additional imports required to meet higher demand, a significant increase in the importation of refined petroleum products and resulting product tanker traffic may result from limitations on: (1) the growth of U.S. refinery capacity and (2) the availability of deep-water offloading and storage facilities for crude oil transported in Very Large Crude Carriers (VLCCs). These factors are not reflected in Department of Energy projections for crude and product imports shown in Figure 1-2. |
|
12. |
Lloyd's and committee estimates. |
|
13. |
Includes 117 tankers owned by independent operators (comprising 45 percent of the total), 66 owned by major oil companies (26 percent), and 74 owned by the U.S. government (29 percent). The government total includes five re-flagged Kuwaiti tankers (Arthur McKenzie/ Tanker Advisory Center, Inc., personal communication to D. Perkins, National Research Council). |
|
14. |
Frederick Siebold/U.S. Maritime Administration, personal communication to D. Perkins, National Research Council, November 27, 1990. |
|
15. |
Lloyd's data provided to the committee. |
|
16. |
Several Alaska-trade tankers in service have double bottoms. |
|
17. |
Lloyd's data provided to the committee. |
|
18. |
Definition of casualty terms is essential to understanding statistics as obtained from the U.S. Coast Guard, Lloyd's Register of Shipping, and the International Maritime Organization. The following terms are used in this report: Groundings. The tank vessel is reported in contact with the sea bottom or a bottom obstacle, struck object on the sea floor, or struck or touched the bottom; includes ships reported "hard and fast" for an appreciable period of time (wrecked/stranded). Collision/Ramming. The tank vessel struck by another vessel on the |
REFERENCES
American Waterways Operators. 1990. Letter report to the Committee on Tank Vessel Design, NRC, April 6, 1990.
Energy Information Administration. 1989. Petroleum Supply Annual. Washington, D.C.: Government Printing Office.
International Maritime Organization. 1989. Analysis of Serious Casualties to Sea-going Tankers, 6,000 gross tonnage and above, 1974-1988. London: IMO.
Lloyd's Register of Shipping. 1990. Statistical Study of Oil Outflow from Oil and Chemical Tanker Casualties. Report conducted for the American Petroleum Institute, Washington, D.C. Technical Report STD R2-0590.
National Research Council. 1975. Petroleum in the Marine Environment. Report based on a workshop held by the Ocean Affairs Board, Airlie, Virginia, May 21-25, 1973.
National Research Council. 1981. Reducing Tankbarge Pollution. Washington, D.C.: National Academy Press.
National Research Council. 1985. Oil in the Sea. Washington, D.C.: National Academy Press.
Ponce, P. 1990. An Analysis of Total Losses Worldwide and for Selected Flags. Marine Technology 27(2):114-116.
Tanker Advisory Center. 1990. Guide for the Selection of Tankers. New York: TAC.
U.S. Coast Guard. 1990b. Report of the Tanker Safety Study Group, Chairman H. H. Bell (rear admiral USCG, retired). Washington, D.C.: U.S. Department of Transportation.
U.S. Coast Guard. 1990d. Update of Inputs of Petroleum Hydrocarbons Into the Oceans Due to Marine Transportation Activities. Paper submitted to IMO Marine Environment Protection Committee 30, London, September 17, 1990.
U.S. Coast Guard. 1990e. Assessment of Success of Tankships with Double Bottoms and PL/SBT in Mitigating Pollution Due to Casualties. Internal analysis by the USCG, Washington, D.C., March 12, 1990.
U.S. Maritime Administration. 1990. Foreign Flag Merchant Ships Owned by U.S. Parent Companies. Report prepared by Office of Trade Analysis and Insurance, Washington, D.C., January 1, 1990.


