
3
Great East Japan Earthquake and Tsunami and Impacts on Japanese Nuclear Plants
The objective of this chapter is to provide an overview of the March 11, 2011, Great East Japan Earthquake and tsunami and their key impacts on Japanese nuclear plants located along the northeastern coast of Honshu, Japan’s main island. The chapter is intended to provide background information to support the committee’s detailed discussions of the Fukushima nuclear accident, which appear in subsequent chapters of this report.
This chapter is organized into five sections.
• Section 3.1 describes the Great East Japan Earthquake and tsunami.
• Section 3.2 describes some key impacts of the earthquake and tsunami on the five nuclear plants located on the northeastern coast of Japan.
• Section 3.3 identifies some key differences in impacts among these plants and reasons for these differences.
• Section 3.4 focuses on tsunami hazards at the Fukushima Daiichi and Daini nuclear plants, in particular, how the plant operator’s (TEPCO’s) understanding of these hazards evolved over time.
• Section 3.5 provides an initial discussion of lessons learned to support more detailed discussions in subsequent chapters.
3.1 GREAT EAST JAPAN EARTHQUAKE AND TSUNAMI
The Great East Japan Earthquake1 occurred off the northeast coast of Honshu (see Figure 3.1) beginning at 14:462 on March 11, 2011. The earthquake was produced by rupture of a large fault at the Japan Trench. The dip of the fault, based on the analyses of the seismic source and previous multichannel seismic measurements of the depth of the fault (Chester et al., 2013; Nakamura et al., 2013), was approximately 10°-13° at the event hypocenter, increasing to about 20° near Japan3 (Gusman et al., 2012). The epicenter was determined by the U.S. Geological Survey to be located at 38.297°N, 142.372°E, 129 km east of Sendai.
3.1.1 Moment Magnitude
Seismogram amplitudes, at least at low frequencies, are proportional to seismic moment.4 For this earthquake, estimates of moments were 2.9 × 10²² newton-meters (N∙m) (Lay and Kanamori, 2011), 3.8 × 10²² N∙m (Fujii et al., 2011), 4.2 × 10²² N∙m (Satake et al., 2013; Yue and Lay, 2013), 4.3 × 10²² N∙m (Frankel, 2013b), 4.42 × 10²² N∙m (Suzuki et al., 2011), and 5.3 × 10²² N∙m (Nettles et al., 20115; Gusman et al., 2012).
When the seismic moment is known from the analysis of seismic and geodetic data, the calculation of a moment magnitude is straightforward.6 Estimates of the moment magnitude were largely 9.0 (e.g., Lay and Kanamori, 2011; Frankel, 2013b; Maeda et al., 2013; Satake et al., 2013; Sugawara et al., 2013; Yamazaki et al., 2013). The exception to this was Nettles et al. (2011), who reported the moment magnitude to be 9.1.7 This was the fourth-largest earthquake in the past 60 or so years and the largest instrumentally recorded earthquake to ever strike Japan.
_________________
1 This earthquake is also referred to as the Tohoku Earthquake by some investigators. See, for example, Noggerath et al. (2011).
2 The 24-hour clock is used for time notation in this report.
3 That is, the dip of the fault increases toward the west nearer to Japan (e.g., Nakahara, 2013).
4 Seismic moment, Mo, is expressed as µAD where µ is the rigidity at the fault, A is the area of the fault that ruptured, and D is the fault displacement.
5 Nettles et al. (2011) is a standard product of the Global Centroid Moment Tensor (GCMT) Project (http://www.globalcmt.org), which has an extensive catalog.
6 Moment magnitude, Mw, is determined using the equation Mw = 2/3 log10(Mo) − 6.0, where Mo is the seismic moment. The constants in the equation were chosen to be consistent with earlier scales at magnitudes less than 8.
7 The latter analysis differed substantially from the others in that a Centroid Moment Tensor was calculated with filtered low-frequency seismograms 8.5 hours long from 100 seismic stations distributed globally.
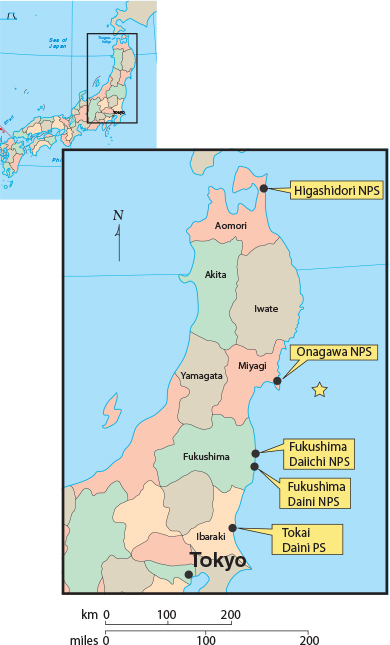
FIGURE 3.1 Map of the Tohoku region of Japan (shaded area in inset) showing the hypocenter of the Great East Japan Earthquake and the locations of the five nuclear plants discussed in this chapter.
3.1.2 Hypocenter Depth
While the epicenter was well determined, the hypocenter depth is poorly constrained from seismic data because it was a shallow event. Estimated depths of 10-25 km were common, assuming the hypocenter was at the boundary between the overlying Eurasian plate and the Pacific plate being thrust beneath (e.g., Chester et al., 2013; Ghofrani et al., 2013; Nakahara, 2013; Tajima et al., 2013).
3.1.3 Fault Dimensions and Displacements
Fault dimension estimates also varied but were generally constrained in a box approximately 600 km along strike8 and 200 km across strike (e.g., Suzuki et al., 2011; Lay et al., 2013; Nakahara, 2013). The fault rupture itself extended from the trench to beneath Japan at the Honshu shoreline, a distance of at least 200 km. The fault, delineated by the trench axis, broke for approximately 500 km. The average fault slip over this surface was 10 m, but the major contribution to the seismic moment was more compact, perhaps 200 km × 200 km.
Kubo and Kakehi (2013) inverted seismological data with offshore seafloor static displacements to determine that 43-m displacements occurred on the shallow part of the fault seaward of the hypocenter, whereas displacements of 4 m extended for 300 km along the fault (Kozdon and Dunham, 2013). Yue and Lay (2013) inverted teleseismic P-wave, short-period Rayleigh waves, permanent GPS stations on Japan, and seafloor displacements to find that the peak slip at the trench was 60 m and slip at the hypocenter was 25 m (Lay et al., 2013). Slip greater than 20 m extended over areas as large as 200 × 200 km.
The earthquake produced strong (exceeding 1g and as large as 3g), long-duration (exceeding 6 minutes) ground shaking in some regions of Japan (Figure 3.2). Seismic waves were generated from several distinct ruptures on the fault (Figure 3.3). Suzuki et al. (2011) have observed that the fault between the hypocenter and trench broke upward for 60-100 s, emitting low frequencies, which were responsible for tsunami excitation. After 100 s, the southwestward propagation with displacements on the order of 5 m provided the bulk of strong motion in Japan.
Intense seismic waves from two or three parts of the fault zone that were inferred to be asperities (i.e., locked sections) are quite visible in the accelerogram (Figure 3.3). Nakahara (2013) found evidence for three sources, two of which led to shaking in the Miyagi region. Energy from a source at greater depth near the border of Fukushima and Ibaraki Prefec-
_________________
8 Where strike refers to the trend of the trench or fault axis.
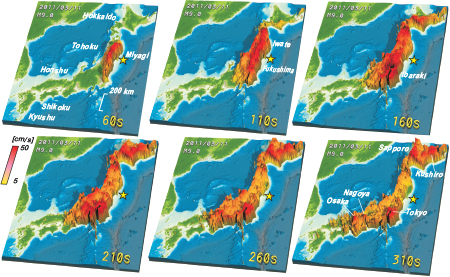
FIGURE 3.2 Propagation of seismic waves generated from the March 11, 2011, Great East Japan Earthquake. The earthquake hypocenter is indicated by the star on the maps. Data were collected by the national K-NET and KiK-net strong ground motion network in near real time. There are more than 1,800 stations across Japan with a station spacing of 20 to 25 km. SOURCE: Furumura et al. (2011). Courtesy of T. Furumura, ERI, University of Tokyo.
tures provided much of the shaking to the south. Ghofrani et al. (2013) used a stochastic model to examine shaking with as many as five sources, which provided the best match with the observed data.
The pseudospectral accelerations derived from the data are particularly useful for engineering studies. The data from KIK-net and (K-NET)9 were particularly important for these high-frequency studies of shaking (Furumura et al., 2011).
The earthquake was accompanied by large crustal displacements of onshore regions in northern Japan (Figure 3.4). The largest displacements—about 5.3 m to the east and 1.2 m downward—occurred along the coast of
_________________
9 K-NET and KIK-net (http://www.kyoshin.bosai.go.jp) comprise nearly 1,800 strong-motion seismographs (K-NET) and strong-motion seismometer pairs located in boreholes and at the surface (KIK-net) across Japan.
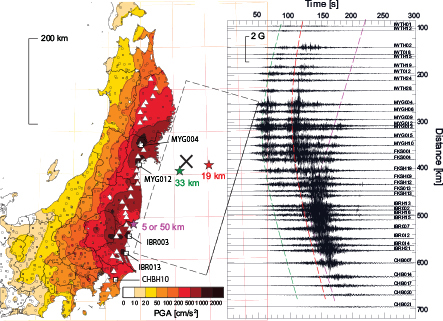
FIGURE 3.3 (Left) Map of northern Japan showing peak ground accelerations (PGA) in cm/s2 for the Great East Japan Earthquake and tsunami (divide by 100 to obtain accelerations in m/s2, where g = 9.8 m/s2). The symbol “X” on the map indicates the location of the earthquake hypocenter and the dashed box indicates the location of the fault plane. (Right) Accelerogram showing the vertical component of ground acceleration as a function of time along an approximate north-south line of onshore seismic stations indicated by the triangles on the map (Left image). There are two and possibly three distinct arrivals of seismic waves indicated by the green, red, and purple lines on the accelerogram. These likely originated from large slips on the fault plane; the hypocenters for these slips are indicated by the colored stars on the map (Left image). SOURCE: Furumura et al. (2011). Courtesy of T. Furumura, ERI, University of Tokyo.
Miyagi Prefecture near the Oshika Peninsula in Ishinomaki City near the Onagawa Nuclear Power Station (see Figure 3.1). The downward displacement of the coast, which was caused by the relaxation of elastic strain at the tectonic plate margin, lowered seawall elevations relative to mean sea level, reducing tsunami protection for coastal communities.
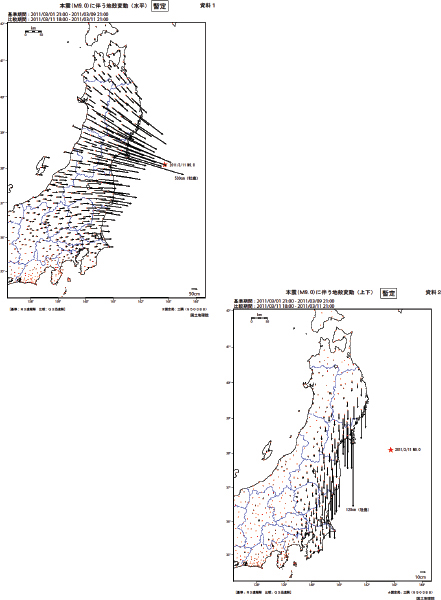
FIGURE 3.4 Horizontal (Left) and vertical (Right) displacements of the crust resulting from the March 11, 2011, Great East Japan Earthquake. The movements shown are relative to a reference point located at Ishinomaki City (Miyagi Prefecture). SOURCE: Geospatial Information Authority of Japan, http://www.gsi.go.jp/chibankansi/chikakukansi40005.html.
3.1.4 Tsunami
Deformation of the seafloor during the earthquake10 triggered a tsunami that caused substantial damage to coastal regions of northeastern Japan. The first wave struck a 2,000-km-long stretch of the Japan coast starting 20 minutes after the earthquake (Mori et al., 2011, 2012). The first wave arrived at the Fukushima Daiichi Nuclear Power Station about 41 minutes after the earthquake. The second and largest wave arrived at the plant about 9-10 minutes later (TEPCO, 2013). Inundation heights varied along the coast depending on seafloor topography, coastline geometry, and ocean-edge waves. The deepest inundations, in one case approaching 40 m, occurred in Iwate Prefecture (Figure 3.5).
Sugawara et al. (2013) conducted surveys on the Sendai Plain, a low-lying coastal region in east-central Miyagi Prefecture, to assess the extent of inundation from the tsunami. Major inundations (inferred from the type and amount of accumulated debris on land surfaces flooded by the tsunami) were observed at distances of up to 4 km from the coast; minor inundations were observed at distances of up to 5 km. The authors state that the inundation area of the 2011 tsunami is “comparable to that of the 869 Jogan tsunami, although a direct comparison is difficult due to differences in geomorphological contexts between the paleo period and the present” Sugawara et al. (2013, p. 831). The Jogan tsunami was generally considered to be the largest historical tsunami in northeast Japan prior to March 2011.
3.1.5 Discussion
The magnitude of the Great East Japan Earthquake exceeded the then-existing maximum estimated earthquake magnitude for the Tohoku Region (Kagan and Jackson, 2013). The 2005 Seismic Hazard Map, for example, estimates a maximum magnitude of 7.7 to 8.0 for earthquakes offshore from Fukushima and Miyagi Prefectures (HERP, 2005, p. 134). Although seismic hazard mapping is helpful for disaster planning, it has serious scientific limitations and has recently been the subject of controversy (Stein et al., 2012, 2013; Frankel, 2013a).
Seismic magnitudes have been used for decades to compare the sizes of earthquake events. An early measure of magnitude was body wave magnitude that could be easily read from a seismogram.11 Because of the nature of
_________________
10 Seafloor displacements of about 50 m horizontal and 7-10 m vertical landward of the Japan Trench were observed from bathymetric surveys (Fujiwara et al., 2011). Deep monuments displayed horizontal seafloor displacements as large as 60-80 m and a pressure gauge recorded a 5-m drop during the tsunami.
11 It is defined as the logarithm of the amplitude of the first-arriving elastic waves from an earthquake.
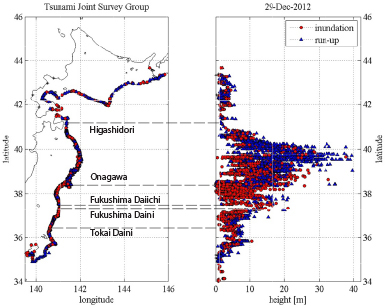
FIGURE 3.5 Tsunami inundation heights (i.e., elevation of maximum water levels taken from watermarks on structures and natural features) and run-up heights (i.e., elevation of the maximum landward extent of debris and seawater marks) in the Tohoku region of Japan. The largest run-ups occurred between latitudes 39º and 40º north, where coastal features focused the tsunami waves. The approximate locations of the five nuclear plants are shown on the figure. SOURCE: 2011 Tohoku Earthquake Tsunami Joint Survey Group. Available at http://www.coastal.jp/tsunami2011/index.php?Field%20survey%20results.
the seismometer and the spectrum of the source, these amplitudes saturate starting around magnitude 6.
A second measure of seismic magnitude is based on surface waves (Rayleigh waves), which arrive later in the seismogram. The formula for this is
![]()
where M is the surface wave magnitude, A is the amplitude of the Rayleigh wave, T is the period of the signal (usually 20s), and σ is a distance correction dependent on the distance between the source and receiver, ∆. The logarithmic dependence is clear. Unfortunately, like the body wave magnitude, the surface wave magnitude begins to saturate around magnitude 8.
The currently used measure of seismic magnitude, moment magnitude (Mw), which was described previously in this chapter, does not become saturated at higher magnitudes. However, the most recent (2005) seismic hazard map did not use this metric for predicting future hazards.
Noggerath et al. (2011) noted that construction of the Fukushima plants began in 1967, well before the moment magnitude scale was introduced.12 At the time, the largest magnitudes were expected not to exceed 8.5, and seismic moment was not yet being used by engineers, regardless of the seismic moment. On the basis of the introduction of the moment magnitude (Kanamori, 1977), we now know that earthquakes larger than magnitude 9 do exist; the largest recorded event was a magnitude 9.5 in Chile in 1960. Earthquakes may be even larger than this but have not occurred since the introduction of modern seismic technologies in the 20th century. Noggerath et al. (2011) note that Professor Hiroo Kanamori had used the original surface wave approach to find that the Tohuku Earthquake (i.e., Great East Japan Earthquake) measured 8.2, versus the 9.0-9.1 based on the moment magnitude scale. Several studies after the 2004 Sumatra earthquake (Stein and Okal, 2007; McCaffrey, 2008) suggested that earthquakes with a moment magnitude of 9 could occur at any subduction zone throughout the world, but these studies do not appear to have been considered by disaster preparedness planners in Japan.
A news report in Nature (Cyranoski, 2011) noted that the 2009 seismic hazard map for Japan (March 2009) reported a 30-40 percent chance of a rupture in the region where the Great East Japan Earthquake occurred in the next decade and a 60-70 percent chance in the next 20 years. However, the expected earthquake had a magnitude of only about 7.7. The hazard map segmented northeastern Japan into five seismic zones with probabilities associated with historical data. No consideration was given to the possibility that an earthquake event would involve rupture across zone boundaries. Moreover, the magnitudes may have been biased low by the saturation of early measurements of earthquake magnitude.
Kagan and Jackson (2013) published a paper entitled: “Tohuku Earthquake: A Surprise?” Their conclusion was that the earthquake should not have been considered a surprise. The paper noted that four previous subduction zone earthquakes with magnitudes 9.0 or greater had occurred in the past century and that there was no reason to believe this could not happen near Japan. As noted above, this was also pointed out before the earthquake by Stein and Okal (2007) and McCaffrey (2008).
_________________
12 The scale was introduced in the late 1970s and came into common usage in the 1980s (e.g., Kanamori, 1977).
3.2 IMPACTS ON JAPANESE NUCLEAR PLANTS
Five Japanese nuclear plants were affected directly by the March 11, 2011, earthquake and tsunami. All of these affected plants are located along the northeastern coast of Japan (Figure 3.1; Table 3.1). There are a total of 15 reactors at these plants; 11 reactors were operating when the earthquake occurred and four reactors were shut down for maintenance.
Information on the impacts of the earthquake and tsunami on these plants was obtained from the following sources:
• Government of Japan’s reports to the International Atomic Energy Agency (IAEA) (Government of Japan, 2011a,b),
• TEPCO’s report on the Fukushima nuclear accident (TEPCO, 2011a,b, 2012b),
• IAEA update logs for the Fukushima accident (see, e.g., http://www.iaea.org/newscenter/news/2011/fukushima070411.html),
• IAEA reports on Japanese nuclear plant inspections (IAEA, 2011, 2012), and
• Briefings to the committee during its meeting in Tokyo (see Appendix B).
Brief descriptions of these impacts based on these reference materials are provided in the following sections.
TABLE 3.1 Japanese Nuclear Power Plants Affected by the Great East Japan Earthquake and Tsunami
| Plant | Distance to Earthquake Epicenter (km) | No. of Reactors at Plant | No. of Reactors Operating at Time of Earthquake | ||
| Higashidori Nuclear Power Station | 300 | 1 | 0 | ||
| Onagawa Nuclear Power Station | 80 | 3 | 3 | ||
| Fukushima Daiichi Nuclear Power Station | 150 | 6 | 3 | ||
| Fukushima Daini Nuclear Power Station | 160 | 4 | 4 | ||
| Tokai Daini Power Station | 260 | 1 | 1 | ||
NOTE: Distances estimated from U.S. Geological Survey–determined location for earthquake epicenter (38.297°N, 142.372°E) and rounded to the nearest 10 km.
3.2.1 Higashidori Nuclear Power Station
The Higashidori Nuclear Power Station is located on the Shimotika Peninsula in northern Aomori Prefecture (Figure 3.1). It has one operating reactor; two other reactors are under construction. The operating reactor was in a maintenance outage when the earthquake occurred and all of its fuel had been offloaded to the spent fuel pool. The earthquake and tsunami did not cause any damage to plant facilities or equipment. However, the earthquake cut all offsite AC power to the plant for part of a day. Emergency diesel generators supplied power to the plant until offsite power was restored.
A 7.1-magnitude aftershock on April 7, 2011, also cut all offsite AC power to the plant. An emergency diesel generator supplied power until offsite AC power could be restored.
3.2.2 Onagawa Nuclear Power Station
The Onagawa Nuclear Power Station is located on the Oshika Peninsula in Ishinomaki City in east central Miyagi Prefecture (Figure 3.1). The plant has three operating reactors (Figure 3.6). Two of the reactors (Units 1 and 3) were operating at full power and one reactor (Unit 2) was in startup operation when the earthquake occurred. The earthquake caused the three reactors at the plant to shut down (i.e., scram) automatically. Unit 2 reached cold shutdown13 about 3 minutes after the tsunami occurred. Units 1 and 3 reached cold shutdown early in the morning on March 12.
Four of the five offsite AC power lines were tripped by the earthquake, cutting most offsite AC power. Emergency diesel generators started up after the loss of offsite power, but two of the five operating generators tripped after the tsunami flooded their cooling-water pumps. The remaining three diesel generators supplied power to the plant until offsite AC power was restored on March 12.
The tsunami arrived at the plant about 43 minutes after the earthquake. The maximum tsunami height was 13 m, which was below the elevation of the main part of the plant (14.8 m14) where the reactor and turbine buildings are sited. Consequently, this portion of the site did not experience any flooding.
_________________
13 Defined by TEPCO (2012b) to occur when reactor cooling-water temperature falls below 100oC. In the United States, cold shutdown is said to occur when the reactor coolant system is at atmospheric pressure and at a temperature below 200oF (~93oC) following cooldown of a reactor (see http://www.nrc.gov/reading-rm/basic-ref/glossary/full-text.html).
14 These elevation estimates are relative to the station reference point, Onahama Peil (O.P., Onahama Port Construction Standard Surface). See Table 3.2 notes for definition. As shown in Figure 3.4, co-seismic subsidence in areas near the station exceeded 1 m.
TABLE 3.2 Comparison of Tsunami Heights with Site Elevations at Four Nuclear Power Plants
| Plant | Estimated Tsunami Wave Height (m) | Plant Main Elevation (m) | Seawall Elevation (Breakwater Elevation) (m) | Emergency Diesel Generator Elevation (m) | Seawater Pump Elevation (m) |
| Onagawa | 13 | 14.8 | 14 | 14.8 | 14.8 |
| Fukushima Daiichi | 13 | 10 (Units 1-4) 13 (Units 5-6) |
4 (5.5) | 2 (Units 1-5) | 4 |
| Fukushima Daini | 9 | 12 | 4 (all units) | 3 (Units 1-4) | 4 |
| Tokai Daini | 5.4 | 8 | 6.1 | 8 | |
NOTE: Elevations are relative to the Onahama Peil (Onahama Port Construction Standard Surface), abbreviated O.P. for the Onagawa and Fukushima Daiichi and Daini plants; and mean sea level for Tokai Daini plant. Elevations have not been corrected for co-seismic ground subsidence.
SOURCES: Government of Japan (2011b), TEPCO (2012b), Tohoku (2012); TEPCO briefings to committee.
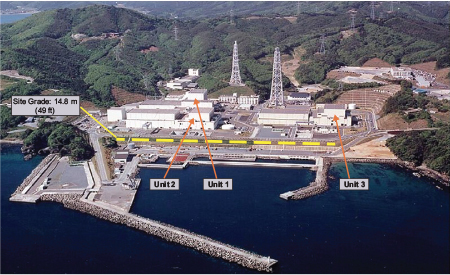
FIGURE 3.6 Oblique aerial photo of the Onagawa Nuclear Power Station prior to the March 11, 2011, Great East Japan Earthquake and tsunami. SOURCE: Courtesy of Tohoku Electric Power Company.
The earthquake and tsunami damaged some plant equipment and structures, but none of the damage affected the structural integrity of the plant. Among the more significant damage reported was an electrical short in a switchgear panel, which caused a fire, the toppling of an oil tank, and flooding in the basement of the Unit 2 reactor building, which submerged a heat exchanger, flooded cooling-water pumps, and resulted in the loss of function of two emergency diesel generators, as noted previously.
3.2.3 Fukushima Daiichi Nuclear Power Station
The Fukushima Daiichi Nuclear Power Station is located in east-central Fukushima Prefecture (Figure 3.1; see also Figure 1.2 in Chapter 1). The plant’s six reactors had the following status at the time of the earthquake:
• Units 1, 2, and 3 were operating at licensed power15 level.
• Unit 4 was in an outage for replacement of the reactor core
_________________
15 That is, the maximum reactor heat output, or maximum power level, that is allowed under the plant license.
shroud.16 Fuel from the Unit 4 reactor had been relocated to the spent fuel pool in the reactor building.
• Units 5 and 6 were in inspection outages. Fuel remained in their cores and the reactors were being actively cooled. The Unit 5 containment was open and the primary system was undergoing pressure testing.
Reactor Units 1, 2, and 3 automatically shut down when the earthquake occurred. The earthquake cut all offsite AC power to the plant, but emergency diesel generators started up to supply backup power. The plant operator concluded that “major equipment with safety-critical functions maintained its safety functions during and immediately after the earthquake” (TEPCO, 2012b, p. 148). Plant workers were not able to complete an inspection of the plant for earthquake-related damage before the tsunami struck. Subsequent flooding and radioactive contamination prevented inspections for damage in some parts of the plant, particularly the basement levels in some reactor and turbine buildings.
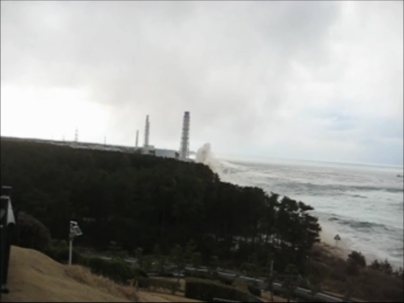
The main tsunami, estimated to be 13 m high (Figure 3.7), flooded areas around Units 1-4, reaching maximum flood depths of up to 5.5 m (Figure 3.8). Floodwaters entered the basement levels of reactor and turbine buildings through building entranceways, emergency diesel generator intake louvers, equipment hatches, and cable and pipe penetrations. The floodwater damaged pumps, electrical distribution panels, backup batteries, and diesel generators, causing loss of most plant power and ultimate heat sink.17
In the 72 hours following loss of power, the Unit 1, 2, and 3 reactors melted down, releasing hydrogen and radioactive materials. Hydrogen explosions in the Unit 1, 3, and 4 reactor buildings caused severe structural damage (Figure 3.9). An overview of major events in Units 1-4 is provided in Sidebar 3.1. A more detailed accident time line is presented Chapter 4.
The Japanese government issued a series of evacuation orders for residents around the plant beginning about 5 hours after loss of power and 4 hours after the government declared an Article 15 Emergency Event (loss of emergency core cooling and water injection) on March 11. The initial evacuation order, given at 20:50 on March 11 by the governor of Fukushima Prefecture, was for residents within a 2-km radius of the plant. The Japanese government ordered the evacuation of residents within 3 km of the plant 33 minutes later. That order was further extended to 10 km
_________________
16 The core shroud is a stainless steel cylinder that surrounds the fuel assemblies.
17 Ultimate heat sink was defined in U.S. Atomic Energy Commission (now U.S. Nuclear Regulatory Commission) Regulatory Guide 1.27 (AEC, 1974, p. 1.27-1): “that complex of water sources, including necessary retaining structures (e.g., a pond with its dam, or a river with its dam), and the canals or conduits connecting the sources with, but not including, the cooling water system intake structures for a nuclear power unit.” The ultimate heat sink at the Fukushima Daiichi plant is the Pacific Ocean.
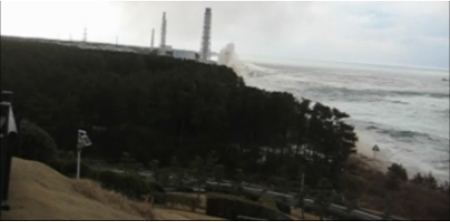
FIGURE 3.7 Photo taken looking north toward the Fukushima Daiichi plant on March 11, 2011. The photo shows the tsunami wave as it strikes the seaward side of the plant. Flooding can also be seen in the foreground of the photo. SOURCE: Courtesy of TEPCO (http://photo.tepco.co.jp/library/110409/110409_1f_tsunami_1t.jpg).
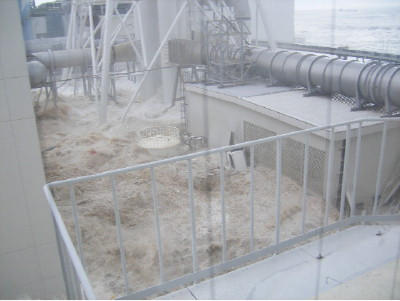
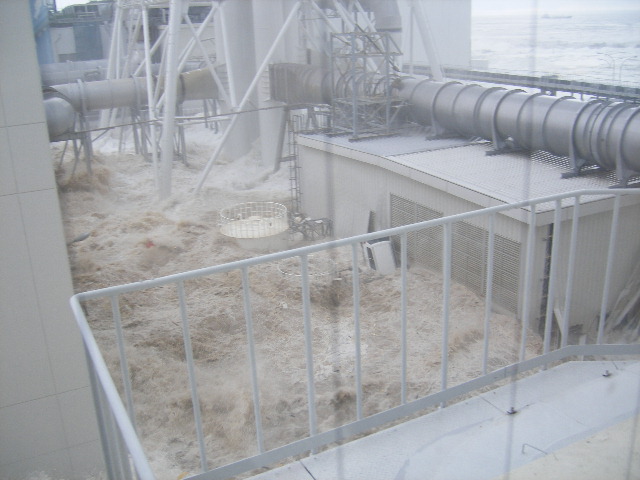
FIGURE 3.8 Photo showing flooding at the Fukushima Daiichi plant on the north side of Radiation Waste Treatment Facility on March 11, 2011. This facility is located south of Unit 4 (see Figure 1.2 in Chapter 1). Scale is indicated by the back end of a vehicle propped against the metal door. SOURCE: Courtesy of TEPCO (http://photo.tepco.co.jp/library/110519_2/110519_1_4.jpg).
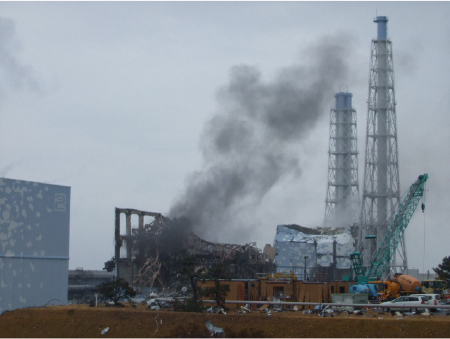
FIGURE 3.9 March 21, 2011, photo of damaged Unit 3 (middle) and Unit 4 (right) reactor buildings. Unit 2 is shown on the left margin of the photo. SOURCE: Courtesy of TEPCO (http://photo.tepco.co.jp/en/date/2011/201103-e/110321-01e.html).
at 05:44 on March 12. However, cell phone records indicate that residents had largely self-evacuated areas within 10 km of the plant hours before this evacuation order was given (Hayano and Adachi, 2013, especially Fig. 3). The evacuation order was extended to 20 km at 18:25 on March 12, almost 3 hours after the hydrogen explosion in Unit 1.
At Unit 6, one air-cooled emergency diesel generator and its electrical distribution panel were undamaged by tsunami-related flooding. This generator was used to supply power to Units 5 and 6, both of which reached cold shutdown on March 20.
Efforts to restore offsite AC power began immediately after the earthquake. However, because of the extensive damage from the earthquake and tsunami, the first power line to the site was not restored until March 18.
3.2.4 Fukushima Daini Nuclear Power Station
The Fukushima Daini Nuclear Power Station is also located in east-central Fukushima Prefecture, about 12 km south of the Fukushima Daiichi
plant (Figure 3.1). The plant has four reactors (Figure 3.10), all of which were operating—and which shut down automatically—when the earthquake occurred. Two of the four offsite AC power lines were lost during the earthquake,18 but one AC line continued to supply power. A second backup line was restored on March 12 and a third backup was restored on March 13. Because offsite AC power was maintained after the earthquake, control room instrumentation and controls remained available to reactor operators.
The first tsunami struck the plant about 36 minutes following the earthquake. The maximum tsunami height, which occurred at about 41 minutes after the earthquake, flooded areas around reactor units at the southern end of the site (Figure 3.11). Most emergency diesel generators, switchgear for cooling pumps, and seawater pumps were rendered inoperable by the floodwaters. However, Unit 3 had one functional emergency diesel generator and operable reactor heat removal system pumps. All four units also had functional reactor core isolation cooling systems.
During the 36 hours following the tsunami, reactor operators were able to maintain reactor cooling systems while plant personnel replaced damaged pumps and installed nearly 9 km of temporary power cables. Reactor operators also made preparations to vent reactor containments so that low-pressure water could be used to cool the reactors if needed. However, plant personnel were able to replace motors and restore power to the units, so venting was not necessary. The reactors achieved cold shutdown on March 12 (Unit 3), March 14 (Units 1 and 2), and March 15 (Unit 4).
Further discussion of the actions taken at the Fukushima Daini plant to recover from the tsunami is provided in Chapter 4; see particularly Sidebar 4.2.
3.2.5 Tokai Daini Station
The Tokai Daini Station is located in east-central Ibaraki Prefecture (Figure 3.1). It has one reactor, which was operating when the earthquake occurred. It shut down automatically. The earthquake cut all offsite AC power, but emergency diesel generators supplied backup power until offsite power was restored on March 13. The reactor reached cold shutdown early in the morning on March 15.
The first tsunami wave arrived at the site approximately 30 minutes after the main shock of the earthquake. The tsunami flooded the seawater pump for one of the emergency diesel generators, rendering it inoperable,
_________________
18 One of the four offsite AC power lines was shut down for maintenance prior to the earthquake.
March 11, 2011
| 14:46 | Great East Japan Earthquake (Mw 9.0) occurs. |
| 14:47 | Unit 1-3 reactors automatically shut down (scram). |
| 14:48 | Offsite AC power is lost; onsite emergency diesel generators automatically start up to provide AC power. |
| 15:27 | First tsunami wave arrives at wave height metera (+41 minutes after earthquake). |
| 15:36-15:37b | Second (main) tsunami wave (height ~13 m) inundates parts of plant (+50 to +51 minutes after earthquake). |
| 15:37-15:41 | Article 10 Notification Eventc occurs (loss of all plant power). |
| 16:36 | Article 15 Emergency Eventd occurs in Units 1 and 2 (loss of emergency core cooling system water injection sources). |
| 19:03 | Japanese government declares a nuclear emergency. |
| 20:50 | Fukushima Prefecture governor orders residents within a 2-km radius of the plant to evacuate. |
| 21:23 | Japanese government orders evacuation radius to 3 km. |
March 12
| 05:44 | Japanese government increases evacuation radius to 10 km. |
| 15:36 | Hydrogen explosion occurs in Unit 1 reactor building. |
| 18:25 | Japanese government increases evacuation radius to 20 km. |
and a seawater pump for one source of core cooling. However, the main area of the site was not flooded.
3.3 DIFFERENCES IN PLANT IMPACTS
The March 11, 2011, earthquake and tsunami had markedly different impacts on the five nuclear plants located along the northeast coast of Japan. It is instructive to examine the reasons for these differences.
The Higashidori plant and Tokai Daini plant lost all offsite AC power,
March 13
| 05:10 | Article 15 Emergency Event occurs in Unit 3 (loss of emer- |
| gency core cooling system water injection sources). |
March 14
| 11:01 | Hydrogen explosion occurs in Unit 3 reactor building. |
March 15
| 06:14 | Hydrogen explosion occurs in Unit 4 reactor building. |
| 08:11 | Article 15 Emergency Event occurs in Unit 4 (abnormal release of radioactive materials). |
________________
NOTE: All times are local (Japan Standard Time) in 24-hour notation.
a The wave height meter is located about 1.5 km offshore of the Fukushima Daiichi plant.
b TEPCO (2012b) reported this time as 15:35. TEPCO (2013, Attachment Earthquake-tsunami-1) provides an updated time for wave arrival at the plant based on photographic analysis.
c Section 15 of the Japanese Act on Special Measures Concerning Nuclear Emergency Preparedness (Act No. 156, December 17, 1999) specifies conditions under which the Nuclear Emergency Preparedness Manager must notify competent authorities about conditions at the nuclear plant.
d Section 15 of the Act on Special Measures Concerning Nuclear Emergency Preparedness (Act No. 156, December 17, 1999) specifies conditions under which a Declaration of a Nuclear Emergency Situation would be made. The Japanese Prime Minister is responsible for notifying prefecture governors, mayors of municipalities, and the public that a nuclear emergency has occurred.
but their emergency diesel generators operated as designed to provide the backup power needed to bring the reactors to cold shutdown.
The Onagawa plant was located closest to the fault that produced the earthquake epicenter. Nevertheless, the plant experienced relatively little damage, and its three operating reactors were able to reach cold shutdown within a half day of the tsunami. Three design features of the plant contributed to this outcome:
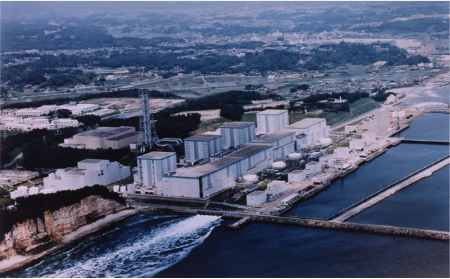
FIGURE 3.10 Oblique aerial photo of the Fukushima Daini Nuclear Power Plant. SOURCE: Courtesy of TEPCO.
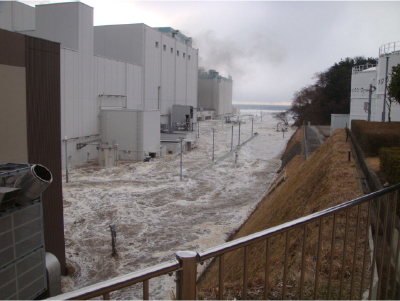
FIGURE 3.11 Photo showing flooding of the Fukushima Daini plant adjacent to Unit 1 during the March 11, 2011, tsunami. Flooding depth was between 2-3 m. SOURCE: Courtesy of TEPCO (http://photo.tepco.co.jp/library/110411_3/110412_2f_tsunami_6.jpg).
• The site had five offsite power lines, one of which survived the earthquake. Consequently, the site did not lose all offsite AC power.
• The site is elevated (14.8 m above O.P.19; see Figure 3.6) and did not flood during the tsunami.
• Seawater pumps are located in pits about 100 m from the plant harbor. The pump motors are elevated within the pits to protect them from flooding.
The positive outcome at the Onagawa plant can be attributed to its good design for earthquake and tsunami hazards.
The Fukushima Daiichi plant also lost all offsite AC power. However, the impacts of the earthquake and tsunami on this plant were markedly different than at the Onagawa plant, primarily because
• Parts of the site, including areas around Units 1-4, were flooded by the tsunami.
• Openings into turbine and service buildings near ground level were not watertight; consequently, the lower levels of those buildings were flooded.
• Seawater pump motors, which are used to move decay heat from the reactors to the Pacific Ocean, were not elevated sufficiently to protect them from flooding.
As noted previously, the tsunami flooded emergency diesel generators, batteries, pumps, and electrical distribution equipment, resulting in a cascade of failures: loss of electrical power, severe damage to the Unit 1-3 reactor cores, and severe structural damage to the Unit 1, 3, and 4 reactor buildings.
The Fukushima Daini plant also had extensive flooding damage from the tsunami. But, unlike Fukushima Daiichi, the reactor operators were able to bring the plant’s three reactors to cold shutdown. This was possible because
• One offsite AC power supply to the plant and the battery-powered DC power system survived the earthquake and tsunami. Consequently, critical instruments and control equipment continued to operate.
• Flooding was less severe because the plant site was located at a higher elevation relative to the tsunami. Consequently, some electrical distribution equipment remained operational.
• Plant personnel were able to replace or work around some of
_________________
19 Onahama Peil (Onahama Port Construction Standard Surface). See Table 3.2 notes.
the damaged equipment so that critical reactor safety functions could be restored.
The outcome at Fukushima Daini could have been far worse had the plant lost all offsite AC power as occurred at Fukushima Daiichi.
3.4 TSUNAMI HAZARDS AT JAPANESE NUCLEAR PLANTS
The importance of protecting nuclear plants from large tsunamis was well understood when the Fukushima Daiichi and Daini nuclear plants were designed and constructed.20 At the time these plants were constructed it was common practice to use records of past tsunamis to estimate expected maximum tsunami wave heights. In the case of Fukushima Daiichi and Daini, TEPCO used the tsunami from the May 22, 1960 earthquake near Valdivia, Chile,21 as an estimate of the maximum tsunami wave heights that would be expected at these plants. These estimates were O.P. + 3.122 m22 for Fukushima Daiichi and O.P. + 3.122 m (Unit 1) to O.P. + 3.705 m for Fukushima Daini (Units 3 and 4) (see Table 3.3), where O.P. is the abbreviation of Onahama Peil, which is the tidal level at the Onahama Port (Onahama Port is located to the south of the Fukushima Daiichi Plant).
The maximum wave height from the Great Chilean Earthquake tsunami was also used as the design basis for tsunami protection walls along Japan’s eastern coast. These walls typically consisted of large earthen berms with openings for roads. The openings were hardened with concrete frames and heavy doors that could be closed for tsunami protection.
In 2002, the Japan Society of Civil Engineers (JSCE) published a quantitative assessment methodology for estimating maximum tsunami wave heights at nuclear plants in Japan (JSCE, 200623). JSCE used the historical earthquake and tsunami record to develop standard fault models for generating tsunamis. These models were simulated numerically by varying key fault model parameters to identify “design tsunamis” that exceed all recorded and calculated historical tsunami heights.
TEPCO and other nuclear plant operators in Japan used this JSCE
_________________
20 Construction permits for Fukushima Daiichi Units 1-6 were issued between 1966 and 1972. Permits for Fukushima Daini Units 1-4 were issued between 1974 and 1980.
21 The main shock of this earthquake had a moment magnitude 9.5 and is the largest earthquake ever recorded. The tsunami from this earthquake affected coastal regions throughout the Pacific Rim, including Japan.
22 The estimates reported by TEPCO in this section and in Table 3.3 give tsunami heights to the nearest millimeter. This precision has no significance for tsunami heights that are measured in meters.
23 An English-language version of this paper was issued in 2006. See http://committees.jsce.or.jp/ceofnp/system/files/JSCE_Tsunami_060519.pdf.
TABLE 3.3 Tsunami Wave Height Estimates at the Fukushima Daiichi and Fukushima Daini Plants
| Tsunami Height Estimates (meters relative to O.P.a) | |||||
| Date | Estimate Basis | Fukushima Daiichi | Fukushima Daini | ||
| 1966-1980 (plant permits) | May 22, 1960 earthquake near Valdivia, Chile | 3.122 (Units 1-6) | 3.122 (Unit 1) 3.690 (Unit 2) 3.705 m (Units 3 and 4) | ||
| 2002 | JSCE (2002)b methodology | 5.7 | 5.2 | ||
| 2007 | Fukushima Prefecture Disaster Prevention Plan | ~5.0 | ~5.0 | ||
| 2007 | Ibaraki Prefecture Disaster Prevention Plan | 4.7 | 4.7 | ||
| 2008 | TEPCO trial calculations using fault models for HERP postulated earthquake | 8.4-10.2 (Inundation heights: 13.7-15.7) | 7.6-8.2 (Inundation height: 15.5) | ||
| 2008 | TEPCO trial calculations for Satake et al. (2008) model for Jogan tsunami | 8.7-9.2 | 7.8-8.0 | ||
| 2009 | JSCE (2002) with updated tidal and bathymetric data | 6.1 | 5.2 | ||
a Onahama Port Construction Standard Surface.
bAn English-language version of this paper was issued in 2006. SOURCES: TEPCO (2012b); TEPCO presentation to the committee, September 6, 2012.
methodology to estimate maximum tsunami wave heights at their plant sites. Based on this new methodology, the maximum tsunami wave height at Fukushima Daiichi was estimated to be O.P. + 5.7 m, over 2.5 m higher than the estimate in the plant’s original permit. The maximum tsunami wave height at Fukushima Daini was estimated to be O.P. + 5.2 m, over 2 m higher than the estimate in the plant’s original permit (Table 3.3).
TEPCO took several countermeasures to protect critical equipment and infrastructure at its plants in response to these new estimates. At Fukushima Daiichi, TEPCO raised the elevations of seawater pumps used to cool
emergency diesel generators and feed emergency core cooling systems. At Fukushima Daini, TEPCO made portions of buildings watertight.
Following the December 2004 Indian Ocean earthquake and tsunami24 there was a renewed effort in Japan to document the 869 Jogan tsunami; that tsunami occurred well before the advent of modern recordkeeping. TEPCO undertook tsunami deposit surveys in the vicinity of the Fukushima Daiichi plant (TEPCO, 2012b, p. 26); it found tsunami deposits at sites north of the plant that were assumed to be from this tsunami. TEPCO reported that those deposits were located at elevations of 0.5 m to 4 m. TEPCO also reported that no tsunami deposits related to the Jogan tsunami were found south of the plant.
In 2006 and 2007 the Fukushima and Ibaraki Prefectures issued disaster prevention plans that contained tsunami wave height estimates ranging from O.P. + 4.7 m to O.P. + 5.0 m (Table 3.3). However, because these estimates were less than estimates based on the JSCE (2006) methodology, TEPCO took no additional countermeasures to protect critical equipment and infrastructure at its plants.
In 2008,25 TEPCO made what it refers to as “trial calculations” of maximum wave heights based on two information sources: (1) a Headquarters for Earthquake Research Promotion (HERP) conclusion that a magnitude 8.2 earthquake could occur anywhere along the Japan Trench (HERP, 2002); and (2) wave source models for the 869 Jogan tsunami based on the models of Satake et al. (2008). The estimated maximum wave heights from these trial calculations were significantly higher than previous estimates: up to O.P. + 10.2 m at Fukushima Daiichi and up to O.P. + 8.2 m at Fukushima Daini (see last two rows in Table 3.3). The estimated maximum run-up height at the southern portion of the Fukushima Daiichi site was estimated to be 15.7 m (Table 3.3). This is similar to the 15.5-m inundation height at the plant from the March 11, 2011, tsunami.
TEPCO revised its maximum tsunami wave height estimates in 2009 using the JSCE (2006) methodology with updated bathymetric and tidal data. The new estimates were O.P. + 6.1 m for Fukushima Daiichi and O.P. + 5.2 m for Fukushima Daini (Table 3.3). TEPCO raised the elevations of seawater pumps at Fukushima Daiichi based on this new estimate.
In 2009, TEPCO and other nuclear plant operators also requested that JSCE undertake additional reviews of tsunami source fault models and associated methodologies; TEPCO staff reported to the committee that this review was estimated to take about 3 years (2009-2012) with the publication of a new methodology in 2013. Additional time would have been
_________________
24 The tsunami produced 30-m-high waves in the Aceh Province of Indonesia.
25 TEPCO analysts presented a paper on probabilistic tsunami hazard analysis in 2006. See Sakai et al. (2006).
required to apply this new methodology to obtain updated wave-height estimates and, if necessary, take appropriate countermeasures at Japanese nuclear plants. The new JSCE methodology was not completed prior to the March 11, 2011, earthquake and tsunami.
However, there were indications as early as 2001 that large-scale tsunamis on the east coast of Japan might have recurrence intervals of 800-1,100 years (Minoura et al., 2001). Noggerath et al. (2011) reported on a June 2009 Japanese government committee hearing at which a senior geologist at a government-affiliated research laboratory warned about the risks of large tsunamis based on Jogan tsunami data. They suggest that TEPCO response to the warning was inadequate.
TEPCO staff told the committee that much of the company’s thinking about tsunami hazards was based on the location of previous tsunami sources off the east coast of Japan. TEPCO staff also told the committee that there were no records of large earthquakes along the Japan Trench off the coast of Fukushima Prefecture where its plants are located.
TEPCO staff told the committee that the company did not take immediate countermeasures at its plants based on the results of the 2008 trial calculations because (1) there was no record of magnitude 8-level earthquakes off the coast of Fukushima, as noted in the previous paragraph; (2) both JSCE and Japanese government agencies did not consider a large tsunami source to be present off the coast of Fukushima; and (3) the Jogan tsunami source had not been determined and additional tsunami deposit surveys were needed. TEPCO thought it was necessary to further investigate the appropriateness of the tsunami source models used in the 2008 trial calculations.
It should be clear from the descriptions in the preceding section that TEPCO actively implemented countermeasures to protect critical equipment and infrastructure at its Fukushima Daiichi and Daini plants in response to new information about tsunami hazards. Consequently, it is puzzling to the committee why TEPCO appeared to lack a sense of urgency to act after its 2008 trial calculations yielded tsunami wave estimates that were substantially higher than previous estimates (Table 3.3). To the committee’s knowledge, TEPCO did not take any steps to implement additional countermeasures at its plants in response to this new information. Instead, TEPCO (as well as other plant operators) called for more studies.
At the same time TEPCO was calling for more studies of tsunami methodologies, it was actively implementing countermeasures in response to new information about earthquake hazards. For example, TEPCO implemented
two major countermeasures at the Fukushima Daiichi plant following the 2007 Niigata Chuetsu-Oki Earthquake.26
1. TEPCO installed a fire suppression system that could also be used in emergencies to inject water into the plant’s reactors.
2. TEPCO also constructed an earthquake-resistant building for the plant’s onsite Emergency Response Center.
Both of these countermeasures improved the ability of the Fukushima Daiichi plant’s operators to respond to the March 11, 2011, earthquake and tsunami (see Chapter 4).
Implementation of additional countermeasures to protect the Fukushima Daiichi plant from a 10-m tsunami wave estimated from the 2008 trial calculations (Table 3.3) might have required extensive modifications to the harbor front at the plant, for example, augmentation of the existing seawall,27 construction of a new harbor wall in front of the plant, and/or reconfiguration of the seawater intakes and outfalls. However, other types of countermeasures might have been implemented through less disruptive modifications:
• Moving seawater pumps to protect them from flooding;
• Raising the elevations of emergency diesel generators, batteries, and electrical switching equipment;
• Implementing other means to protect this equipment from flooding, for example, by sealing entryways into buildings against water intrusion; and/or
• Installing additional backup equipment at higher elevations on the plant site.
Of course, even had TEPCO implemented such countermeasures, they might not have been sufficient to protect the plant against flooding from the March 11, 2011, tsunami. Nevertheless, such countermeasures might have reduced flooding damage and provided more time for plant operators to more quickly restore power to critical reactor monitoring and cooling equipment.
TEPCO has been criticized for not being prepared for the March
_________________
26 This 6.6 moment magnitude earthquake occurred on July 16, 2007, in western Japan offshore of Niigata Prefecture. The earthquake affected operations at TEPCO’s Kashiwazaki-Kariwa Nuclear Power Station.
27 The main function of the seawall is to protect the plant harbor from ocean waves during storms. Raising the seawall may not have been sufficient to protect the plant from large tsunamis because there are openings in the seawall to the ocean (see Figure 1.2 in Chapter 1).
11, 2011, earthquake and tsunami at its Fukushima Daiichi plant (e.g., Investigation Committee, 2011, 2012; NAIIC, 2012). This NAS committee was not tasked with assessing whether adequate preparations were taken by TEPCO before or in response to the earthquake or tsunami. Rather, the committee’s task is to identify lessons that can be learned from the accident for improving safety and security of U.S. nuclear plants.
FINDING 3.1: The overarching lesson learned from the Fukushima Daiichi accident is that nuclear plant licensees and their regulators must actively seek out and act on new information about hazards that have the potential to affect the safety of nuclear plants. Specifically,
1. Licensees and their regulators must continually seek out new scientific information about nuclear plant hazards and methodologies for estimating their magnitudes, frequencies, and potential impacts.
2. Nuclear plant risk assessments must incorporate new information and methodologies as they become available.
3. Plant operators and regulators must take timely actions to implement countermeasures when such new information results in substantial changes to risk profiles at nuclear plants.
The findings and recommendations in Chapter 5 of this report expand on this lesson learned.
Nuclear plants usually operate for many decades. Scientific understanding of hazards, especially hazards arising from natural external events, can advance substantially during such extended periods. The first Fukushima reactors were constructed in the 1960s, when the plate tectonics concept was just coming into acceptance by the scientific community and subduction processes were just beginning to be understood. In the 1960s, knowledge about large earthquakes and tsunamis was based on historical records. Five decades later, advances in scientific understanding of subduction zone processes have enabled the development of new methodologies and technologies for estimating seismic and tsunami hazards. Further substantial advances are likely in the decades ahead.
Japan has expanded its capabilities for monitoring and understanding earthquake and tsunami hazards using extensive geophysical networks installed over the past decade. These networks include
• 816 GEONET stations for GPS geodetic measurements (e.g., Melgar and Bock, 2013),
• 1,800 modern seismic stations (e.g., Furumura et al., 2011),
• Five DART (Deep-Ocean Assessment and Reporting of Tsunami) Buoys,28
• Pressure gauges in deep water29 (e.g., Gusman et al., 2012),
• Nearshore GPS stations operating from buoys, and
• Geodetic monuments in deep water.
Data from these monitoring stations can be used to measure absolute changes in seafloor configurations associated with tsunamis. Geodetic data by themselves are now capable of predicting tsunami run-ups with considerable accuracy. Similar networks are being deployed in other parts of the world as well. For example, the U.S. National Science Foundation has installed new, dense broadband seismic and permanent GPS geodetic stations in coastal Oregon and Washington and is operating seafloor broadband stations near the Cascadia Fault. A new seafloor network, the NSF Ocean Observatory Initiative,30 will be installed later this year, permitting new geodetic and seismic technologies to be included. A similar network is already operating off Vancouver.31
________________
28 Located offshore of eastern Japan.
29 Several of the gauges were located near the epicenter of the Great East Japan Earthquake.


