
ANNEX 1:
DIETARY RECOMMENDATIONS FOR FISH CONSUMPTION
The Fish System:
A Complex Adaptive System with Diverse Actors
Despite the presence of contaminants such as methyl mercury in fish, the belief of many experts has been that consuming fish is beneficial for health. The Dietary Guidelines for Americans, 2010 recommends consumption of 8 ounces of seafood per week (USDA and HHS, 2010). An analysis of the impacts of this recommendation constitutes a good example of a policy that, if realized, could have unintended consequences in dimensions beyond health, including environmental, social, and economic effects. The committee’s framework could be applied to study how to integrate the health, environmental, social, and economic effects of fish consumption.
The fish example specially illustrates Principle 3 in the committee’s framework—account for system dynamics and complexities—because it illustrates a dynamic global system that involves multiple actors at all levels, from fishers to development agencies to nutritionists offering dietary guidance. These actors have different goals and information, and they often disagree among themselves on issues such as the strength of the evidence of effect of eicosapentaenoic acid and docosahexaenoic acid on health. They also may have different views and awareness of food security in the short and long terms, and most have not thought about the effects of changed fishing policies on different populations. For example, in some geographical areas, the fisheries sector might benefit from increased demand while in others it might lead to economic declines and food insecurity. A lack of institutional capacity makes it difficult to include those most directly affected in policy decisions and safety and biodiversity discussions. At the same time, multiple signs of adaptation by various actors to the decline in fish and aquatic stocks are evident. These include the immense growth in aquaculture, especially in Asia; the significant research on environmentally benign production methods; and the distribution of information about fish caught or produced under sustainable conditions. These changes are not consistent around the world or even within the same country. Geographical diversity and spatial complexity are particularly important in the fish example.
The global nature of fish and the particular circumstances of its production and distribution by multiple players along multiple supply chains governing flow among countries, as well as global market signals, produce many unintended effects, including those described above. The geographic distances introduce long lag times into feedback loops between consumption and production. A dearth of research on the effects of current practices, as well as climate change on future capacity, present serious challenges to all of the actors in the system.
A number of the elements of this complex adaptive system have already been assessed. Still, knowledge gaps persist, stakeholders disagree about the extent of the problem, and debates continue among scientists about the validity of research findings and assumptions.
Fish and other types of seafood are an important source of protein worldwide. Globally, they comprise about 6 percent of dietary protein, but for 3 billion people, fish account for up to 20 percent of the average per-capita intake of animal protein (FAO, 2014). Fish and seafood also are sources of other important nutrients, including the long-chain polyunsaturated fatty acids (PUFAs) eicosapentaenoic acid/docosahexaenoic acid (EPA/DHA), which are associated with reduced heart disease risk.
Because of the potential health benefits of fish, the Dietary Guidelines for Americans, 2010 (DGA) recommend that people consume 8 ounces of seafood per week—especially marine-derived “oily” fish such as salmon, mackerel, sardines, pompano, anchovies, swordfish, trout, and tuna—to provide an average daily consumption of 250 mg of EPA/DHA per day (USDA and HHS, 2010). Other fish provide these fatty acids, but levels are low enough that very large amounts of fish would have to be consumed each day to meet the recommendation. Although another omega-3 fatty acid, alpha linolenic acid (ALA), can be converted into EPA and DHA, the conversion is fairly limited in humans. The DGA also recommend consumption of a variety of types of seafood to reduce the amount of methyl mercury consumed from any one type. Five of the top 10 consumed seafood are low in mercury—shrimp, light tuna, salmon, pollock, and catfish (AHA, 2014).
Fish consumption in the United States is low: 6.8 kg per capita in 2011 (measured by food intake, not availability). Per-capita intake data show the mean seafood intake is approximately 9 g per day, and nearly 50 percent
of this is shrimp (Raatz et al., 2013). Of the top 10 seafood consumed,1 only salmon contains a sufficient amount of EPA/DHA per serving to meet the 250 to 500 mg per day recommended by some groups. Moreover, data from the National Health and Nutrition Examination Survey (NHANES) 2003-2008 food consumption survey show that only 20 percent of seafood consumed was in the high omega-3 group (Papanikolaou et al., 2014). At best, the intake of these PUFAs is about 40 percent of the suggested level.
The amount of fish available per capita in the United States has declined since 2006 from 16.5 to 14.4 pounds in 2012 (NFI, 2013). Studies show that familiarity, price, and freshness most influence consumer decisions to purchase fish (Hall and Amberg, 2013), and the decline has been attributed to fish prices among a number of other factors. Some research suggests one reason for the decline is the fish advisories regarding methyl mercury and other toxicants, as discussed below. An unintended consequence is that instead of choosing seafood with lower mercury levels, many consumers have reduced their intake of fish altogether (Rheinberger and Hammitt, 2012). Given that consumers often do not have access to the facts they need to make fully informed choices, the seafood industry along with restaurants and retailers are key determinants of the amount, type, and form of fish that people consume by affecting cost, availability, and the desirability of different fish (Oken et al., 2012).
Fish consumption is the final link along the supply chain of the fish subsystem, which is connected to natural resources both domestically and globally. Figure 7-A-1 represents a map of this food subsystem with a selection of actors and processes that will be affected if demand is increased.
Identify the Problem
Assessments are typically triggered by a broad problem or concern. The first step, identifying the problem, is often done based on a literature review and consultation with stakeholders. The problem identified in this example is that if consumers were to fully follow the DGA seafood recommendation, significant increases in the supply of fish would be necessary. An assessment team would explore the health, environmental, social, and economic consequences (in the United States and abroad) of following the current DGA’s recommendations for fish consumption compared with the current consumption of fish.
_____________
1 The top 10 are shrimp, canned tuna, salmon, tilapia, pollock, pangasius, crab, cod, catfish, and clams.
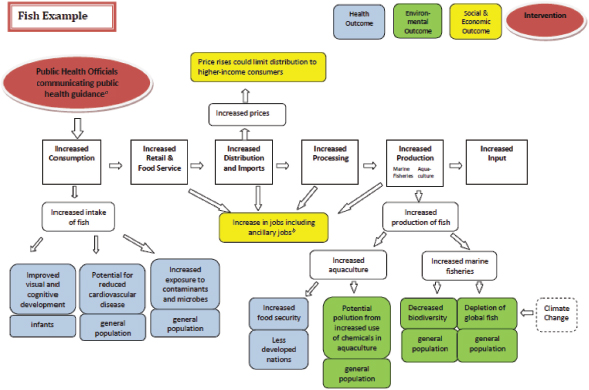
FIGURE 7-A-1 Conceptual model of selected drivers and potential effects of the current U.S. health guidance on fish consumption. The arrows show the potential effects both within the supply chain and in the broader physical and socioeconomic context. The effects noted are based on a review of selected scientific publications, not a systematic review of the literature. Interactions such as feedbacks (e.g., the fact that increased prices might decrease the demand, ameliorating the effects) are not illustrated.
a The 2010 Dietary Guidelines for Americans (USDA and HHS, 2010) state that Americans should increase the amount of seafood they eat to at least 8 or more ounces (2 to 3 servings) each week. Smaller amounts of seafood are recommended for children. Pregnant and breastfeeding women should eat at least 8 and up to 12 ounces of seafood, from choices that are lower in methyl mercury, each week to boost babies’ brain and eye development.
b Ancillary jobs include processing, packaging, marketing, distribution, manufacturing of fish processing equipment, net and gear making, ice production, supply, boat construction and maintenance, retail, research, and administration.
Define the Scope of the Problem
After identifying the problem, the second step in an assessment is to establish the boundaries of the analysis and to describe the major drivers and the relevant health, environmental, social, and economic effects (see Figure 7-A-1). This step is critical to defining appropriate dietary recommendations for oily fish consumption that meet multiple goals, because meeting those goals may require trade-offs between the potential health
effects of the recommendations and their environmental, social, and economic effects. For this example, the boundary of the system to be modeled is the United States, operating within a global fish system, and we provide a brief literature review to describe these drivers and their mechanisms.
Health Effects
Nutrition In the early 1970s, researchers reported that Greenland Eskimos (Inuits) had very low rates of heart attacks and less heart disease in general compared with their Danish counterparts (Bang et al., 1971). The scientists attributed these health benefits to the consumption of fish and sea mammals containing high levels of the long-chain PUFAs. Over the ensuing decades, thousands of research studies have been conducted to determine the effects of fish and fish oils on human health (O’Keefe and Harris, 2000). The results of this extensive research led to the recommendations for fish consumption in the 2010 DGA. The benefits are primarily considered to be a reduction in risk of coronary heart disease in adults and an improvement in cognitive development in infants and young children. Recently, Fodor et al. (2014) questioned the early studies of Greenland Eskimos, pointing out that subsequent studies showed the incidence of heart disease in the Eskimo population in Greenland and in Alaska and Canada to be similar to that of the non-Eskimo population.
These inconsistencies in results raise the question as to how strong the association is between reduced cardiovascular disease risk and fish intake. Despite this question, experts in many countries offer dietary advice to their populations regarding fish and fish oil intake. At this time, seafood is the primary source of EPA/DHA in human diets (IOM, 2007). Fish do not synthesize these fatty acids; they obtain them through diets consisting of algae and krill or other fish. Most infant formula is now supplemented with DHA that comes from algal sources.
Food safety Some health organizations (e.g., the American Heart Association, the World Health Organization) acknowledge that a number of species of fish contain significant levels of methyl mercury, polychlorinated biphenyls, dioxins, and other environmental contaminants. These contaminants are generally higher in marine mammals and in older, larger fish that are higher on the food chain (i.e., higher trophic-level fish). Mercury is a contaminant of oceans, fresh water lakes and rivers, and soil arising from natural geologic processes or from atmospheric fallout, largely from coal-fired power plants. The mercury concentrates through the fish food chain primarily in the form of methyl mercury, which is a neurotoxin and a possible risk factor for cardiovascular illness (Ginsberg and Toal, 2009). Since the early 1970s, states have provided advisories regarding the safety of
fish caught in their waterways and lakes. In 1994, the U.S. Food and Drug Administration (FDA) issued its first national advisory to limit consumption of swordfish. In 2001, it issued its second advisory for commercially harvested and processed fish.2 FDA was criticized then for ignoring the stronger recommendations of a National Research Council panel, which had concluded that FDA standards were outdated (NRC, 2000). In 2001, the U.S. Environmental Protection Agency (EPA) also issued similar advisories for fish being caught by anglers. In 2004, FDA and EPA published their first joint advisory warning pregnant women, women planning to become pregnant, nursing mothers, and young children to eliminate shark, swordfish, king mackerel, and tilefish from their diets and to limit their consumption of other fish to 12 ounces per week to minimize exposure to methyl mercury (FDA/EPA, 2004). This was a higher amount than recommended by the Dietary Guidelines, demonstrating an inconsistency in consumer advice. In June 2014, FDA and EPA issued a draft of a new advisory suggesting that pregnant women eat at least 8 ounces and as many as 12 ounces per week of fish that are low in mercury. They also recommended limiting consumption of albacore tuna by pregnant women to 6 ounces a week and said that women and children should follow advisories from local officials regarding fish from local bodies of water (FDA/EPA, 2014). This advice was given despite recent research (Karagas et al., 2012) that demonstrated adverse effects of prenatal methyl mercury exposure at doses similar to FDA recommended limits. A recent analysis of blood samples collected during the 2007-2010 NHANES showed that 4.6 percent of adults sampled had blood levels of mercury at or above 5.8 μg mercury/liter, EPA’s cut-off point for a level without appreciable lifetime risk of deleterious effects. Blood mercury levels increased significantly as the frequency of consumption of shark and swordfish increased. Blood mercury increased as well when the frequency of salmon and tuna increased, though not as rapidly (Nielsen et al., 2014).
In 2007, the Institute of Medicine (IOM) released a set of recommendations intended to balance the risks and benefits of fish consumption with regard to nutrients and toxicants. In general, the advice was to eat two 3-ounce portions (cooked) of fish per week, and for females who are or may become pregnant or breastfeeding, and for children up to age 12, to avoid higher trophic-level predatory fish (IOM, 2007). All other demographic groups were urged to choose a variety of types of seafood to reduce the risk of exposure to contaminants from a single source. Under the assumption that the potential benefits of fish consumption outweigh the potential health risks, recent research has increased the specificity by quantitatively
_____________
2 The 2001 FDA advisory recommended that pregnant women, nursing mothers, young children, and women who may become pregnant not consume shark, swordfish, king mackerel, and tilefish and that they not consume more than 12 ounces of other fish per week.
analyzing the net risk/benefit of individual fish species based on their methyl mercury and EPA/DHA content (Ginsberg and Toal, 2009). Ginsberg and Toal found that the omega-3 fatty acid benefits outweigh methyl mercury risk for some species (farmed salmon, herring, and trout). The opposite was true for swordfish and shark. Other species were associated with a small net benefit (e.g., canned light tuna) or a small net risk (e.g., albacore canned tuna). In another study, researchers calculated that newborns gained a modest amount of IQ points if their mother complied with the FDA/EPA fish advisory. When health effects where monetized, their model also showed that this gain could be offset by an increase in cardiovascular risk if those older than 40 reduced their fish intake by one monthly meal (Rheinberger and Hammitt, 2012).
Seafood also has well-characterized hazards caused by microbes and naturally occurring toxins (see Chapter 3). In 2007, the U.S. Centers for Disease Control and Prevention (CDC) reported that among 235 outbreaks that could be attributed to a single commodity, seafood was stated as the cause of 24 percent of the total. This means that given its low consumption, seafood is responsible for a disproportionate number of outbreaks (Upton, 2010). In 2013, CDC reported 299 outbreaks in 2010 that could be attributed to a single commodity, and 37 of these were for fish (CDC, 2013).
Environmental Effects
Caught fish To increase the availability and affordability of needed protein-rich foods in the developing world, government efforts to increase fishing capacity were greatly expanded in the 1950s. This was mainly accomplished by developing large industrial fishing operations with the capability of landing a much greater tonnage of fish than before. World fisheries production leveled off in the 1970s when the majority of fish stocks were being fully exploited. Global fish production has increased about 80 times in volume since 1950 and was 158 million metric tons (mmt) in 2012, including capture fish and aquaculture (FAO, 2014). The former has stabilized at about 90 mmt over the past decade and aquaculture contributes more than 40 percent of total production at this point. About 136 mmt (86 percent) of fish production was used as food for people in 2012 at a level of 19.2 kg per capita (FAO, 2014). This is a large increase from the 1980s, when about 70 percent was used for human consumption and the remainder for nonfood uses such as fish meal or oil. In 2012, edible fish and shellfish landings from marine waters by U.S. fishers were 4.4 mmt, the third largest producer country behind China and Indonesia (FAO, 2014). The United States also is the second largest importer of fish in the world, importing approximately 90 percent of its fish supply (FAO, 2012).
Customary natural resource management policies have favored the pursuit of maximum yields, which has led to “spectacular resource collapses” (Newman and Dale, 2009). Since the 1970s when concerns about depletion started to increase, fisheries and fish stocks have been studied extensively by different sectors using different metrics—a cause of some of the disagreement about the issue. Demonstrating one example of the heterogeneity in the fish subsystem, conservationists look at extinction risk (defined as species that have declined more than 50 percent within the most recent 10 years or three-generation period). Fisheries3 estimate biomass trajectories (called stock assessments) and reference points against which to benchmark population status (Davies and Baum, 2012).
Although fisheries management has had some success in the United States, seeing a decline in overfishing and some fisheries’ stocks rebuilding to healthy levels, the global situation is less optimistic. In spite of a number of international treaties, illegal fishing is still a problem, and management of fisheries is relatively ineffective in some countries. For example, illegal overfishing of bluefin tuna in the Mediterranean continues to be a problem. Globally, nearly 30 percent of fish stocks are overexploited, and about 60 percent are fully exploited (near their maximum sustainable production level, which is defined as the largest catch that can be taken from the species stock over an indefinite period) (FAO, 2014). Most of the stocks of the top 10 species consumed are fully exploited and will not increase in production (FAO, 2012). In addition to human consumption of fish, another human-derived driver of this subsystem is climate change. Wild fish stocks are expected to decline further with the stresses of climate variability, such as ocean acidification, changes in temperature, nutrient supply, light availability, and many others. Concerns are being raised about the negative effects of climate change on marine ecosystems and habitats, decreased biodiversity, as well as fish stock depletions (Rice and Garcia, 2011). The most recent Intergovernmental Panel on Climate Change Assessment Report (IPCC, 2014) states that the projected impacts of climate change on fish stocks are very negative on a global scale, although some fisheries will increase, and that fishers can adapt by decreasing pollution, changing fishing pressures, increasing aquaculture, and instituting more dynamic management policies. In a review of the literature on impacts on ecosystem productivity, a paper by Hollowed et al. (2013) offered a broad perspective on marine fish and shellfish species’ habitat, human communities, and food
_____________
3 In the United States, under the Magnuson-Stevens Fishery Conservation and Management Reauthorization Act of 2006, the National Oceanographic and Atmospheric Administration’s Office of Sustainable Fisheries helps manage fisheries (e.g., meeting catch limits and ending overfishing, and increased international cooperation), promoting sustainable fisheries and preventing economic losses. They do their work by providing guidance to the Regional Fishery Management Councils on management of fisheries.
security. The authors emphasized that important questions regarding the effects of physical and biological processes and their incorporation into models remain unanswered. They recognized the many uncertainties in assessing the impacts of climate change. They also pointed to several areas where research is needed, such as collecting physiological measurements as affected by multiple factors; ecological monitoring of the interactions among physical, chemical, and biological components; and estimating the vulnerabilities of countries to detriments in fisheries due to climate change.
Aquaculture As an adaptation to the decline in fish stocks, since 1981 world fish production through aquaculture has expanded at an average annual rate of nearly 9 percent, but it slowed recently to approximately 6 percent growth (FAO, 2014). Inland aquaculture, which generally uses fresh water, has increased from 50 percent of total aquaculture production in 1980 to 63 percent in 2012 (FAO, 2014). Of the top 10 consumed sea-foods in the United States, 5 are either primarily or substantially produced by aquaculture (Raatz et al., 2013). U.S. aquaculture production is about 6 percent of U.S. seafood demand, but not all species raised are excellent sources of EPA/DHA. Marine aquaculture is about 20 percent of U.S. aquaculture production (NOAA, 2014), but the production was lower in 2012 in North America than in 2000, mainly due to competition from countries with lower production costs (FAO, 2014).
Aquaculture production is steadily expanding. In fact, in 2011, global farmed fish production exceeded beef production (Larsen and Roney, 2013), and by 2015, aquaculture is projected to surpass capture fisheries (OECD/FAO, 2013). The expansion is bringing increased attention to the environmental damage caused by different production systems, including the pressure on wild fish stocks when they are used as feed sources (especially herring, anchovies, and sardines). These are used to preserve traditional flavors and to provide sources of DHA/EPA to farmed fish. Other problems caused by aquaculture operations include declines in water quality, extensive energy use, antibiotic use, and invasive species (Diana et al., 2013; Oken et al., 2012).
Social and Economic Effects
Fisheries and aquaculture provided livelihoods and income for an estimated 58 million people engaged in the primary sector of fish production in 2012, of which an estimated 7 million were occasional fishers and fish farmers, with 84 percent residing in Asia (FAO, 2014). In 2012, about 19 million people were engaged in aquaculture (in Asia 97 percent of fish-related employment is in fish farming). Employment in the fisheries and aquaculture primary sector has continued to grow faster than has employ-
ment in agriculture, so that by 2010 it represented about 4 percent of the 1.3 billion people economically active in the broad agriculture sector worldwide. In the past 5 years, the number of people engaged in fish farming has increased by 5.5 percent per year, compared with only 0.8 percent per year for those in capture fisheries (FAO, 2012).
Fisheries and aquaculture also provide numerous jobs in related activities, such as processing, packaging, marketing and distribution, manufacturing of fish processing equipment, net and gear making, ice production and supply, boat construction and maintenance, research, and administration. All of this employment, together with dependents, is estimated to support the livelihoods of 660 to 820 million people, or about 10 to 12 percent of the world’s population (FAO, 2014).
Recognizing the size of the global workforce and the importance of engaging the workforce as the industry develops, researchers are investigating (1) ways to place a greater emphasis on local human capital because better trained and educated workforces will be able to adapt to local conditions and production; (2) the development of risk management systems to enhance security against invasive species, including pathogens; and (3) development of global standards for sustainably produced products from aquaculture (Diana et al., 2013). Another useful tool is social impact assessments (SIAs). In the United States, the National Oceanic and Atmospheric Administration provides guidance on how to conduct and implement the results of assessments that allow fishers and fishing communities to address the social impacts of fishery management alternatives (Pollnac et al., 2006). This research makes clear that the seafood industry, especially fishers, should be more involved in developing research and outreach projects to improve management practices regarding environmental pollution such as feed types (replacing fish-based feed with plant sources) and water quality management.
In the United States, commercial fishing is one of the most hazardous and deadliest occupations. The fatality rate for fishers is 124 per 100,000, which is astronomically higher than the overall rate for all workers of 4 per 100,000 (CDC/NIOSH, 2014). Although the work environments for commercial fishing operations vary significantly by the body of water and type of fish being harvested, fishers generally encounter harsh working conditions, including extreme weather, long work hours, strenuous physical labor, and living in confined quarters (BLS, 2014; CDC/NIOSH, 2014). Leading causes of fatalities among fishers are sinking vessels, falling overboard, and contact with onboard machinery and fishing gear (CDC/NIOSH, 2014; Lincoln et al., 2008). The most hazardous U.S. fisheries, based on fatality rates, are the Northeast multispecies ground fish fishery, the Atlantic scallop fishery, and the West Coast Dungeness crab fishery (CDC/NIOSH, 2014).
Yet another issue is concern about the fact that the combined effect of rising demand and the collapse of local fisheries has led developed countries such as the United States, Japan, and members of the European Union to increasingly import large quantities of seafood from developing countries. The proportion of fish and fish products being traded on the global market is 40 percent versus 5 percent for rice (Jenkins et al., 2009). This demand puts intense pressure on developing countries either to allow access of foreign fishing fleets into their coastal fishing grounds or to export their fish to foreign markets. In either case, the local markets of developing countries where basic nutrition and health are challenges (e.g., nations in West Africa) are deprived of an important source of protein for the sake of the developed world (Jenkins et al., 2009).
Identify the Scenarios
To understand the effects of a new policy (e.g., changed dietary recommendations), or technology (e.g., sustainable farming production methods), or a shock to the system (e.g., accelerated ocean warming in some parts of the world), an assessment of the fishing system would include a step that compares the performance of the current system as described in the scope—the baseline—with one or more alternative scenarios that reflect the proposed change. For this example, the baseline is the current consumption of fish in the United States, and the alternative scenarios would be changes in consumption of seafood by the U.S. population, either increases in consumption of fish to meet the current DGA recommendations or decreases in consumption to meet other goals. The alternative scenarios would consider a variety of factors, such as:
- Different levels of fish recommendations, including the present DGA recommendations and several lower percentages of that;
- Different levels of or changes in methyl mercury levels consumed in fish that might result from compliance with fish advisories by targeted populations;
- Different amounts of wild and farmed salmon produced under different environmental, climate change, and biodiversity conditions; and
- Different levels of fish protein needed in various parts of the world.
Conduct the Analysis
In this step of an assessment, data, metrics, and analysis tools are used to examine the likely health, environmental, social, and economic effects associated with the alternative scenarios. A systemic analysis also would
consider any assessments already conducted on the health, environmental, social, and economic dimensions. Based on the framework principles, a seafood analysis would use methods that describe potential key dynamic drivers of the system, such as the increased preferences for fish due to admonitions to consume more fish, the growth in aquaculture, and potential fish stock changes due to climate change. Another important feature is that it would account for the global effects as well as the distribution of effects for different populations.
Previous Analyses
Previous work has examined the effects of increasing seafood consumption on various dimensions, both quantitatively and qualitatively. For example, the IOM report described above analyzed the scientific evidence for the nutritional benefits and safety risks from seafood (IOM, 2007). Also, Ginsberg and Toal (2009) identified a dose–response relationship for methyl mercury and omega-3 fatty acid effects on coronary heart disease and neurodevelopment. Other assessments have considered other dimensions of effects, in addition to health. Jenkins et al. (2009) looked at the evidence base for long-chain PUFA consumption; the decline of fish stocks; the global social and economic effects of the increasing demand for fish; fish farming and aquaculture and the constraints on its growth; contaminants in fish; and alternative sources of EPA and DHA. They concluded that there should be an assessment of the environmental impact of dietary guidelines to consume more fish before the guidance is issued, as is the case for other dietary recommendations. In the most comprehensive treatment of this issue, Oken and her colleagues (2012) concluded that information integrating the health, ecological, and economic impacts of different fish choices is lacking. Rice and Garcia (2011) reviewed projections to 2050 for global population growth and fish production that anticipates climate-related change and effects on biodiversity. They concluded that the projected 50 percent increase in fish production from both capture fisheries and intensive farming would be incompatible with the present proposed interventions to address pressure on marine biodiversity. This supports the need for consideration of the impact of climate change and population growth when providing recommendations about fish consumption and the necessity of putting emphasis on lower-intensity aquaculture systems (Diana et al., 2013).
New Analyses
For this example, an assessment team would select specific data sources, metrics, and methodologies for the analysis. Data sources could include
(1) self-reported NHANES data on consumption of oily fish (assuming it can be disaggregated); (2) monitoring data on methyl mercury from FDA, EPA, and mercury concentration databases in Karimi et al. (2012); (3) global data on wild caught and farmed salmon production from the Food and Agriculture Organization or other sources; and (4) simulated or actual data on biodiversity, climate change, and pollution levels in marine and freshwater systems.
A number of different methods already have been used to measure various effects. One of these is a model to carry out SIAs of fisheries (Pollnac et al., 2006). Another is a model of integrated risk/benefit analyses using dose–response relationships and secondary data analyses from individual studies of methyl mercury and omega-3 fatty acid levels in various kinds of fish (Rheinberger and Hammitt, 2012). Two other modeling schemes that seem particularly well adapted to a dynamic and complex fish system are agent-based modeling (ABM) and system dynamics modeling. ABM constructs artificial societies on computers, with agents placed in a spatial context with specified internal conditions and a set of adaptive rules that govern their interaction with each other and with the environment. There can be substantial diversity among actors (e.g., fishers, distributors, and fish eaters): interactions produce output at both the individual and aggregate system levels. Macro-level patterns and trends can be produced and the patterns (e.g., changes in fish consumption, marine biodiversity/fish stocks, and available fish protein) can be compared with data to calibrate the model. ABMs are particularly useful to explore policy questions (Hammond, 2009).
A system dynamics model uses three core components to examine effects: (1) increases or decreases in fish stocks over time; (2) flows, or the rates of change in the stock; and (3) feedback loops that connect stocks and flows over time and over spatial distances and that can incorporate changes in consumption and in recommended levels (Hammond, 2009).
Consideration of the health, environmental, social, and economic effects of fish recommendations also could lead to additional questions requiring further research and analysis. Some of the questions could include
- What other dietary patterns have or could have similar effects on health outcomes?
- Can the proposed benefits from fish consumption be achieved through supplements of EPA/DHA produced by algae or yeast?
- What amount of fish is needed to meet increased fish demand and still maintain healthy fish stocks?
- What balance of wild caught and aquaculture products would produce the optimal environmental outcomes?
- What are the implications of increased demand for fish, specifically the economic implications for populations of fish-exporting countries?
- What are the food security implications for populations that depend on fish as a major source of protein in the diet?
- How will climate change affect marine biodiversity and the productivity of wild caught and farmed fish stocks?
- How will international institutions mediate and develop policies that will reconcile the differences among multiple competing interests related to this difficult problem?
REFERENCES
AHA (American Heart Association). 2014. Fish 101. http://www.heart.org/HEARTORG/GettingHealthy/NutritionCenter/Fish-101_UCM_305986_Article.jsp (accessed December 30, 2014).
Bang, H. O., J. Dyerberg, and A. B. Nielsen. 1971. Plasma lipid and lipoprotein pattern in Greenlandic West-coast Eskimos. Lancet 1(7710):1143-1145.
BLS (Bureau of Labor Statistics). 2014. Occupational outlook handbook, 2014-15 edition, fishers and related workers. http://www.bls.gov/ooh/farming-fishing-and-forestry/fishers-and-related-fishing-workers.htm (accessed December 30, 2014).
CDC (Centers for Disease Control and Prevention). 2013. Surveillance for foodborne disease outbreaks—United States, 2009-2010. Morbidity and Mortality Weekly Report 62(3):41-47.
CDC/NIOSH (CDC/National Institute for Occupational Safety and Health). 2014. Commercial fishing safety. http://www.cdc.gov/niosh/topics/fishing/#fishus (accessed December 30, 2014).
Davies, T. D., and J. K. Baum. 2012. Extinction risk and overfishing: Reconciling conservation and fisheries perspectives on the status of marine fishes. Scientific Reports 2:561.
Diana, J. S., H. S. Egna, T. Chopin, M. S. Peterson, L. Cao, R. Pomeroy, M. Verdegem, W. T. Slack, M. G. Bondad-Reantaso, and F. Cabello. 2013. Responsible aquaculture in 2050: Valuing local conditions and human innovations will be key to success. BioScience 63(4):255-262.
FAO (Food and Agriculture Organization of the United Nations). 2012. The state of world fisheries and aquaculture 2012. Rome, Italy: FAO.
FAO. 2014. The state of world fisheries and aquaculture. Opportunities and challenges. Rome, Italy: FAO.
FDA/EPA (Food and Drug Administration/Environmental Protection Agency). 2004. What you need to know about mercury in fish and shellfish. http://water.epa.gov/scitech/swguidance/fishshellfish/outreach/advice_index.cfm (accessed December 30, 2014).
FDA/EPA. 2014. FDA and EPA issue updated draft advice for fish consumption/Advice encourages pregnant women and breastfeeding mothers to eat more fish that are lower in mercury. http://yosemite.epa.gov/opa/admpress.nsf/bd4379a92ceceeac8525735900400c27/b8edc480d8cfe29b85257cf20065f826!OpenDocument (accessed December 30, 2014).
Fodor, G. J., E. Helis, N. Yazdekhasti, and B. Vohnout. 2014. “Fishing” for the origins of the “Eskimos and heart disease” story. Facts or wishful thinking? A review. Canadian Journal of Cardiology 30(8):864-868.
Ginsberg, G. L., and B. F. Toal. 2009. Quantitative approach for incorporating methylmercury risks and omega-3 fatty acid benefits in developing species-specific fish consumption advice. Environmental Health Perspectives 117(2):267-275.
Hall, T. E., and S. M. Amberg. 2013. Factors influencing consumption of farmed seafood products in the Pacific Northwest. Appetite 66:1-9.
Hammond, R. A. 2009. Complex systems modeling for obesity research. Preventing Chronic Disease 6(3):A97.
Hollowed, A. B., M. Barange, R. J. Beamish, K. Brander, K. Cochrane, K. Drinkwater, M. G. G. Foreman, J. A. Hare, J. Holt, S. Ito, S. Kim, J. R. King, H. Loeng, B. R. MacKenzie, F. J. Mueter, T. A. Okey, M. A. Peck, V. I. Radchenko, J. C. Rice, M. J. Schirripa, Y. Yamanaka, and A. Yatsu, 2013. Projected impacts of climate change on marine fish and fisheries. ICES Journal of Marine Science 70(5):1023-1037.
IOM (Institute of Medicine). 2007. Seafood choices: Balancing benefits and risks. Washington, DC: The National Academies Press.
IPCC (Intergovernmental Panel on Climate Change). 2014. Fifth assessment report 2014. Climate change: Implications for fisheries and aquaculture. Cambridge, UK: IPCC.
Jenkins, D. J., J. L. Sievenpiper, D. Pauly, U. R. Sumaila, C. W. Kendall, and F. M. Mowat. 2009. Are dietary recommendations for the use of fish oils sustainable? Canadian Medical Association Journal 180(6):633-637.
Karagas, M. R., A. L. Choi, E. Oken, M. Horvat, R. Schoeny, E. Kamai, W. Cowell, P. Grandjean, and S. Korrick. 2012. Evidence on the human health effects of low-level methylmercury exposure. Environmental Health Perspectives 120(6):799-806.
Karimi, R., T. P. Fitzgerald, and N. S. Fisher. 2012. A quantitative synthesis of mercury in commercial seafood and implications for exposure in the United States. Environmental Health Perspectives 120(11):1512-1519.
Larsen, J., and J. M. Roney. 2013. Farmed fish production overtakes beef. Earth Policy Institute. http://www.earth-policy.org/plan_b_updates/2013/update114 (accessed December 30, 2014).
Lincoln, J. M., D. L. Lucas, R. W. McKibbin, C. C. Woodward, and J. E. Bevan. 2008. Reducing commercial fishing deck hazards with engineering solutions for winch design. Journal of Safety Research 39(2):231-235.
Newman, L., and A. Dale. 2009. Large footprints in a small world: Toward a macroeconomics of scale. Sustainability: Science, Practice, & Policy 5(1):9-19.
NFI (National Fisheries Institute). 2013. National Fisheries Institute. http://www.aboutseafood.com (accessed December 30, 2014).
Nielsen, S. J., B. K. Kit, Y. Aoki, and C. L. Ogden. 2014. Seafood consumption and blood mercury concentrations in adults aged >=20 y, 2007-2010. American Journal of Clinical Nutrition 99(5):1066-1070.
NOAA (National Oceanic and Atmospheric Administration). 2014. NOAA fisheries: Office of Aquaculture. http://www.nmfs.noaa.gov/aquaculture (accessed December 30, 2014).
NRC (National Research Council). 2000. Toxicological effects of methylmercury. Washington, DC: National Academy Press.
OECD/FAO (Organisation for Economic Co-operation and Development/FAO). 2013. Agricultural outlook 2013-2022. Paris, France, and Rome, Italy: OECD/FAO.
O’Keefe, J. H., Jr., and W. S. Harris. 2000. From Inuit to implementation: Omega-3 fatty acids come of age. Mayo Clinic Proceedings 75(6):607-614.
Oken, E., A. L. Choi, M. R. Karagas, K. Marien, C. M. Rheinberger, R. Schoeny, E. Sunderland, and S. Korrick. 2012. Which fish should I eat? Perspectives influencing fish consumption choices. Environmental Health Perspectives 120(6):790-798.
Papanikolaou, Y., J. Brooks, C. Reider, and V. L. Fulgoni, III. 2014. U.S. adults are not meeting recommended levels for fish and omega-3 fatty acid intake: Results of an analysis using observational data from NHANES 2003-2008. Nutrition Journal 13:31.
Pollnac, R. B., S. Abbott-Jamieson, C. Smith, M. L. Miller, P. M. Clay, and B. Oles. 2006. Toward a model for fisheries social impact assessment. Marine Fisheries Review 68(1-4):1-18.
Raatz, S. K., J. T. Silverstein, L. Jahns, and M. J. Picklo. 2013. Issues of fish consumption for cardiovascular disease risk reduction. Nutrients 5(4):1081-1097.
Rheinberger, C. M., and J. K. Hammitt. 2012. Risk trade-offs in fish consumption: A public health perspective. Environmental Science and Technology 46(22):12337-12346.
Rice, J. C., and S. M. Garcia. 2011. Fisheries, food security, climate change, and biodiversity: Characteristics of the sector and perspectives on emerging issues. ICES Journal of Marine Science 68:1343-1353.
Upton, H. F. 2010. Seafood safety: Background and issues. CRS Report for Congress. http://nationalaglawcenter.org/wp-content/uploads/assets/crs/RS22797.pdf (accessed December 30, 2014).
USDA and HHS (U.S. Department of Agriculture and U.S. Department of Health and Human Services). 2010. Dietary guidelines for Americans, 2010. Washington, DC: USDA and HHS.


