
The second session of the workshop provided an overview of multi-modal sensing and discussed some of the key challenges associated with various types of sensor data (such as image, video, lidar, hyperspectral, and stereo with motion) and their integration. Useful references for this session’s topics, as suggested by the workshop program committee, are Atrey et al., 2010, and Kunz and Singh, 2013. The session was chaired by Nicholas Makris (Massachusetts Institute of Technology). Presentations were made in this session by Dvora Hart (Northeast Fisheries Science Center), Jules Jaffe (University of California, San Diego), Nicholas Makris, and Fraser Dalgleish (Florida Atlantic University).
FISHERIES PERSPECTIVE OF MULTI-MODAL SENSING
Dvora Hart, Northeast Fisheries Science Center
Dvora Hart began by discussing conventional surveys that are conducted via traditional fishing gear. The resulting time series enables one to gauge trends, measure length, and obtain physical samples. She noted that single data points are not particularly helpful, as fish tend to aggregate; any single measurement gives little information about the number of individuals living throughout a region of interest because it can be too high or too low depending on whether an aggregated mass of fish is observed. Hart showed results from traditional surveys of two populations, Gulf of Maine cod and Georges Bank sea scallops. Two distinct trends have been
observed in those populations. The Gulf of Maine cod have been experiencing an exponential decay of their population. In contrast, the Georges Bank sea scallops are a recovering stock. A participant asked if the declining cod populations were likely due to warming of the ocean temperatures in that area, overfishing, or some other variable. Hart responded that overfishing was the primary cause; the cod population began its decline before the recent warming trends. She noted that while warming may not be the proximate cause of the cod’s decline, it can make the population more vulnerable to other stressors such as overfishing.
While conventional surveys provide information about population trends, they do not directly provide absolute size. Hart described how to estimate absolute size from catch (which can be counted) and natural mortality (which is approximately known). Total mortality can be estimated by comparing year-to-year data; fishing mortality is total mortality minus natural mortality; and catch is fishing mortality times fishable biomass—i.e., biomass is catch divided by fishing mortality rate. However, the estimate of natural mortality is highly uncertain and can vary in time, leading to a corresponding uncertainty in total mortality. Ironically, as fishing mortality rates approach natural mortality rates (a desired outcome), absolute biomass and fishing mortality estimates become even more uncertain. Hart emphasized the difficulty in obtaining accurate absolute scale, as well as its importance to fisheries stock assessment.
Advanced sensors, Hart explained, have the potential to provide a direct measurement of absolute scale. They also can be used in complex habitats, such as reefs, where trawling cannot be done, and are a non-lethal method of sampling. Hart provided an example from the Northeast Fisheries Science Center of the HabCam-towed camera system. This system covers a large area in a short amount of time (approximately 50,000 km2 in 3 weeks of ship time). More than 2 million images were collected per week using stereo cameras, a side-scan sonar, and a sensor package. The side-scan sonar observed evidence of fishing activity (such as dredging or bottom fishing), and aggregating those observations with other sensor data could be potentially very valuable, said Hart. About 150 paired tows with HabCam and dredging have been conducted in order to calibrate the dredge to an absolute scale. Hart noted that dredge surveys are estimated to have an efficiency of 40 percent in sand and 25 percent in gravel or other rough bottom conditions. HabCam can conduct full-scale resource surveys to track and observe fish populations, providing orders of magnitude more data than a conventional survey. Abundance and biomass are then modeled and estimated.
Hart then described the use of HabCam to determine the biomass of scallops. Six million photographs were taken by HabCam, and 1 percent of those photos were analyzed by hand. The manual annotation of images took about 5 weeks, and applying the models took another week. Hart emphasized that automation could significantly reduce both costs and labor.
Hart also described challenges associated with estimating finfish. A finfish is only present in 1 out of every 100 to 1,000 images (1 to 2 orders of magnitude less than the prevalence of scallops), so finding them manually can be very difficult; automation would thus be very useful for this task. She described a specific prototype study of yellowtail flounder. In a 2010 survey, more than 150,000 images were examined, in which a total of 250 yellowtail were observed. In 2012, more than 83,000 images were examined, in which only 19 yellowtail were observed—a 7-fold reduction in prevalence. (A sample image is shown in Figure 3.1.) Hart emphasized that in both instances the images were taken in a sandy area, the habitat preferred by yellowtail flounder—in other words, these densities are likely to be an upper bound. The decrease in population from 2010 to 2012 may be the result of temperature effects; increased bottom water temperatures may be causing populations to decline, said Hart.
Hart concluded by reiterating that absolute scale is difficult to obtain, particularly when fishing mortality is at an appropriately low level. However, advanced sensing technology can help in estimating absolute scale, and the automation of
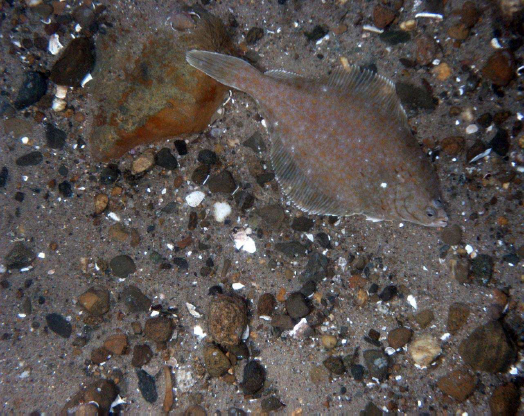
FIGURE 3.1 Image in which a yellowtail is observed. SOURCE: Courtesy of the HabCam Group.
image processing is critical to the analysis of large numbers of images. She clarified in a later discussion session that in the near future full automation is unlikely. However, she emphasized the importance of reducing the number of manual annotations required.
In a discussion session, a participant stated that many fish species are morphologically similar but exhibit different swimming and behavior patterns; he posited that behavior modeling could help in species identification. Large-scale movement patterns can also help with species identification. Another participant suggested that modeling the territorial behavior of fish might help avoid overcounting.
SYNERGISTIC ACOUSTIC AND OPTIC OBSERVATION AND ESTIMATION
Jules Jaffe, University of California, San Diego
Jules Jaffe explained that he was interested in observing different marine life using both acoustic and optic observations. He explained the general differences between acoustic and optic observation using the information in Table 3.1.
Jaffe explained that he used optics and acoustics to study euphausiids, mesopelagics, and diverse zooplankton in less than 500 m of water. The goals of the project are to obtain simultaneous target strength (i.e., the strength of the reflected sonar pulse, measured in decibels) and in situ identification, develop multibeam sonar systems, measure animal activity as a function of time of day, and monitor animal behavior. In the 1990s, Jaffe constructed a multibeam system for three-dimensional (3D) tracking of targets. Known as FishTV, the sonar system consisted of an 8-by-8 multibeam system, a source in the 400-500 kHz range, resolution on the order of 2 degrees by 2 degrees by 1 cm, with four images per second. Jaffe also described the Optical and Acoustical Submersible Imaging System (OASIS), which calibrated sonar with images. OASIS could identify targets as a function of body length, and it was used to study plankton as a function of size. OASIS observed size-dependent
TABLE 3.1 Comparisons Between Optic and Acoustic Observations of Marine Life
| Optics | Acoustics | |
| What is there? | Excellent | Poor; usually requires net tows or a priori knowledge |
| How much is there? | Size dependent: • small (<mm): good • large (>mm): poor |
Echo-counting: excellent Echo-integration: medium |
| What is it doing? | In situ behavioral observations never done | Can track some behavior |
migration patterns: smaller plankton would migrate to the surface first at night (De Robertis et al., 2000).
Jaffe also examined mesopelagics, noting that these are understudied. He explained that immature myctophids have an air bladder that reflects acoustic energy well; in adulthood, the animals do not retain the swim bladder, and their acoustic reflection profile is smaller as a result. Jaffe described an observing system called OmniCam used to study mesopelagic swarms seen via acoustic backscatter. OmniCam has six wide-angle cameras for full environmental coverage and simultaneously records video, light spectrum, 3D orientation, depth, and temperature.
Jaffe also described some more recent work in acousto-optic imaging of plankton. A Multiple-Aspect Acoustic Zooplankton (MA-ZOOPS) system was fitted with an optical imaging system (MA-ZOOPS-O) to combine acoustic reflectivity with optical imagery. The system first needed to be cross-calibrated and was then used to study marine snow1 reflectivity. Other work involves examining the target length and the duration of its acoustic reflectivity to obtain more information about the organism (Roberts et al., 2009).
REVEALING FISH POPULATION AND BEHAVIOR WITH OCEAN ACOUSTIC WAVEGUIDE REMOTE SENSING
Nicholas Makris, Massachusetts Institute of Technology
Nicholas Makris explained that Ocean Acoustic Waveguide Remote Sensing (OAWRS) is a technology that uses the ocean as a waveguide. The sound source is in the audible range (usually 400 to 2000 Hz), and sound waves are emitted at the source for about 1 second in pulses that repeat roughly every minute. The resulting images can be concatenated into a “movie” that goes on for hours. Makris explained that this technology can be used to identify fish populations over very wide areas and has found very large fish shoals containing hundreds of millions of fish (Makris et al., 2006, 2009). OAWRS provides horizontal information only; if vertical information is desired, OAWRS must be complemented with conventional echosounding technology. Also, OAWRS provides species information by spectral analysis, where resonant swim bladder response can be used to identify species remotely (Jagannathan et al., 2009; Gong et al., 2010; Jain et al., 2013). For ground truth species classification, Makris said, supplemental trawling and catching is required if other behavioral clues are not sufficient. Makris explained that heavy
__________________
1 Marine snow is a shower of organic material falling from upper layers of water to the deep ocean. For more information, see NOAA, “What Is Marine Snow?,” http://oceanservice.noaa.gov/facts/marinesnow.html, accessed July 9, 2014.
equipment is needed for both the acoustic source and the receiver, but the equipment is no more cumbersome than typical trawl gear.
Makris provided an example of acoustic surveys of the Mid-Atlantic Bight in 2003 (Makris et al., 2006) and the Gulf of Maine and Georges Bank in 2006 (Makris et al., 2009). These were fairly extensive efforts, similar to those used in typical trawl surveys, consisting of an OAWRS source ship, OAWRS receiver ship, and one or two ships using conventional echo sounding and trawl. (The OAWRS system has also been used from a single ship that also has conventional echo sounding.) Each of the studies discovered many large herring shoals not found using NOAA’s conventional techniques. The 2006 study determined that spawning herring shoals were forming overnight: during the day, fish would stay near the bottom, and near sunset they would start to develop small formations that would coalesce into a shoal. Once the shoal reached a critical size, it would quickly rise in population and extent to form vast shoals of more than 250 million fish. This is shown in Figure 3.2.
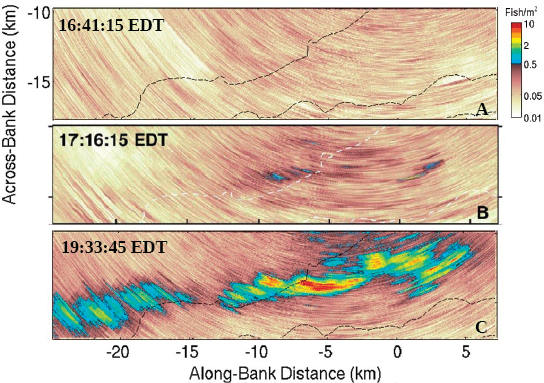
FIGURE 3.2 Critical population density of herring triggers rapid formation of a vast oceanic shoal. SOURCE: N.C. Makris, P. Ratilal, S. Jagannathan, Z. Gong, M. Andrews, I. Bertsatos, O.R. Godo, R. Nero, and J.M. Jech, 2009, Critical population density triggers rapid formation of vast oceanic fish shoals, Science 323:1734-1737. Reprinted with permission from AAAS.
Makris explained that OAWRS has also been used to conduct herring stock assessment by compiling images of shoals during a spawning period. The maximum population density values of each point each day were integrated, leading to an overall abundance estimate. This technique was applied to data from the Gulf of Maine, resulting in a population estimate consistent with NOAA’s estimates using other techniques. The data indicate that a single herring likely only goes through the shoaling process once before spawning, said Makris (Makris et al., 2009; Gong et al., 2010). OAWRS technology has also been applied to examine Atlantic cod in the Gulf of Maine. Cod shoals were only discovered in a 0.5 km region, which is very small relative to historic cod shoal regions (Jain et al., 2013). Makris also explained that computer vision can be used to estimate velocity fields from time-varying density images (Jagannathan et al., 2011). The velocity field shows how a shoal is moving.
During the discussion period, a participant pointed out that the session focused on ways optics could inform acoustics to identify targets and asked if the converse could be true: Are there ways in which acoustics could inform the classification of optical targets?
Several participants noted that, in general, acoustics can describe behavior on a larger scale and set the context, enabling the researcher to conduct finer-scale sampling. For instance, Makris pointed out that acoustics can inform where in the ocean would be the best location for an optical sensor. Another participant noted that while humans tend to explore with optics, light attenuates rapidly and can have limited function. In contrast, audible sound can travel nearly around the world, and long electromagnetic wavelengths can penetrate water.
SEAFLOOR LASER IMAGING TECHNIQUES
Fraser Dalgleish, Florida Atlantic University
Fraser Dalgleish explained that he pairs emerging laser technologies with spatially and temporally resolved methods of imaging. Dalgleish listed three rules to improve underwater imaging:
- Maximize photon density on each resolution element.
- Maximize sensing of resolution element photons.
- Minimize path radiance effects.
He explained that his systems are somewhat unconventional in that the laser source and receiver are located on different platforms.
Dalgleish first described the most common legacy system in laser-based imaging, known as the Laser Line Scanner (LLS), patented in 1973. LLS is a long-range
imaging system that has been successfully deployed on a variety of platforms, including helicopters, towed systems, and submersibles. Its range is 4 to 5 attenuation lengths, and it provides high contrast. However, it is physically very large (making its deployment expensive), has many moving parts, and has significant power requirements.
Dalgleish then described the multiple field of view (MFOV) prototype, which is a combination sonar/laser system. With no moving parts, MFOV has a compact design and can provide resolution of less than 0.5 cm in clear water at a depth of 9 m, which is sufficient for the identification of many benthic species.
He then showed results combining an LLS with a high-repetition rate pulsed laser (lidar) (Dalgleish et al., 2009, 2011; Dalgleish and Caimi, 2011; Caimi and Dalgleish, 2010). The lidar pulses 1 million times per second and scans 200 to 300 target lines per second. This is a smaller system in which the source and receiver are almost collocated, and backscatter is not a concern. A trial system was deployed in December 2013 that towed a source-receiver system at a depth of 70 m, about 11 m from the seafloor. The system was able to image objects on the seafloor at centimeter resolution. However, the laser uses a significant amount of power (up to 10 W); also, it is not eye-safe for humans and may not be eye-safe for marine life.
Other systems are being investigated that would not require such high levels of power. A simple solution, Dalgleish said, would be to move the laser source closer to the target; the swath size is sacrificed, but the common volume is reduced, minimizing path radiance effects. The detector can then be opened wider to allow for a larger angular field of view. With such a system, the distance from the target to the detector can increase to nearly 200 m in the open ocean. This is known as the distributed serial laser imaging concept. A prototype has been recently developed and built that uses low-power, eye-safe lasers and has more flexibility, as there is no need for alignment between the source and receiver. The prototype has been used in test conditions in a tank; in clear water, the receiver can be 11 m from the target, while the transmitter distance varies from 11 to 5 m. The prototype was also successfully deployed in the open ocean, under various realistic conditions. Dalgleish did note that many forms of marine life are attracted to the laser light, which can complicate the testing.
Dalgleish concluded by stating that serial laser imaging techniques offer improved image contrast and range of operation relative to cameras. Field tests have shown that distributed serial laser systems can provide images under a wide range of conditions with relatively simple, compact hardware. Future systems can be adaptive and used to track and identify targets and cover large scene volumes.


