4
Biology and Ecology of Yellowfin Tuna
DISTRIBUTION AND STOCK STRUCTURE
Yellowfin tuna are distributed worldwide in all warm seas except the Mediterranean (Cole, 1980). In the Pacific Ocean, their range extends from approximately 40° S to 40° N latitude. Temperature is an important determinant of the distribution of adults, particularly at the northern and southern limits of their range. Although yellowfin have been captured in waters as cold as 15° C and at least as warm as 31° C, commercial concentrations generally occur in waters between 20° and 30° C.
No distinct geographic break in distribution is evident across the Pacific. However, tagging studies indicate that it is unlikely that much intermingling of yellowfin occurs in the western, central, and eastern regions of the Pacific. Suzuki et al. (1978) postulate that there are three stocks of yellowfin tuna in the Pacific and possibly subpopulations within these stocks. Discriminant analysis applied to morphometric data from yellowfin collected from a number of locations in the ETP indicate that fish sampled north of 15° N to 20° N differ from those collected south of this region (Schaefer, 1989). Additional evidence for the existence of separate stocks within the ETP based on analysis of morphometric characters and gill raker counts is presented by IATTC (1989d). If there are indeed separate stocks, then management must focus on the stocks rather than on the species as a whole.
PHYSIOLOGY, GROWTH, AND LONGEVITY
Yellowfin possess a complex vascular network (rete mirabile) that acts as a countercurrent heat exchanger and allows them to maintain body tempera-
tures 1°–5° C higher than ambient water temperature. The adaptive significance of elevated body temperature and the ability to thermoregulate are incompletely known, although a number of hypotheses have been proposed (Cole, 1980).
Yellowfin are relatively short-lived and fast-growing compared with many species of fish. Age of yellowfin has been estimated by counting daily growth increments deposited on otoliths. This technique has been validated via tetracycline injection and a mark-recapture experiment for fish between 40 and 100 centimeters (cm) in length (Wild and Foreman, 1980). Although the aging method has not been validated for fish smaller than 10 cm or larger than 100 cm, circumstantial evidence suggests that the technique produces reasonable age estimates across the entire size range encountered in the ETP (Wild, 1986).
Yellowfin reach fork lengths (the distance from the snout to the fork of the tail) of approximately 40 cm at 1 year of age, 90 cm at 2 years, 120 cm at 3 years, and a maximum size of about 160 cm (Wild, 1986). Females are generally slightly larger than males between the ages of 1 and 2 years, but the pattern reverses at greater ages (Wild, 1986).
The sex ratio of yellowfin tuna is approximately 1:1 up to a length of approximately 140 cm, but thereafter the proportion of females captured in the fishery declines dramatically (IATTC, 1990a). Although the decline in females may be due to emigration from fishing areas or to a decrease in vulnerability to fishing gear, these possibilities appear unlikely because no large accumulations of females have been detected by surface or longline fleets. Wild (1986) postulated that an increase in natural mortality rate of females may account for the change in sex ratio with increasing size and further stated that the usual upper limit of female longevity in the ETP may be 3.5 years. In contrast, ages of males, as determined by Wild, ranged to just under 5 years.
ABUNDANCE AND SIZE STRUCTURE
A variety of techniques have been used to obtain estimates of absolute and relative abundance of yellowfin tuna in the ETP. An estimate of the absolute abundance of a species attempts to quantify the actual number or biomass of that species in a given area. The requirements for calculating such estimates for marine species are often impossible to fulfil, and so fishery biologists have developed and use estimates of relative abundance, which indicate the direction of changes in the size of a population rather than quantify its actual size. These estimates are simpler to calculate than absolute abundance and are correlated with it to give an idea of absolute abundance. Indices of relative abundance have been developed based on catch-per-day fished (with adjustments made for differences in fishing power among vessels) and catch-per-
hour of search time (IATTC, 1989b). Cohort analysis (which uses catch-at-age data obtained from samples taken in the fishery) provides estimates of absolute abundance. Although some differences occur in estimates of abundance produced by the three methods, trends in abundance during 1968–1988 are quite similar. Abundance of yellowfin was low during 1982–1983; it increased dramatically thereafter, reaching historically high levels, and showed a recent decline (though 1988 abundance estimates still exceed the earliest average abundance) (IATTC, 1989b). During this period, annual recruitment (i.e., the number of fish of a given generation that enter the fishery in a given year) has fluctuated by approximately a factor of three. No relationship between stock size and recruitment has been detected over the observed range of population sizes. Recruitment estimated for 1983–1988 has been above the long-term average.
The size distribution of yellowfin tuna varies among modes of capture. The size distribution of fish caught as school fish shows a slightly greater mode and a broader size range than those caught in association with floating objects, whereas yellowfin caught with dolphins are significantly larger, on average, than those caught by the other two methods. The spatial distribution of fishing effort also differs by fishing mode, season, and among years. Non-dolphin sets tend to occur closer to shore than dolphin sets do, and during some periods, non-dolphin sets occur in extremely localized near-shore areas, whereas dolphin sets tend to be more broadly distributed (see Figure 1-1 and Figure 1-2).
YIELD, POPULATION DYNAMICS, AND MANAGEMENT
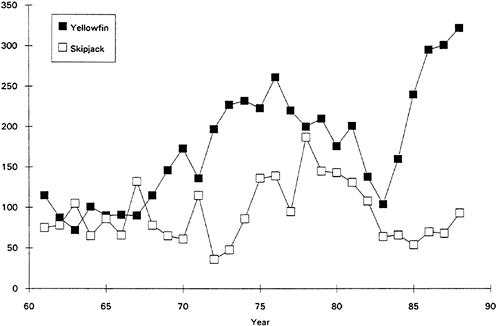
The management objective for yellowfin tuna in the ETP is to obtain the maximum sustainable yield. Although catch quotas were in effect in some areas during 1966–1979, no catch restrictions have been implemented since 1979 (IATTC, 1989b). Estimated yellowfin catch in 1988 was the greatest on record, both for the IATTC's Yellowfin Regulatory Area and the eastern Pacific Ocean as a whole. Figure 4-1 shows the yellowfin and skipjack catch for 1960–1988.
The yield potential of yellowfin tuna varies greatly, depending on the size distribution of fish captured. During 1977–1981, small, medium, and large fish were all well represented in the catch, whereas during 1985–1986 the catch consisted mostly of large fish (IATTC, 1989b). The estimated yield per recruit was approximately 24% greater in 1985–1986 than in 1977–1981 (IATTC, 1989b). In general, at catch levels near or above recent levels, yield per recruit decreases as the size distribution of yellowfin captured decreases (see Figure 77 , IATTC, 1989b).