Index
A
Abandoned wells, 22
Advanced Weather Information Processing System (AWIPS), 126
Age of water, 84
Agricultural management, 15, 124
in San Joaquin Valley, 151-152
technical assistance, 34-35, 163-164
see also Fertilizers;
Pesticides
Agricultural Research Service, 130
Agricultural Stabilization and Conservation Service (ASCS), 128, 130-131
Allocation of resources. See Resource allocation
American Congress on Surveying and Mapping, 106
Animal wastes, 14
Approaches. See Methods
Aquifer sensitivity assessment methods, 45
Artificial recharge wells, 18
Associative methods. See Statistical methods
Atrazine, 32
Attenuation Factor (AF), 68, 73-74, 176
Attribute databases, on soil, 117-119
Awareness. See Public education
B
Base data, 131
Bayesian methods, 68
Bias, 65
and water transport time, 2, 19, 43, 48
Bottled water, 14
Brine injection wells, 18
Bureau of Indian Affairs, 123
Bureau of Land Management, 123, 127
Bureau of Reclamation, 123
C
CALF, 58
See also San Joaquin Valley
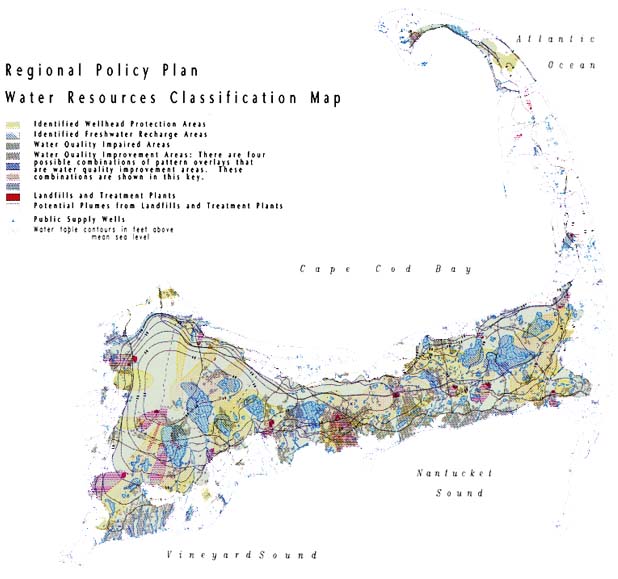
Cape Cod, Massachusetts, 9, 28, 35, 139-144, 165-166
Cartography. See Geographic information systems;
Maps and mapping;
Resolution;
Scales and scaling
Case studies
ground water vulnerability index for pesticides (GWVIP), 162-165
Cape cod, 139-144
Florida, 145-151
Hawaii, 156-161
Iowa, 135-138
San Joaquin Valley, 151-155
Cells and polygons, 7, 65, 67, 87, 91
and geostatistical methods, 62
in land use and cover mapping, 127
in processed-based models, 59
Censored data, 60
Centralized Database System (CDBS), 125-126
and sampling, 85
Cleanup and control of contamination, 4, 14, 31, 34
Climate, databases, 9, 91, 123-126, 182
Climatic Data Access Facility, 125-126
Compliance monitoring, 34
Computers and computing, 22, 39, 40
see also Geographic information systems;
Process-based simulation models
Concentrations of contaminants, 7, 19, 80
regulatory limits, 34
and sampling methods, 85-86
and statistical methods, 6, 45
Conceptual errors, 66
Conditions on site use, 34
Confidence intervals, and map cells, 7, 67, 77-78
Confinement over aquifers, 43, 48
Contaminant pathways. See Flow paths
Coordination among programs, 5, 39, 40
GIS facilitation of, 94
State and local, 108-109
weather data, 124-125
Counterintuitive situations, 11, 179
Coupled transport models, 6, 45, 53
Cross-contamination, 22
D
Data Base Analyzer and Parameter Estimator (DBAPE), 90-91
Data collection activity, 7, 9, 27, 38, 40, 65, 105
see also Monitoring activities and data
Data quality and availability, 2-3, 4-5, 8, 9, 26, 27, 90
and method selection, 37-38
and overlay and index methods, 5-6, 38, 48, 50, 51, 52
and process-based models, 6, 27, 37-38, 53, 56, 94, 105
processing and storage errors, 7, 66
and statistical methods, 6, 38, 45, 60, 63
uncertainties and errors, 3, 7, 20, 38, 63-66, 76-77, 104-105
see also Data collection activity;
Databases;
Monitoring activities and data
Databases, 2-3, 9, 32, 87, 104-105, 131-132, 174-175
agricultural management, 90, 129-131, 183
automation of, 108-109, 131, 174
federal coordination, 105-108
field assessments, 113, 120, 130-131
hydrogeologic, 2, 9, 63, 121-123, 177, 183
land use and cover, 2-3, 9, 126-129, 183
national assessments, 114, 120, 121, 174
soil properties, 2, 9, 90-91, 112-121, 177, 184
state and local, 108-109
see also Geographic information systems Decision making. See Land use management;
Policy analysis and development
Defense Mapping Agency, 110
Definitions
of soil, 113
Degradation, in situ measurement, 10, 175-176
see also Biodegradation
Delphi approach, 52
Depth to water table, 2, 42, 43.
in Iowa assessment, 9, 137-138
in overlay and index methods, 48, 49
in vulnerability definitions, 17
see also Flow paths
Deterministic models, 9, 57, 79
Development of ground water, 22
Iowa assessment, 136
Dibromochloropropane (DBCP), 14, 152, 157, 160, 161
Differential geographic assessment, 7, 8, 77-78, 96, 172
Differential management, 32, 172-173
EPA, 16
Digital Elevation Model (DEM), 110-112
Discharge limits, 34
Discharge zones, 21
identification of, 10, 50, 176
Discriminant analysis, 60, 61, 62
Dispersion, 19
Display of results. See Geographic information systems;
Maps and mapping
Distributions of contaminants, 6, 45
DRASTIC, 50, 51, 52, 53, 81, 84
in Florida, 145-146
in vulnerability definitions, 17
E
Education. See Public education
Elevation, 109, 110-112, 120, 126
Environmental Protection Agency (EPA), 16, 51
classification of methods, 44-45
Data Base Analyzer and Parameter Estimator, 90-91
databases, 130
Global Change Database Program, 126
National Pesticide Survey, 14, 81, 84
and President's Water Quality Initiative, 15
PRZM model, 52, 53, 55, 56, 70-72, 90
Error. See Uncertainty and error
Ethylene dibromide (EDB), 14, 147, 157, 161
Evaluation. See Testing and evaluation
Extension Service (ES), 130
F
Farm and Ranch Irrigation Survey, 130
Farms. See Agricultural management;
Fertilizers;
Pesticides
Federal Geographic Data Committee (FGDC), 9, 106-108, 174, 181
Federal government. See also Environmental Protection Agency;
U.S. Department of Agriculture;
U.S. Geologic Survey
water-level information, 48
Federal Information Processing Standard 173.
See Spatial Data Transfer Standard
Federal Interagency Coordination Committee on Digital Cartography (FICCDC), 106
use of process-based models, 53, 59, 78-79
First Law of Ground Water Vulnerability, 2, 18-19, 170-171
First-order uncertainty analysis (FOUA), 68, 69, 73-75, 77
Fish and Wildlife Service, 127
Florida, 9, 14, 28, 145-151, 166
See also Depth to water table
preferential, 3, 6, 11, 21-22, 58-59, 94-95, 177, 178
travel time, 10, 19, 39, 81, 137, 176
Flow system. See Depth to water table;
Discharge zones;
Flow paths;
Recharge rate;
Recharge zones
Fourier Amplitude Sensitivity Test (FAST), 71
Fractures, 18
G
Geochemistry, 84
Geographic Information Retrieval and Analysis System (GIRAS), 127
Geographic information systems (GIS), 8, 9, 11, 42, 87-90, 91, 175, 178
Hawaii use of, 157
Iowa use of, 138
and modeling, 92-94
and overlay and index methods, 45, 52, 94
uncertainty display, 9, 92, 175
Geographic variation, 38, 170, 173
and overlay and index methods, 5-6, 50
see also Differential geographic assessment;
Differential management
Geologic Society of America, 121-122
Georgia, 14
Geostatistical analyses, 60, 62-63, 65
Global Change Database Program, 126
Government. See Federal government;
Local government;
Planning agencies;
Regulation;
State government
Graphic display. See Geographic information systems;
Maps and mapping
Grid-cell based systems, 8, 87
Ground water Atlas of the United States, 121
Ground water vulnerability assessment methods, 45
Ground Water Vulnerability Index for Nitrates (GWVIN), 52
Ground Water Vulnerability Index for Pesticides (GWVIP), 15, 52, 162-165, 167
H
Hazardous waste disposal, 13
Historical Climate Network (HCN), 125
Horizontal (lateral) movement, 21, 50
Hybrid assessment methods, 11, 45, 60, 165, 167, 179
Hydraulic conductivity, 10, 90, 175
Hydrogeologic (physical) attributes, 37, 43-44.
See also Depth to water table;
Flow paths;
Recharge rate;
Soil properties;
Topography;
Unsaturated zone
and assessment methods, 45
databases, 2, 9, 63, 121-123, 177, 183
Florida, 145-146
Iowa, 137-138
and overlay and index methods, 2, 5-6, 19, 45, 48-53
and process-based models, 54-55, 56, 57
San Joaquin Valley, 152
and statistical methods, 61
in vulnerability definitions, 17, 18
Hydrologic study units (HSUs), 61
and scale, 23
I
Index methods, 2, 3, 5-6, 19, 45, 46, 48, 62, 95, 173
USDA hybrid approach, 10, 28, 165, 167
use in Florida, 9, 28, 150, 166
In situ measurements
Integrated assessments. See Hybrid assessment methods
Interagency Advisory Committee on Water Data, 106
International Standards Organization (ISO) 8211 standard, 107
Interpretation, errors in, 65
Intrinsic vulnerability, 3, 21, 84, 171
and assessment method design, 46-47, 48
in overlay and index methods, 52-53
Ionic composition, 84
Iowa, 9, 22, 35, 52, 135-138, 165
Irrigation, 13, 123, 124, 129, 130
Florida, 145
San Joaquin Valley, 151
J
K
L
Land owners, 33
voluntary behavior changes, 4, 31, 35
Land use and land cover (LULC) databases, 2-3, 9, 126-129, 183
Land use management, 4, 27, 31, 33-35, 40.
See also Agricultural management;
Land use and land cover databases
maps, 51
technical assistance, 34-35
Lateral transport. See Horizontal movement
Law of ground water vulnerability
Leaching of contaminants, factors in, 2, 42-43
Leaching Potential Index, 82-83
Linear regression, 62
Loadings of contaminants, 7-8, 51, 80, 81, 97
in vulnerability definitions, 17
Local differences. See Differential geographic assessment;
Differential management;
Geographic variation
Local government
data management, 9, 105, 109, 127
overlay and index methods use, 5, 45
M
Major Land Resource Area (MRLA), 114
and process-based models, 56
see also Agricultural management;
Data collection activity;
Differential management;
Land use decisions;
Policy analysis and development;
Program management;
Public education;
Regulation;
Resource allocation;
Zoning activity
Maps and mapping, 3, 32, 36-37, 131, 132.
in Cape Cod, 140-141
errors and uncertainty in, 7, 9, 37, 67, 75-76, 91-92, 96, 172, 175
in Florida, 149-150
geologic, 51
hydrogeologic, 121-123
technical supplementation, 37
water-level information, 48
zoning use, 34
see also Cells and polygons;
Geographic information systems;
Index methods;
Land use and land cover databases;
Overlay methods;
Resolution;
Scales and scaling;
Soil maps
Map Unit Interpretation Record (MUIR), 114, 119
Map Unit Use File (MUUF), 118-119
Mathematical models. See Process-based simulation models
Methods
selection of, 4, 5, 26-27, 35-40, 172, 173
see also Hybrid assessment methods;
Index methods;
Overlay methods;
Process-based simulation models;
Statistical methods;
Testing and evaluation;
Uncertainty
Microbial transformation. See Biodegradation
Models. See Digital Elevation Model;
Geographic information systems, and modeling;
Process-based simulation models
Monitoring activities and data, 28, 32, 34, 40, 81, 85-86
National Pesticide Survey, 14, 81, 84
and statistical methods, 6, 63
Monte Carlo techniques, 57, 70-72, 77
Multicounty assessments, 23, 37, 120
Multiple-phase transport models, 6, 43, 45
Multiple regression, 62
Multistate assessments, 23, 114, 120
Multivariate statistical techniques, 60, 62
N
National Agricultural Statistics Service (NASS), 130
National Climatic Data Center (NCDC), 125
National Cooperative Soil Survey (NCSS), 112
National Herbicide Use Database, 130
National Oceanic and Atmospheric Administration (NOAA)
National Climate Program regional centers, 125
and President's Water Quality Initiative, 15
National Park Service, 123
National Pesticide Survey, 14, 81, 84
National Resource Inventory (NRI), 115, 128, 129, 162-163
National Soil Characterization Database (NSCDB), 120
National Soil Geographic Database (NATSGO), 113, 115, 120
National spatial data infrastructure (NSDI), 106, 108, 131
National Water Quality Assessment Program, 164
National Weather Service (NWS), 123-126
N-dimensional queries, 93
Neighborhood analysis, 93
New York, 14
Next Generation Radar (NEXRAD), 126
travel times, 19
NLEAP, 118
Nonparametric statistical techniques, 61, 62
Nonpoint sources, 14
in vulnerability definitions, 1, 16, 18
North Carolina, 51
NSSAD/SIRS, 90
Numerical scoring. See Index methods
O
Oahu, Hawaii, 10, 156, 157, 158, 160, 161
Office of Management and Budget (OMB), 106
Official Soil Series Description (OSED), 119
One-dimensional transport models, 6, 28, 45, 53
Organic matter, 2, 42-43, 90, 113
Output. See also Maps and mapping;
Probability;
Uncertainty
errors in, 67
presentation of, 36-37
value of, 39
Overlay methods, 2, 3, 5-6, 22, 45, 46, 48, 62, 95, 173
use in Florida, 9, 28, 150, 166
use in Iowa, 9, 22, 28, 137-138, 165
Ownership. See Land owners
P
Permits, conditions on, 34
Personnel. See Staffing
Pesticide Information Network, 130
Pesticide Management Zones, 28
Pesticide Properties Database, 130
Pesticide-Root Zone Model. See PRZM
Pesticides, 14
databases, 130
in Hawaii, 10, 14, 157-161, 166
in Iowa, 136
process-based transport models, 53-56
in San Joaquin Valley, 9-10, 151-155, 166
voluntary restrictions, 35
in vulnerability definitions, 17, 18
vulnerability index (GWVIP), 15, 52, 162-165, 167
Pesticides and Ground-Water Strategy,
Pesticides in Ground Water Database, 130
Physical attributes. See Hydrogeologic attributes
Pipelines, 13
Planning agencies
overlay and index methods use, 5, 45
statistical methods use, 61
Point sources, 13-14
in vulnerability definitions, 1, 16, 18
Policy analysis and development, 4, 26-27, 30-32, 40
agricultural management, 164-165, 167
Florida, 147-148
Iowa, 136
Polygons. See Cells and polygons
in Florida, 145-146
in Hawaii, 156
Postaudit analyses, 78.79
Potential evaporation, 123, 124
databases, 2, 91, 123, 125, 126
Florida, 146
Preferential flow paths, 3, 11, 21-22, 94-95, 177, 178
and process-based models, 6, 58-59, 94-95
President's Water Quality Initiative, 15, 162, 164
Probability, 3, 6, 7, 8, 20, 80, 96-97, 171
in stochastic models, 57
Process-based simulation models, 2, 6, 19, 37, 45, 47, 48, 53-60, 94, 95, 173
Cape Cod use, 9, 28, 140-141, 166
data quality and availability, 6, 27, 37-38, 53, 56, 94, 105
hybrid methods, 10, 28, 165, 167, 179
and preferential flow paths, 6, 58-59, 94-95
Program management, 4, 31, 32-33
Protecting the Nation's Ground Water:
EPA's Strategy for the 1990s, 16
PRZM, 52, 53, 55, 56, 70-72, 90
Hawaii use of, 160
Pseudospecific vulnerability, 52-53
Public education, 4, 27, 31, 35, 40, 172
in Cape Cod assessment, 35
federal geographic data, 108
in Iowa assessment, 35, 136, 172
Florida, 145
Purging, 86
Purposeful placement, 1, 16, 18
R
Iowa assessment, 136
in overlay and index methods, 48, 49, 50
and uncertainty analysis, 73
Recharge zones, 20-21
identification of, 10, 50, 176
Reference location, 3, 20-21, 81, 97
in overlay and index methods, 46, 48, 50
used in selected methods, 46-47, 48
Regional Aquifer-System Analysis (RASA) program, 121
Regional assessments, 37, 50, 173
and process-based models, 53, 59-60
scales, 23
and statistical methods, 61
Regional Climate Centers (RCCs), 125
Regression analyses, 60, 61, 62
See also Screening of sites;
Zoning activity
California, 152-155
overlay and index methods use, 5, 45
statistical methods use, 5, 45
and uncertainty analysis, 75-77
and zoning activity, 34
Resource allocation, 4, 27, 31, 32-33, 40
and map displays, 36
programmatic, 39
Results. See Output
Retardation Factor (RF), 68, 73-75, 176
Risk, definition of, 17
Rivers, 13
Runoff, 109
Rural areas
pesticide residues in wells, 14
RUSTIC, 90
S
Safe Drinking Water Act, 35
Salt water intrusion, 18, 145, 156
Samples and sampling
compliance monitoring, 34
equipment, 39
limitations of, 84-86
San Joaquin Valley, California, 9-10, 151-155, 166
Saturated zone
hydraulic conductivity, 10, 175
Scales and scaling, 3, 20, 23-25, 28-29, 173, 174.
See also Resolution;
Time scales
digital terrain data, 110, 112
hydrogeologic maps, 121-123
land use and cover maps, 127
and overlay and index methods, 46, 48
and process-based models, 6, 47, 48, 58, 59-60, 105
of sample measurements, 10, 176
and statistical methods, 47, 60
variability in, 65
Screening of sites, 33-34
and process-based models, 56
Screens, monitoring, 85-86
Seasonal variation, 65
and overlay and index methods, 5-6, 48, 50
Second Law of Ground Water Vulnerability, 3, 20, 30, 170-171
Sedimentary basin brines, 2, 19
Selection of methods
and data quality, 37-38
institutional considerations, 5, 27, 39-40
technical considerations, 5, 27, 36-38
Sensitivity, definition of, 17, 18
Cape Cod, 139-140
Florida, 145
Simulation. See Process-based simulation models
Site selection, 31, 33-34, 56, 67-68
Site-specific databases
soil, 119-120
Site-specific simulation models
data requirements, 37
Size of assessment area, 37
SNOTEL, 125
Soil Classification File (SC), 119
Soil Conservation Service (SCS), 34, 123
Climatic Data Access Facility, 125-126
maps and mapping standards, 10, 51, 112, 121, 177
National Resource Inventory, 115, 128, 129, 162-163
Soil Interpretation Record (SIR), 117-118, 120
Soil loss, 92-93
Soil-Pesticide Interaction Screening
Procedure (SPISP), 162
Soil properties
combination with geologic information, 10, 176
databases, 2, 9, 90-91, 112-121, 177, 184
in overlay and index methods, 48, 49, 51
and process-based models, 37
in situ measurement, 10, 175, 177
in vulnerability definitions, 17
see also Soil maps
Soil Survey Geographic Database (SSURGO), 112-115, 120-121
Solution channels, 3, 21, 94-95
Sorption, 2, 19, 42-43, 48, 59, 176
Sources of pollution, 13-14.
See also Nonpoint sources;
Point sources
Spatial Data Transfer Standard, 106, 107, 174
Spatial databases, 8, 9, 20, 96.
See also Geographic information systems
Spatial scales. See Resolution;
Scales and scaling
Specific vulnerability, 3, 21, 171
and assessment method design, 46-47, 48
in overlay and index methods, 52
Specificity of contaminants, 3, 20, 21
Spills, 21
containment, 34
Standards
for geographic data, 9, 106-108, 174
for soil mapping, 10, 112, 177
State Geographic Systems Activities Compendium, 109
State government
data management, 9, 105, 108-109
monitoring activities, 28
overlay and index methods use, 5, 45, 52
and President's Water Quality Initiative, 15
vulnerability assessments, 16
water-level information, 48
weather data, 123
State-level assessments, 37
scales, 23
use of overlay methods, 51-52
State Management Plans (SMPs), 16
State Soil Geographic Database (STATSGO), 112-113, 114, 115, 120
Statistical methods, 2, 6, 19, 45, 47, 48, 60-63, 173
data quality and availability, 6, 38, 45, 60, 63
and uncertainty, 38, 60, 68, 95
Stochastic models, 9, 57, 68, 77
Surface impoundments, 13
Florida, 145
Surface water and discharge areas, 13, 21
T
Targeting of resources. See Resource allocation
Technical assistance, 34-35
Tennessee Valley Authority, 127
Terrain. See Topography
Testing and evaluation, 4, 7-8, 20, 26, 27, 42, 77-78, 80, 96, 97, 173-174
equipment, 39
field assessments, 7, 8, 78-79
of overlay and index methods, 52
regional assessments, 7-8, 78, 80-84
use of statistical tools, 45, 68
Third Law of Ground Water Vulnerability, 8, 96
Time scales, 3, 5, 20, 39, 65, 170.
See also Seasonal variation
and water travel, 10, 19, 39, 81, 137, 176
Time series methods, 60, 61, 65
Topography
Trace elements, 18
Transport of contaminants. See Depth to water table;
Flow paths;
Leaching of contaminants;
Process-based simulation models
Travel time to water table, 10, 19, 39, 81, 137, 176
Iowa assessment, 137
Trichloropropane, 161
Tritium, 84
Truncated data, 60
U
Uncertainty and error, 3, 7, 20, 26-27, 30, 38, 41, 42, 96-97, 170-171, 173
display of, 9, 11, 20, 37, 92, 96, 174-175, 178
in method application, 3, 20, 63, 77
in method execution, 3, 7, 20, 63-64, 66-67
in process-based models, 57-58
and statistical methods, 38, 60, 68, 95
Underground Injection Control Program, 51
Underground storage tanks, 13, 16
Universal Soil Loss Equation (USLE), 92-93
Unsaturated (vadose) zone, 2, 19, 42-43
characterization of, 10, 123, 176-177
hydraulic conductivity, 10, 175
in overlay and index methods, 48, 49, 50-51
solution channels in, 21
transport through, 2, 6, 43, 45
Urban areas, 124
U.S. Army Corps of Engineers
U.S. Department of Agriculture (USDA)
hybrid method use, 10, 28, 165, 167
President's Water Quality Initiative, 15, 162, 164
vulnerability index (GWVIP), 15, 52, 162-165, 167
see also Soil Conservation Service
U.S. Environmental Protection Agency. See Environmental Protection Agency
U.S. Geological Survey
National Water Quality Assessment Program, 164
RASA program, 121
U.S. Geological Survey (USGS)
maps, 51, 110, 121, 122, 127, 128
and President's Water Quality Initiative, 15
Uses of assessments, 4, 26, 27, 30-31, 40-41
constraints on, 4-5, 31, 35, 38, 40-41
institutional considerations, 39-40
technical considerations, 36-39
and uncertainty, 39
see also Educational outreach;
Land use management;
Policy analysis and development;
Program management
V
Vadose zone. See Unsaturated zone
Validation. See Testing and evaluation
Variation and variability. See Differential geographic assessment;
Differential management;
Geographic variation;
Seasonal variation
Verification. See Testing and evaluation
Voluntary activities, 4, 31, 35
Vulnerability index, 77-78, 162.
See also Ground Water Vulnerability Index for Pesticides
W
Watershed assessments, 37
Water table.
See also Depth to water table
as reference location, 3, 20-21
sampling near, 85-86
Weather, databases, 9, 91, 123-126, 182
Wells, 3, 10, 14, 18, 21, 22, 35, 81, 84, 97
in Florida assessment, 145, 148
in Iowa assessment, 9, 135-136
Z
Zoning activity, 33-34