
2
Levels and Trends in Adolescent Fertility
Measures of schooling, marriage, fertility, and contraceptive use are basic to the study of adolescent fertility. Taking data on such factors from the 11 sub-Saharan African countries for which recent Demographic and Health Survey (DHS) data are available, this chapter provides a broad overview of current levels of, and recent changes in, adolescent fertility.1 Subsequent chapters add more detail as related topics emerge.
LEVELS OF EDUCATION, SEXUAL EXPERIENCE, MARRIAGE, FERTILITY, AND CONTRACEPTIVE USE AMONG ADOLESCENTS
Beginning with current levels, Table 2-1 presents a summary of basic cross-national DHS data on educational attainment, sexual activity, marriage, and fertility among African women aged 15 to 19. The first three columns display information on education. Total school enrollments in sub-Saharan Africa rose at an average annual rate of 7.1 percent between 1960 and 1980 and of 4.6 percent between 1980 and 1983 (World Bank,
TABLE 2-1 Education, Sexual Activity, Marriage, and Fertility Among Women Aged 15–19, Selected Sub-Saharan African Countries: Percentage of Women Except as Noted
|
|
Education |
Fertility |
||||||
|
Country and Year of Survey |
Primary |
Secondary and Higher |
Sexually Experienced |
Ever Married |
At Least One Birth |
Currently Pregnant |
Birth Rate 15–19 (per thousand)a |
Births to Group as Percentage of all Birthsa |
|
Botswana, 1988 |
95 |
38 |
66 |
6 |
23 |
5 |
127 |
19 |
|
Burundi, 1987 |
26 |
1 |
9 |
7 |
3 |
3 |
52 |
5 |
|
Ghana, 1988 |
81 |
7 |
50 |
24 |
19 |
4 |
130 |
13 |
|
Kenya, 1988/1989 |
95 |
21 |
46 |
20 |
21 |
4 |
153 |
16 |
|
Liberia, 1986 |
63 |
22 |
82 |
36 |
37 |
8 |
188 |
20 |
|
Mali, 1987 |
24 |
0 |
76 |
75 |
44 |
6 |
209 |
17 |
|
Nigeria, 1990 |
67 |
34 |
55 |
39 |
23 |
5 |
144 |
16 |
|
Senegal, 1986 |
32 |
14 |
b |
44 |
26 |
4 |
161 |
18 |
|
Togo, 1988 |
63 |
16 |
64 |
27 |
21 |
5 |
129 |
15 |
|
Uganda, 1988/1989 |
79 |
12 |
62 |
41 |
30 |
7 |
186 |
20 |
|
Zimbabwe, 1988/1989 |
98 |
50 |
32 |
20 |
16 |
4 |
103 |
15 |
|
a Based on births in the four years before the survey. b Unmarried Senegalese women were not asked about sexual experience. SOURCE: Demographic and Health Surveys Standard Recode Files, weighted data. |
||||||||
1988). The expansion of education of young women was particularly rapid. Yet as the table shows, there is enormous variation across the region in levels of primary and secondary schooling among young women. In Kenya, Zimbabwe, and Botswana, 95 percent of women aged 15–19 had attended at least primary school, compared with fewer than one-third in Burundi, Mali, and Senegal. In Burundi and Mali, no more than 1 percent had attended secondary school.
In most countries, the DHS also asked women their age at first sexual intercourse. As Table 2-1 indicates, a large percentage of 15-to 19-year-old women are already sexually experienced, although again there is considerable variation across countries, from over 80 percent in Liberia to under 10 percent in Burundi. While the mean age at first marriage remains relatively low overall, in some countries a large proportion of young women appear to be sexually active before they marry. In Liberia, 36 percent of women aged 15–19 had married, but 82 percent of women in that age range acknowledged sexual experience. For countries like Liberia and Botswana, the age when a woman first marries may be an unreliable indicator of entry into regular sexual activity and exposure to the risk of pregnancy.2 For countries like Burundi and Mali, however, age at first marriage appears to be a highly accurate indicator of entry into sexual experience. Only 1 or 2 percent of women in these countries reported engaging in sex before marriage.
Because women in many countries marry so early and report early sexual experience, high rates of fertility among adolescents are not surprising. In
10 of the 11 countries listed, at least one in five women aged 15–19 had already had at least one child or was pregnant with her first child at the time of the survey. In those 10 countries the fertility rate ranged from 127 to 209 births per 1,000 women in their age group. Moreover, a large portion of all children are born to 15-to 19-year-olds. In Liberia, Mali, and Uganda, for example, these women accounted for around a fifth of all births in the four years preceding the survey dates.
Physiological readiness to conceive a child obviously influences when childbearing begins. According to Gyepi-Garbrah (1985a), age at menarche has declined more than one year since the early 1960s in Nigeria, and Adadevoh et al. (1989) indicate a similar decline in Ghana between 1946 and 1976. (See also Worthman and Whiting, 1987, for Kenya.) A question on age at first menstruation was included in the DHS only in Botswana, Burundi, and Senegal. (As with all survey data based on respondents' recall of events in the distant past, these data must be treated with caution.) The data from Burundi and Senegal do not reveal any decline in age at menarche over time, but in Botswana the reported age dropped from 16.2 years among women aged 40–49 to 15.3 years among 20- to 29-year-olds.
Table 2-2 focuses on another important aspect of the changing social context of fertility and reproduction in Africa: the rapidly rising knowledge and use of modern contraception. Women are almost certainly underreporting their knowledge and use of modern contraception (see, for example, Bleek, 1987). Still, the data show relatively high levels of knowledge among the youngest women, but far lower levels of usage. Among women of 15 to 19, reported knowledge of modern contraception, as well as of local sources for it, varies widely across the region. In Botswana, Kenya, and Zimbabwe, more than 75 percent of adolescents reported knowing about modern contraception, compared with only 29 percent in Mali. Not surprisingly, the young women who are most knowledgeable about contraceptives are those living in urban areas or in households with a radio or television, or those who have more education (calculations not shown). Knowledge of a source where modern contraceptives can be acquired manifests similar variations.
Although many young women know about contraception and some know where is can be acquired, they do not necessarily use it. Table 2-2 shows that with the exception of Botswana and Zimbabwe, few young women report ever using modern contraception, and very few were using it at the time of the survey. In Botswana and Zimbabwe one in five adolescents was using a modern method of contraception, primarily the pill. Elsewhere, 5 percent or fewer were using a modern contraceptive.
The reported lack of use of contraception, compared with the rest of the world, appears to reflect young women's strong desires to begin having children as soon as possible after marriage. Table 2-3 lends support to this thesis. It shows that in eight of the ten countries for which the comparison
TABLE 2-2 Knowledge and Use of Contraception Among Women Aged 15–19, Selected Sub-Saharan African Countries: Percentage of Group
|
|
Knowledge About Contraception |
Ever Use |
Current Use |
||||
|
Country |
Traditional Onlya |
Modernb |
Source of Modern |
Traditional Only |
Modern |
Traditional Only |
Modern |
|
Botswana |
0 |
94 |
93 |
2 |
37 |
1 |
21 |
|
Burundi |
3 |
40 |
36 |
14 |
4 |
5 |
2 |
|
Ghana |
2 |
57 |
48 |
13 |
12 |
9 |
3 |
|
Kenya |
4 |
76 |
73 |
20 |
9 |
10 |
4 |
|
Liberia |
1 |
63 |
63 |
4 |
13 |
1 |
5 |
|
Mali |
13 |
29 |
21 |
18 |
4 |
8 |
2 |
|
Nigeria |
1 |
39 |
29 |
4 |
4 |
4 |
2 |
|
Senegal |
20 |
59 |
58 |
11 |
1 |
5 |
1 |
|
Togo |
4 |
74 |
70 |
19 |
8 |
14 |
3 |
|
Uganda |
5 |
68 |
62 |
16 |
6 |
2 |
2 |
|
Zimbabwe |
1 |
88 |
80 |
8 |
3 |
4 |
22 |
|
a Traditional methods include abstinence, rhythm, withdrawal, and the use of ritual charms or potions. b Modern methods include pills, IUDs, injectables, condoms, vaginal methods, and male and female sterilization. SOURCE: Demographic and Health Surveys Standard Recode Files, weighted data. |
|||||||
TABLE 2-3 Current Use of Contraception Among Sexually Experienced Women Aged 15–19 by Marital Status, Selected Sub-Saharan African Countries: Percentage of Group
|
|
Modern Methoda |
Traditional Method Onlyb |
||
|
Country |
Currently Married |
Never Married |
Currently Married |
Never Married |
|
Botswana |
15 |
22 |
3 |
1 |
|
Burundi |
1 |
4 |
||
|
Ghana |
2 |
3 |
3 |
15 |
|
Kenya |
6 |
2 |
7 |
12 |
|
Liberia |
2 |
7 |
0 |
3 |
|
Mali |
1 |
8 |
||
|
Nigeria |
1 |
11 |
1 |
23 |
|
Senegal |
1 |
9 |
||
|
Togo |
2 |
7 |
3 |
17 |
|
Uganda |
1 |
3 |
1 |
5 |
|
Zimbabwe |
27 |
14 |
1 |
7 |
|
a Modern methods include pills, IUDs, injectables, condoms, vaginal methods, and male and female sterilization. b Traditional methods include abstinence, rhythm, withdrawal, and the use of ritual charms or potions. c Fewer than 25 cases. d Unmarried Senegalese women were not asked about sexual experience. SOURCE: Demographic and Health Surveys Standard Recode Files, weighted data. |
||||
can be made, a greater proportion of sexually experienced, never-married women than of married women use both traditional and modern contraception. The absolute percentages are not large; but they are remarkable inasmuch as social and economic barriers make it difficult for adolescents in general, and particularly unmarried ones, to obtain modern contraceptives. Another surprise is that large numbers of sexually active, unmarried adolescent women in Ghana, Kenya, Nigeria, and Togo are using traditional methods of contraception instead of modern methods. One explanation for this anomaly may be that many countries, trying to discourage promiscuity, heavily restrict the use of modern contraceptives by unmarried women. Another explanation may be that women who have barely begun their childbearing careers fear impairment of fertility from the potent drugs that they know Western contraceptives contain (for some evidence for this hypothesis from The Gambia, see Bledsoe et al., 1993).
In Chapter 1, we highlight two distinct configurations of adolescent fertility. The first comprises women who marry and give birth at extremely young ages, often in rural areas, away from adequate medical care. The
TABLE 2-4 Urban-Rural Differences in Education, Marriage, and Fertility, Women Aged 15–19: Percentage of Group Except as Noted
|
|
No Education |
Ever Married |
Birth Ratea |
|||
|
Country |
Urban |
Rural |
Urban |
Rural |
Urban |
Rural |
|
Botswana |
2 |
7 |
7 |
6 |
115 |
134 |
|
Burundi |
21b |
76 |
18b |
6 |
130b |
48 |
|
Ghana |
14 |
22 |
20 |
28 |
91 |
153 |
|
Kenya |
5 |
5 |
30 |
18 |
130 |
159 |
|
Liberia |
25 |
48 |
29 |
43 |
173 |
202 |
|
Mali |
43 |
90 |
74 |
76 |
172 |
224 |
|
Nigeria |
16 |
41 |
22 |
45 |
91 |
164 |
|
Senegal |
41 |
91 |
20 |
63 |
98 |
212 |
|
Togo |
18 |
51 |
11 |
39 |
72 |
169 |
|
Uganda |
12 |
22 |
32 |
42 |
139 |
194 |
|
Zimbabwe |
2 |
3 |
12 |
24 |
83 |
113 |
|
a Based on data from the four years before the survey. b Fewer than 50 cases. SOURCE: Demographic and Health Surveys Standard Recode Files, weighted data. |
||||||
second configuration consists of unmarried adolescents, often schoolgirls, living in urban areas whose pregnancies provoke condemnation. These women may be expelled from school, be forced into premature marriages, or face difficulty obtaining appropriate medical care. Table 2-4 highlights the differences in education, and in the timing of marriage and fertility, between urban and rural women. The table shows that in most countries, rural 15-to 19-year-old women are less likely than urban women to have attended school, but more likely to be married and to have given birth. In 10 of the 11 countries, the birth rate of women aged 15–19 is higher in rural areas than in urban areas.
But although Table 2-4 provides broad support for the urban-rural differences advanced in the two configurations, it dispels any conviction that the two configurations form two neat, mutually exclusive groups. In Mali, for example, nearly three quarters of urban women aged 15–19 have already married, a fact that undermines the assumption that only rural women marry at exceptionally young ages. Nor do urban women always surpass rural women in school achievement. In Zimbabwe over 95 percent of women living in rural areas have attended at least primary school.
Just as there are important differences in adolescent fertility between urban and rural areas, there are often large regional differences within countries. Nigeria is the most salient example. The most populous country in sub-Saharan Africa, Nigeria has over 350 ethnic groups and vastly different geographic and economic zones. Table 2-5 shows enormous differences in
TABLE 2-5 Regional Differences in Education, Marriage, Contraceptive Use, and Fertility of Women Aged 15–19 in Nigeria, 1990: Percentage of Group Except as Noted
|
|
Northeast |
Northwest |
Southeast |
Southwest |
Total |
|
Education |
|||||
|
No education |
66 |
66 |
10 |
4 |
29 |
|
Primary |
25 |
17 |
47 |
26 |
30 |
|
Secondary or more |
9 |
17 |
44 |
69 |
41 |
|
Marriage |
|||||
|
Ever married |
74 |
70 |
21 |
9 |
36 |
|
Contraceptive Use |
|||||
|
Any method of contraception |
4 |
3 |
8 |
15 |
9 |
|
Modern method |
3 |
3 |
4 |
8 |
5 |
|
Fertility |
|||||
|
Birth rate (per thousand) |
224 |
194 |
106 |
74 |
146 |
|
At least one birth |
40 |
41 |
14 |
8 |
22 |
|
Pregnant with first child |
11 |
6 |
3 |
2 |
5 |
|
Sample size |
352 |
308 |
570 |
381 |
1,612 |
|
SOURCE: Nigeria Demographic and Health Survey Standard Recode File, weighted data. |
|||||
education, marriage, contraceptive use, and fertility across the four principal regions. The Northeast and the Southwest represent the extremes. In the Northeast 66 percent of women aged 15–19 have never been to school, 74 percent are already married, and 51 percent are either already mothers or pregnant with their first child. In the Southwest, the other end of the spectrum, only 4 percent of young women have never been to school, only 9 percent have ever been married, and only 10 percent are mothers or are now pregnant with their first child.
TRENDS IN EDUCATION, MARRIAGE, AND FERTILITY AMONG ADOLESCENTS
How have educational attainment, marriage patterns, and fertility rates changed over time? The rest of the tables in this chapter document major trends in these variables for the 11 countries for which DHS data are now available. They reveal trends by comparing the adolescent experiences of each cohort of women between 20 and 39 years of age. Because the experiences of women who are currently 15 to 19 years old are incomplete, figures from this group are not included. Instead we use the reports of women aged 20–24 as a guide to the experiences of women who most recently
finished their teen years. Similarly, the percentage of women aged 30–34 will indicate the behavior of adolescents 10 to 15 years ago, and so on. We cannot, however, compare the knowledge and use of contraceptives in their youth of women now in middle age. These data were not collected in the DHS because middle-aged women cannot be expected to remember accurately how much they may have known about contraception or practiced it many years earlier.
We have ignored the responses of women over 40 for several reasons. First, these data rely on long periods of recall and are generally unreliable. In reconstructing birth histories, older women are prone to omit births that occurred long ago, especially if the child subsequently died. Furthermore, they tend to move forward the timing of the births so that they appear to have occurred more recently than was actually the case (Potter, 1977). Finally, because marriage in Africa is better viewed as a process rather than an event, we suspect that older women, more so than younger ones, may underreport premarital births because the unions 2 into which these children were born would have had more time to mature into recognized marriages.
Education
Formal education for women, particularly secondary education, is widely correlated with low female fertility and low child mortality in sub-Saharan Africa (Feachem et al., 1991; Cohen, 1993). Accordingly, trends in education likely have important bearing on adolescent fertility and its concomitants. Moving from the oldest five-year age group to the youngest in Table 2–6, we see that female schooling has increased over time in every country. However, the degrees of change vary widely. In some countries, a revolution in women's schooling has occurred over the past generation; others have seen only small changes. In secondary education, Zimbabwe has experienced the sharpest increase. Just 14 percent of the oldest women we studied, those from 35 to 39 years of age, attended secondary school, compared with 51 percent among women of 20 to 24. The rise in secondary school attainment is also substantial in Botswana, Kenya, Liberia, and Nigeria, especially in Ondo State in southwest Nigeria (data not shown). Several other countries have had less pronounced but still noticeable increases. Only in Burundi and Mali have fewer than 10 percent of the youngest women attended secondary school.
Marriage
In a recent analysis of the World Fertility Surveys (WFS) and the Demographic and Health Surveys, van de Walle (1993) found only limited evidence of a recent trend toward later age at first marriage. To the extent
TABLE 2-6 Percentage of All Women Aged 20 and Older, by Highest Level of School Attended
|
|
Age at Time of Survey |
|||
|
Country and Educational Level |
20–24 |
25–29 |
30–34 |
35–39 |
|
Botswana |
|
|
|
|
|
Primary |
49 |
46 |
45 |
53 |
|
Secondary+ |
36 |
25 |
20 |
12 |
|
Burundi |
|
|
|
|
|
Primary |
19 |
18 |
14 |
14 |
|
Secondary+ |
3 |
3 |
3 |
1 |
|
Ghana |
|
|
|
|
|
Primary |
60 |
53 |
53 |
43 |
|
Secondary+ |
10 |
11 |
7 |
5 |
|
Kenya |
|
|
|
|
|
Primary |
56 |
54 |
46 |
48 |
|
Secondary+ |
35 |
28 |
17 |
10 |
|
Liberia |
|
|
|
|
|
Primary |
21 |
12 |
10 |
6 |
|
Secondary+ |
31 |
20 |
16 |
10 |
|
Mali |
|
|
|
|
|
Primary |
16 |
17 |
14 |
6 |
|
Secondary+ |
2 |
2 |
2 |
1 |
|
Nigeria |
|
|
|
|
|
Primary |
27 |
24 |
22 |
20 |
|
Secondary+ |
31 |
22 |
8 |
7 |
|
Senegal |
|
|
|
|
|
Primary |
18 |
15 |
13 |
9 |
|
Secondary+ |
11 |
9 |
8 |
6 |
|
Togo |
|
|
|
|
|
Primary |
37 |
24 |
23 |
24 |
|
Secondary+ |
18 |
19 |
9 |
5 |
|
Uganda |
|
|
|
|
|
Primary |
56 |
52 |
48 |
38 |
|
Secondary+ |
14 |
10 |
9 |
9 |
|
Zimbabwe |
|
|
|
|
|
Primary |
42 |
62 |
65 |
69 |
|
Secondary+ |
51 |
20 |
17 |
14 |
|
SOURCE: Demographic and Health Surveys Standard Recode Files, weighted data. |
||||
that we can rely on data about marital status, as categorized in DHS, Table 2-7 shows that changes in reported ages at marriage have occurred more recently, and have been less dramatic, than changes in schooling. (We take conjugal unions, as the DHS did, to include both women reporting they were married and those reporting they were living with a man but not married.) In most countries, there was little difference in the proportion
TABLE 2-7 Percentage of All Respondents Aged 20 and Older Who Married Before Age 20, Selected Sub-Saharan African Countries
|
|
Age at Time of Survey |
|||
|
Country |
20–24 |
25–29 |
30–34 |
35–39 |
|
Botswana |
19 |
30 |
32 |
34 |
|
Burundi |
44 |
57 |
58 |
54 |
|
Ghana |
63 |
66 |
72 |
72 |
|
Kenya |
52 |
65 |
68 |
71 |
|
Liberia |
64 |
69 |
71 |
69 |
|
Mali |
92 |
90 |
93 |
92 |
|
Nigeria |
68 |
69 |
76 |
70 |
|
Senegal |
70 |
76 |
79 |
85 |
|
Togo |
63 |
69 |
71 |
66 |
|
Uganda |
73 |
74 |
79 |
80 |
|
Zimbabwe |
53 |
66 |
70 |
62 |
|
SOURCE: Demographic and Health Surveys Standard Recode Files, weighted data. |
||||
who had married before age 20 between women in their thirties and those in their forties at the time of the survey. But among women in their early twenties, the proportion reporting teenage marriages is lower almost everywhere. The changes have been greatest in Botswana, Kenya, and Zimbabwe. Changes are smaller but visible in all other countries except Mali. In all countries separate calculations indicate that marriage before age 20 is less common among those with more education. This finding suggests that education is largely incompatible with marriage.
We must be cautious in interpreting these DHS data on trends in age at marriage. As Chapter 3 explains, marriage in Africa is often less a discrete event than a process that develops over an extended period of time. Van de Walle (1993) highlights the difficulty in establishing the exact date a marriage begins, arguing that the apparent trend toward later age at first marriage could be exaggerated. Because conjugal relationships often develop gradually, a woman whose union endures may retrospectively report being married earlier than she would have if she had been asked at the time. Because first unions usually begin in the late teens, this response pattern would tend to exaggerate the distinctness of the women who currently form the youngest cohort.
Unlike retrospective DHS questions, census questions ask only current status. To supplement and check the DHS information, Table 2-8 examines trends in adolescent marriage for women aged 15–19 in sub-Saharan African countries by comparing census data for two points in time, whenever such data are available. In other cases, we were forced to use a less reliable
TABLE 2-8 Percentage of Women Aged 15–19 Who Were Ever Married, Selected African Countries, 1950–1985
|
|
|
|
Date and Source of Datab |
||
|
Subregion and Countrya |
First Census or Survey |
Second Census or Survey |
Average per Annum (percentage points) |
First Census or Survey |
Second Census or Survey |
|
Eastern Africa |
|||||
|
Burundi |
19 |
7 |
-1.6 |
1979 C |
1987 S |
|
Kenya |
45 |
29 |
-0.9 |
1962 C |
1979 C |
|
Mozambique |
35 |
52 |
0.6 |
1950 C |
1980 C |
|
Rwanda |
18 |
13 |
-0.4 |
1970 C |
1983 S |
|
Tanzania |
52 |
38 |
-1.3c |
1967 C |
1978 C |
|
Zambia |
42 |
32 |
0.9 |
1969 C |
1980 C |
|
Middle Africa |
|||||
|
Central African |
|||||
|
Republic |
58 |
47 |
-0.7 |
1959 S |
1975 C |
|
Congo |
58 |
26 |
-1.4 |
1960 S |
1984 C |
|
Southern Africa |
|||||
|
Botswana |
14 |
7 |
-0.6 |
1971 C |
1981 C |
|
Lesotho |
22 |
26 |
0.4 |
1966 C |
1977 C |
|
South Africa |
9 |
6 |
-0.1 |
1951 C |
1980 C |
|
Western Africa |
|||||
|
Benin |
67 |
46 |
-1.0 |
1961 S |
1982 S |
|
Ghana |
54 |
32 |
-2.0 |
1960 S |
1971 S |
|
Liberia |
57 |
42 |
-1.2 |
1962 C |
1974 C |
|
Mali |
79 |
75 |
-0.1 |
1960 S |
1987 C |
|
Senegal |
63 |
55 |
-0.4 |
1960 S |
1978 S |
|
Togo |
53 |
41 |
-1.0 |
1958 C |
1970 C |
|
NOTE: Includes only countries for which observations were available for at least two points in time. a For several countries, data were not available before 1970. b C or S next to the date indicates whether the data are from a census or a survey. c Data for mainland only. SOURCE: United Nations (1990:65). |
|||||
check on consistency: comparing census results with survey results (see van de Walle, 1993).
Despite problems of comparability between the sources, this table, like the DHS results, suggests that before 1970, the proportions of women aged 15–19 who were ever married at the time of the survey or census were quite high throughout the subcontinent. Only in Burundi, Rwanda, Botswana, and South Africa did fewer than 20 percent of women marry that young.
Fifty percent or more of adolescents were already married in Tanzania, Central African Republic, Congo, Benin, Ghana, Liberia, Mali, Senegal, and Togo. Western African countries generally had the highest proportions. In the 1970s and 1980s, increases in the reported ages at marriage could be detected in some countries. Mali still had a high proportion of adolescent marriages (75 percent), and three countries (Mozambique, Zambia, and Lesotho) recorded increases in the proportion of adolescent marriages. But most countries show declines in the proportions. These are most marked in Burundi, Tanzania, Congo, Benin, Ghana, and Liberia. If we can rely on the evidence presented in these last two tables, then, it indeed appears that the age at marriage has increased in many countries.
Fertility
Have these recent changes in schooling and marriage patterns affected the prevalence of teenage fertility? Three issues are important to the analysis that follows. One concerns childbearing itself. Because of the widespread trend toward more schooling and somewhat older ages at marriage, we might expect to find a decline in teenage childbearing. Table 2-9 shows such a change in six of the eleven countries, when fertility before age 20 for women aged 20–29 is compared with that for women of 30–39. The largest declines appear in Burundi, Kenya, and Zimbabwe. In two countries, Liberia
TABLE 2-9 Percentage of All Respondents Aged 20 and Older Who Have Given Birth Before Age 20, Selected Sub-Saharan African Countries
|
|
Age at Time of Survey |
|||
|
Country |
20–24 |
25–29 |
30–34 |
35–39 |
|
Botswana |
55 |
61 |
60 |
57 |
|
Burundi |
27 |
37 |
36 |
38 |
|
Ghana |
51 |
50 |
58 |
56 |
|
Kenya |
58 |
67 |
70 |
67 |
|
Liberia |
64 |
62 |
55 |
52 |
|
Mali |
67 |
61 |
64 |
59 |
|
Nigeria |
54 |
54 |
57 |
4 |
|
Senegal |
59 |
61 |
60 |
61 |
|
Togo |
56 |
58 |
64 |
55 |
|
Uganda |
68 |
68 |
72 |
73 |
|
Zimbabwe |
49 |
58 |
59 |
53 |
|
SOURCE: Demographic and Health Surveys Standard Recode Files, weighted data. |
||||
and Mali, teenage births increased, but the trend is erratic; moreover, for Liberia the quality of the data on birth history is poor (Arnold, 1990).
Trends in adolescent fertility do not necessarily indicate trends in conceptions. The DHS, however, asked only about children ever born. It avoided questions about abortions on the grounds that most women are reluctant to reveal this information and their answers would be unreliable. In Chapter 7, we discuss evidence from hospital records and other studies that suggest a rising incidence of abortions in Africa, especially in urban areas.
Aside from childbearing and abortion, the other standard topic in studies of adolescent fertility is premarital births. Declines in some populations across cohorts in proportions of both reported marriages and births to teens do not necessarily mean declines in premarital births. Have they, too, declined? The fluid nature of marriage in much of Africa makes it more complicated to sort out the sequencing of marriages and births. With these reservations, we use cross-sectional data to calculate two separate measures. The first measure we examine is the percentage of women who had a premarital birth by age 20 across various cohorts (see Table 2-10). Because dating the start of a marriage is difficult, for these calculations, we define a birth as premarital if it occurred one year before the reported age at first marriage. Using this criterion, we find only slight increases in women who give birth premaritally over the last 10 to 15 years.
Our second measure is the ratio of premarital births to all births to women under 20. Table 2-11 shows that in Botswana and Kenya, the percentages of all births to adolescents that occur before marriage have increased sharply. Modest increases in premarital births occurred in Liberia, Uganda, and Zimbabwe. In a third group of countries (Burundi, Ghana, Mali, Nigeria, Senegal, and Togo) premarital births rose little, if at all. Taken together, Tables 2-10 and 2-11 show slight increases in four countries in proportions of women giving birth premaritally, and more noticeable increases in five of the eleven DHS countries in proportions of premarital births.
These observed rises in proportions of premarital births are roughly paralleled by rises in ages at first marriage and in education. Whereas trying to calculate the extent of premarital sexual activity would be quite problematic, we assume that because young women who are attending school remain unmarried for a longer period, they are at risk of premarital sexual activity for a longer period of time. At the same time, the fact that women appear to be entering marriage at older ages implies that sexual activity among teenage women has probably not increased at all; indeed, it may well have declined in most countries. Still, the proportion of adolescents who have sexual intercourse before they marry probably has increased (Meekers, 1991); that is, younger women are less likely than older ones to have had
TABLE 2-10 Percentage of Women Aged 20–49 Who Had a Premarital Birth by Age 20, Selected Sub-Saharan African Countries
sex by age 15; but they are more likely to have had sex before marrying. In Ethiopia, a survey on sexual activity among urban youths reported that, even among unmarried women who reported that they were sexually experienced, 53 percent of women aged 15–19 and 44 percent of women aged 20–24 were not sexually active in the month prior to the survey (Manpower and Employment Department, 1991). And, in Banjul, The Gambia, the mean coital frequency in the past month among women aged 14–24 was 2.4 times for married women and 1.9 times for single women (Gambia Family Planning Association, 1988). Finally, a recent study on age at first sexual activity concluded that ''the trend in age at first sexual intercourse across cohorts [in African countries with DHS data] tends either to the flat or to show a slight increase'' (Blanc and Rutenberg, 1990:67).
Although the analysis so far has focused on differences among countries, we stress that countries differ internally as well, especially with respect to premarital births. Table 2-12 highlights some striking differences between urban and rural areas in the prevalence of premarital births. In
TABLE 2-11 Premarital Births as a Percentage of All Births to Women Under Age 20, Selected Sub-Saharan African Countries
|
|
Age at Time of Survey |
|||
|
Country |
20–24 |
25–29 |
30–34 |
35–39 |
|
Botswana |
77 |
62 |
61 |
57 |
|
Burundi |
6 |
1 |
5 |
1 |
|
Ghana |
9 |
6 |
8 |
6 |
|
Kenya |
27 |
21 |
16 |
14 |
|
Liberia |
28 |
18 |
18 |
18 |
|
Mali |
7 |
5 |
8 |
14 |
|
Nigeria |
6 |
7 |
9 |
8 |
|
Senegal |
8 |
8 |
7 |
6 |
|
Togo |
14 |
10 |
11 |
13 |
|
Uganda |
13 |
13 |
1 |
8 |
|
Zimbabwe |
14 |
12 |
9 |
13 |
|
SOURCE: Demographic and Health Surveys Standard Recode Files, weighted data. |
||||
TABLE 2-12 Premarital Births as a Percentage of All Births to Women Under Age 20, by Current Place of Residence, Selected Sub-Saharan African Countries
|
|
Age at Time of Survey |
|||
|
|
20–29 |
30–39 |
||
|
Country |
Urban |
Rural |
Urban |
Rural |
|
Botswana |
72 |
68 |
60 |
61 |
|
Burundi |
9 |
2 |
8 |
4 |
|
Ghana |
7 |
8 |
5 |
9 |
|
Kenya |
30 |
22 |
18 |
16 |
|
Liberia |
32 |
15 |
24 |
13 |
|
Mali |
6 |
6 |
4 |
9 |
|
Nigeria |
8 |
4 |
5 |
7 |
|
Senegal |
12 |
6 |
10 |
5 |
|
Togo |
17 |
10 |
17 |
9 |
|
Uganda |
23 |
12 |
22 |
10 |
|
Zimbabwe |
15 |
12 |
15 |
7 |
|
SOURCE: Demographic and Health Surveys Standard Recode Files, weighted data. |
||||
nine of the eleven countries, the proportion of premarital births to women now aged 20–29 was higher in urban areas than in rural areas. Furthermore, the proportion of premarital births rose over the decade in nine of the eleven urban areas, although in two countries the change was less than 2 percentage points. Furthermore, three countries, Botswana, Kenya, and Liberia, show big increases in both urban and rural areas.
PUTTING THE INDICATORS TOGETHER
The data and calculations we have reported here have shown substantial variation among countries in education, marriage, and early childbearing. No common pattern emerges. However, on the basis of the changes in the proportions of births that are premarital (Table 2-11), Table 2-13 identifies three groups of countries, each of which manifests broadly similar patterns of change over a decade, as evidenced by the difference in the results between women now aged 30–39 and women aged 20–29. We base the typology on trends in premarital births because such births indicate, however roughly, the changing social conditions under which entry into childbearing is occurring.
-
Group 1: Botswana and Kenya have experienced (1) marked rises in proportions of births to young women that are premarital by our definition, (2) dramatic increases in the proportions of women who have attended secondary school, and (3) indications of increasing age at marriage.
-
Group 2: Liberia, Uganda, and Zimbabwe show changes similar to those of Group 1, though generally not as marked.
-
Group 3: In Burundi, Ghana, Mali, Nigeria, Senegal, and Togo premarital adolescent childbearing has increased little, if at all, and only Nigeria and Togo have experienced marked increases in female education.
Charts for three countries—Kenya, Uganda, and Mali—are used to illustrate the relationships among the three principal variables for each group in turn.
Group 1
Figure 2-1 displays trends for Kenya in three indicators: percentage of women who married before age 20, attended secondary school, and had a first birth a year or more before their first conjugal union. The figure shows a clear increase in secondary school enrollment, accompanied by an increase in the proportion never married under age 20 and an increase in the proportion of women having premarital births. Botswana is distinctive among the 11 DHS countries because of its consistently low proportions of women marrying before age 20 and high proportions of premarital births to this group.
TABLE 2-13 Recent Changes in Education, Marriage, and Fertility, DHS Countries in Africa: Percentage Point Change Between Proportion of Women Aged 30-39 and of Women Aged 20–29
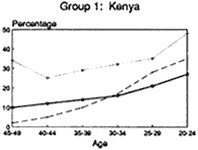
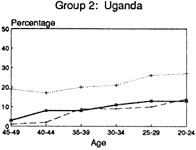

FIGURE 2-1 Trends in education, marriage, and fertility, selected sub-Saharan African countries.
The patterns for Group 1, then, are those of more schooling, delayed marriage, and higher proportions of premarital births. We stress once again that teenagers are not necessarily having more children; Kenya, in fact, has had a major decline in the proportion of first births before age 20 (see Table 2-9). But, among the births that do occur to adolescents, more are occurring outside of marriage. If there is a problem here, it arises not necessarily from increasing fertility; rather, it appears to stem from what society regards as mistimed births. (Chapters 3 and 4, however, provide some crucial qualifications for this generalization.)
The patterns manifested in Group 1 will sound familiar to contemporary Americans. Contrary to popular belief, the heart of the "teenage pregnancy problem" in the United States is not a rise in the number of births to teenagers. Indeed, American teenagers bear proportionally fewer children now than they did in the 1950s (Hayes, 1987). Because Americans in the 1950s married at earlier ages than they do now, most teenage births occurred to married couples. Consequently, these births were not considered a social problem. Today, although a smaller proportion of teenagers give birth to children, these teenage mothers are much less likely to be married
because of the rise in the average age of marriage and a decline in the stigma of bearing a child out of wedlock (Cherlin, 1988). Paradoxically, then, teenage childbearing has come to be seen as a social problem in the United States over a period in which rates of childbearing among adolescents have actually declined. In Africa, as well, teenage childbearing is coming to be defined as a problem only as the age at marriage is rising and overall fertility rates among young women are declining. Certainly, we are not suggesting that the Botswana and Kenya cases are like the American case in all respects. Still, some of the same forces may be operating both in the United States and in Africa.
Group 2
Countries in Group 2, represented in Figure 2-1 by Uganda, show patterns similar to those in Group 1. In two of the three countries in this group, Zimbabwe and Liberia, the proportion of women who attended secondary school expanded rapidly. With respect to age at marriage and especially premarital births, the trends are less pronounced. The proportion marrying in the teen years has declined somewhat, and the proportion of respondents who have had a premarital birth rose moderately. For Group 2, then, the changes are less marked than those in Group 1 countries, but the analogy with the United States still may be useful.
Group 3
The data from the remaining six countries do not suggest the emergence of the kind of adolescent fertility pattern experienced in the United States—or even in Kenya or Senegal. The proportion of premarital births changed little, a stability paralleled, on the whole, for most of the other indicators except education. In Mali teenage marriage remains extremely common, secondary schooling is still negligible, and the very low proportion of women having premarital births shows no clear trend. This pattern of socially approved early marriage and childbearing is by no means restricted to rural areas. In urban Mali, DHS data show that 70 percent of women in each cohort had been married by age 17, and close to 40 percent had given birth by that age.
Including Nigeria in this group—or in any group—is problematic, given its large, heterogeneous population. Nonetheless, the aggregate data show a substantial increase in secondary schooling and some decline in teenage marriage, but little change in the proportion of women having premarital births, a figure which was already low. These patterns reveal an important lesson: Increases in schooling are not necessarily associated with more premarital births.
CONCLUSION
The diverse paths that these countries have taken manifest enormous variability in patterns of formation of marital unions and childbearing by teenagers. Nevertheless, there are some broad similarities. In most countries, enrollment in secondary school increased and age at marriage rose. The figures presented here suggest that these changes have created a longer period during which adolescent girls are sexually mature yet unmarried and pursuing education, an activity their societies consider incompatible with motherhood. More important, in most countries we observe a rise in the proportion of births occurring before a woman's first marital union, especially in urban areas. In some countries these increases were small; elsewhere they were substantial. Although the African and Western situations differ in key respects, these premarital births could be as great a problem for African girls as they are for girls in the United States.


