
2
Prevalence, Costs, and Investments
Drug abuse has been called the nation's number one public health problem (Institute for Health Policy, 1993). One of every $12 of the nation's personal health care expenditures is spent on prevention, diagnosis, and treatment of people suffering from addictive diseases. Illicit drugs, such as opioids and stimulants, alcohol, and nicotine are responsible for debilitating illnesses and diseases, premature deaths, and the overburdening of the medical, social services, and criminal justice systems. This chapter provides a brief overview of the prevalence and measurable economic consequences of addictive drugs and the investments currently being made in research, prevention, treatment, and law enforcement.
PREVALENCE
During high school, almost every child in America confronts the choice of whether to use illicit drugs, drink alcohol, and smoke cigarettes, and many children take their first drug even before entering high school. Individuals who reach age 20 without having used marijuana, smoked cigarettes, or abused alcohol are unlikely ever to do so. The risk of cocaine use peaks between the ages of 21 and 24 and tapers off by age 30 (Chen and Kandel, 1995). Thus, drug addiction can be viewed as a pediatric disorder that becomes a major problem in late adolescence and early adulthood. As a result, many prevention efforts are aimed at early and experimental drug exposure. Although many people who occasionally
use illicit drugs, drink alcohol, or smoke do not experience problems, the risk of addiction increases with heavier or more frequent consumption.
Illicit Drugs
In 1995, the Substance Abuse and Mental Health Service Administration's (SAMHSA's) National Household Survey on Drug Abuse estimated that 12.8 million Americans used at least one illicit drug during the past month, constituting 6.1 percent of the population 12 years old or older—a dramatic decrease from 1979 when the number of current illicit drug users was at its highest level of 25 million or 14 percent of the population (SAMHSA, 1996a). Although the estimated number of users has remained at approximately the same level since 1992, rates of drug use show substantial variation by age with the greatest increases of use occurring among young people ages 16–20 (SAMHSA, 1996a) (see Figure 2.1). According to the 1996 National Institute on Drug Abuse's (NIDA) Monitoring the Future Study, 24.6 percent of high school seniors used at least one illicit drug in the past month—a slight increase since 1995 (23.8 percent), reflecting the continued rise in illicit drug use by teenagers since 1992 when the rate was at the lowest percentage of 14.4 (Johnston et al., 1997).
In regard to ethnicity, gender, geography, education, and employment, the rates of current illicit drug use in 1995 varied as follows (SAMHSA, 1996a):
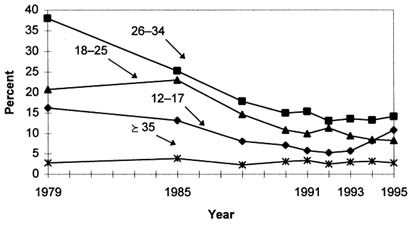
FIGURE 2.1 Past month illicit drug use by age: 1979–1995. SOURCE: SAMHSA (1996a).
-
Ethnicity—The rate of current illicit drug use for African Americans (7.9 percent) remained somewhat higher than for Caucasians, (6.0 percent) and Hispanics (5.1 percent). However, among youths (ages 12–17) the rates of use are about the same across the three groups. Most current illicit drug users (have used at least one illicit drug in the past month) are Caucasian representing 75 percent of all users (9.6 million); African Americans make up 15 percent (1.9 million), and Hispanics 8 percent (1.0 million). Although in selected age groups and with specific kinds of drugs there is an increased variability among different ethnic groups, the statistics rebut the prevailing racial stereotypes that minorities are the most prevalent users of illicit drugs. Among Native American populations, the survey literature of high school students indicates that, on average, rates of lifetime use and abuse of drugs, including alcohol, are higher among Native American than non-Native American youths (Libran and Smart, 1982; May, 1996; Winfree and Griffiths, 1985; Winfree et al., 1989). However, it is also noted that nonreservation Native American youths have higher rates of drug use compared to those living on reservations. These surveys present only averaged data from a variety of schools and locations and it is important to note that there is substantial variation among different Native American communities and tribal groups.
-
Gender—Men continue to have higher rates of current illicit drug use than women (7.8 percent vs. 4.5 percent).
-
Geography—Current illicit drug use rates ranged from 7.8 percent in the Western region of the United States to 4.9 in the Northeast; there was little difference in rates of use in large metropolitan areas, small metropolitan areas, and rural areas.
-
Education—Illicit drug use rates remain highly correlated with educational status; among 18- to 34-year-olds, those who had not completed high school had the highest rate of use (15.4 percent), while college graduates had the lowest (5.9 percent). However, lifetime prevalence rates (i.e., having tried illicit drugs at least once in their life) are equal regardless of educational status.
-
Employment—Current employment status is also highly correlated with rates of illicit drug use. In 1995, 14.3 percent of unemployed adults (age 18 and older) were current illicit drug users, compared to 5.5 percent of full-time employed adults. Seventy-one percent of all current illicit drug users age 18 and older (7.4 million adults) were employed, including 5.4 million full-time workers and 1.9 million part-time workers.
Alcohol
The number of Americans age 12 and older who had used alcohol in the past month was estimated at 111 million (52 percent of the population) in 1995. Of those 111 million, 32 million engaged in binge drinking (5 or more drinks on at least one occasion in the past month), including approximately 11 million who are considered heavy drinkers consuming 5 or more drinks per occasion on
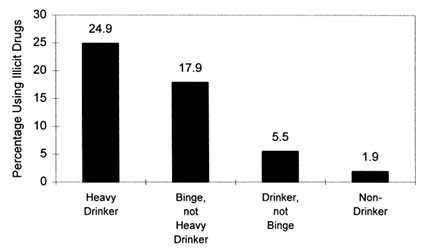
FIGURE 2.2 Past month illicit drug use, by past month alcohol use, age 12 and older, 1995. SOURCE: SAMHSA (1996a).
5 or more days in the past 30 days (SAMHSA, 1996a). Excessive alcohol consumption is responsible for more than 100,000 deaths per year in the United States (Doyle, 1996). Accidents—the fifth leading cause of death for all ages—accounted for 34.1 percent of all deaths, most due to drunk driving (Doyle, 1996; NCHS, 1996).
According to the National Household Survey on Drug Abuse, alcohol use may act as a gateway to using illicit drugs due to their strong association with each other. In 1995, 25 percent of the 11 million heavy drinkers were also current illicit drug users compared to only 1.9 percent of nondrinkers who reported having used illicit drugs in the past month (SAMHSA, 1996a) (see Figure 2.2).
In regard to age, ethnicity, gender, geography, and education, the rates of alcohol use in 1995 varied as follows (SAMHSA, 1996a):
-
Age—Of the 111 million Americans who currently use alcohol, 10 million were under the age of 21; 4.4 million were binge drinkers, including 1.7 million heavy users. Young adults ages 18–25 were the most likely to binge or drink heavily.
-
Ethnicity—Caucasians continue to have the highest rates of alcohol use at 56 percent, while rates for African Americans and Hispanics were 45 percent and 41 percent respectively. Binge use of alcohol was highest among Hispanics at 17.2 percent followed closely by Caucasians at 16.6 percent; African Americans had the lowest binge rate at 11.2 percent. Heavy use showed no statistically significant differences by ethnicity. Among adult Native Americans, studies show significant variations in prevalence of drinking from one tribal group to
-
another. These studies have concluded that adult prevalence of alcohol abuse is lower in some tribes than the average U.S. general population rate while other tribes exhibit similar or higher rates than U.S. averages (May, 1989; May and Smith, 1988; Welty et al., 1995; Whittaker, 1982).
-
Gender—Sixty percent of men were past month alcohol users while the figure for women was 45 percent; men were also much more likely than women to be binge drinkers (23.8 percent vs. 8.5 percent) and heavy drinkers (9.4 percent vs. 2.0 percent).
-
Geography—Rates of past month alcohol use were 56 percent in large metropolitan areas, 52 percent in small metropolitan areas, and 46 percent in nonmetropolitan areas; there was little variation in binge and heavy alcohol use rates among the areas.
-
Education—In contrast to the pattern for illicit drug use, the higher the educational level, the more likely was the current use of alcohol; in 1995, 68 percent of adults with college degrees were current drinkers compared to only 42 percent of those having less than a high school education. However, although the rate of binge drinking was similar across educational levels, 7.1 percent of adults who had not completed high school were heavy drinkers compared to 3.7 percent of adults who had completed college.
Nicotine
In 1995, 61 million Americans were current smokers, indicating a smoking rate of 29 percent for the population age 12 and older. An additional 6.9 million Americans were current users of smokeless tobacco (SAMHSA, 1996a). Current users of tobacco were more likely to be heavy drinkers and use illicit drugs compared to nonsmokers, thus highlighting the role of tobacco products as another gateway substance. In regard to age, ethnicity, gender, geography, and education, the rates varied in 1995 as follows (SAMHSA, 1996a):
-
Age—Almost 4.5 million youths ages 12-17 (20 percent) were current smokers in 1995; those who smoked were approximately 8 times more likely to use illicit drugs and 11 times more likely to drink heavily as nonsmoking youths. In spite of the demonstrated health risks associated with smoking, prevailence rates among young people remain high. Since 1975, cigarettes have consistly been the substance that the greatest number of high school students use on a daily basis (Johnston et al., 1997).
-
Ethnicity—No significant differences in smoking rates by ethnicity were established. Smokeless tobacco use, however, was more prevalent among Caucasians (3.9 percent) compared to African Americans or Hispanics (1.3 percent and 1.2 percent respectively).
-
Gender—Men had somewhat higher rates of smoking compared to women, while the rate of smokeless tobacco use was significantly higher for
-
men than for women (6.2 percent vs. 0.6 percent); over 90 percent of smokeless tobacco users were men in 1995.
-
Geography—Smoking rates were 27 percent in large metropolitan areas, 28 percent in small metropolitan areas, and 33 percent in nonmetropolitan areas.
-
Education—Thirty-seven percent of adults who had not completed high school smoked cigarettes compared to only 17 percent of college graduates.
Overall Trends in Illicit Drug, Alcohol, and Nicotine Use
Although the use among adults of addictive legal and illegal drugs has declined in recent years, there is no guarantee that these trends will continue. Smoking began to decline in the mid-1960s, illicit drug use in the late 1970s, and alcohol consumption in the mid-1980s. These declines may be attributed to increased awareness of the health risks of drug, alcohol, and nicotine use; more governmental involvement in prevention, intervention, and treatment efforts; and the development of a few grassroots efforts and coalitions (e.g., Mothers Against Drunk Driving, Americans for Nonsmokers' Rights) directed at reducing substance use and abuse and its negative consequences (Institute for Health Policy, 1993). Additional research on prevention and reduction of drug use, as well as continued tracking of drug use trends, is essential to maintaining and reducing the current levels of use.
TABLE 2.1 Trends in Past Month Use of Marijuana, Alcohol, and Cigarettes by 8th Graders, 10th Graders, and High School Seniors, 1992–1996
|
Drug and Age Group |
1992 |
1993 |
1994 |
1995 |
1996 |
|
Marijuana |
|||||
|
8th graders |
3.7 |
5.1 |
7.8 |
9.1 |
11.3 |
|
10th graders |
8.1 |
10.9 |
15.8 |
17.2 |
20.4 |
|
High school seniors |
11.9 |
15.5 |
19.0 |
21.2 |
21.9 |
|
Alcohol |
|||||
|
8th graders |
26.1 |
26.2 |
25.5 |
24.6 |
26.2 |
|
10th graders |
39.9 |
38.2 |
39.2 |
38.8 |
65.0 |
|
High school seniors |
51.3 |
51.0 |
50.1 |
51.3 |
50.8 |
|
Cigarettes |
|||||
|
8th graders |
15.5 |
16.7 |
18.6 |
19.1 |
21.0 |
|
10th graders |
21.5 |
24.7 |
25.4 |
27.9 |
30.4 |
|
High school seniors |
27.8 |
29.9 |
31.2 |
33.5 |
34.0 |
|
SOURCE: Johnston et al. (1997). |
|||||
Illicit drug and nicotine use among youth shows a different and worrisome pattern. The proportion of young people between the ages of 12 and 17 who used illicit drugs in the previous month decreased from a peak of 16 percent in 1979 to a low of 5 percent in 1992, but then doubled to 11 percent in 1995 (SAMHSA, 1996a). Rates of smoking have also increased recently among teenagers. Since 1992, the percentage of high school seniors who smoke (as reported in the past 30 days) has increased from 27.8 percent to 34 percent in 1996 (Johnston et al., 1997). Trends in past month use of marijuana, alcohol, and cigarette use for 8th and 10th graders, and high school seniors for 1992–1996 are shown in Table 2.1. Of special note is that despite the overall lower smoking rates among African-American youths, the rate of smoking among young African-American males has doubled in recent years, from 14 percent in 1991 to 28 percent in 1995 (MMWR, 1996).
ECONOMIC COSTS OF ADDICTION
Estimating the Cost of Drug Abuse in the United States
Individuals who use and abuse illicit drugs, alcohol, and cigarettes have disproportionately high use of medical services and impose large costs on the economy and on the legal and criminal justice systems. Many studies of illicit drug, alcohol, and nicotine addiction have estimated the costs to the United States for addiction to each of these drugs both individually and collectively (Berry and Bowland, 1977; Cruze et al., 1981; Harwood et al., 1984; MMWR, 1994; OTA, 1985; Rice, 1993; Rice et al., 1986, 1990, 1991a–c, 1992; Shultz et al., 1991a,b). Estimates vary as a result of different data sets, different assumptions, and different methods of calculation. In 1990, 1 it was estimated that the abuse of illicit drugs, alcohol, and nicotine cost society approximately $257 billion (see Table 2.2). The economic cost to society was measured in terms of the direct medical care expenditures for treatment of patients suffering from the adverse health effects of use of these drugs, indirect costs associated with loss of earnings due to reduced or lost productivity (morbidity) and premature death (mortality), and other related costs (i.e., nonhealth care costs such as those associated with the criminal and social welfare systems).
TABLE 2.2 Estimated Economic Costs of Illicit Drug, Alcohol, and Nicotine Abuse, 1990 (millions of dollars)
|
Type of Cost |
Illicit Drugs |
Alcohol |
Nicotine |
|
Total |
$66,873 |
$98,623 |
$91,269 |
|
Core Costs |
14,602 |
80,763 |
91,269 |
|
Direct |
3,197 |
10,512 |
39,130 |
|
Mental health/specialty organizations |
867 |
3,469 |
— |
|
Short stay hospitals |
1,889 |
4,589 |
21,072 |
|
Office-based physicians |
88 |
240 |
12,251 |
|
Other professional services |
32 |
329 |
—a |
|
Prescription drugs |
— |
— |
1,469 |
|
Nursing homes |
— |
1,095 |
3,858 |
|
Home health services |
— |
— |
480 |
|
Support costs |
321 |
790 |
— |
|
Indirect |
11,405 |
70,251 |
52,139 |
|
Morbidityb |
7,997 |
36,627 |
6,603 |
|
Mortalityc |
3,408 |
33,624 |
45,536 |
|
Other Related Costs |
45,989 |
15,771 |
— |
|
Direct |
18,043 |
10,436 |
— |
|
Crime |
18,035 |
5,807 |
— |
|
Motor vehicle crashes |
— |
3,876 |
— |
|
Fire destruction |
— |
633 |
— |
|
Social welfare administration |
8 |
120 |
— |
|
Indirect |
27,946 |
5,335 |
— |
|
Victims of crime |
1,042 |
576 |
— |
|
Incarceration |
7,813 |
4,759 |
— |
|
Crime careers |
19,091 |
— |
— |
|
AIDS |
6,282 |
— |
— |
|
Fetal alcohol syndrome |
— |
2,089 |
— |
|
NOTE: 1990 costs for illicit drugs and alcohol abuse are based on socioeconomic indexes applied to 1985 estimates (Rice et al., 1990). Cigarette direct smoking costs are deflated from 1993 direct cost estimates (MMWR, 1994) and cigarette indirect costs are from Rice (1992). a Amounts spent for other professional services are included in office-based physicians. b Value of goods and services lost by individuals unable to perform their usual activities because of drug abuse or unable to perform them at a level of full effectiveness (Rice et al., 1990). c Present value of future earnings lost, illicit drugs and alcohol discounted at 6 percent, nicotine discounted at 4 percent. SOURCE: MMWR (1994), Rice (1992, 1995 [personal communication]), Rice et al. (1990). |
|||
In 1990, the total economic cost estimates varied widely for each substance, with alcohol and nicotine inflicting the greatest direct and indirect costs (see Figure 2.3). Nicotine addiction comprised almost three-fourths (74 percent) of the total substance-related direct costs of $52.8 billion. Alcohol accounted for 20 percent, and illegal drugs for the remaining 6 percent. In regard to morbidity costs, alcohol constituted 72 percent of the $51 billion spent while nicotine made up 55 percent of the $82.6 billion spent on mortality costs. Illegal drugs made up 17 percent of the morbidity costs, 4 percent of the mortality costs, but 75 percent of the $61.8 billion for other related costs (other related costs are not available for nicotine).
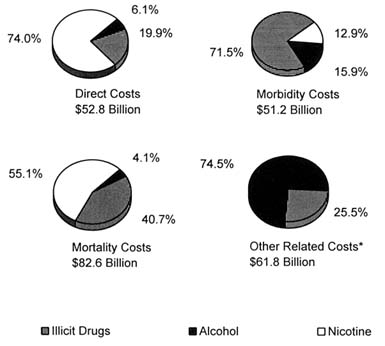
FIGURE 2.3 Economic costs of addiction by type of cost and drug, 1990.
*Estimates for nicotine were not available. SOURCES: IOM (1995) and Rice (1995).
|
BOX 2.1 Estimating the Cost of Drug Abuse in New York City The Center on Addiction and Substance Abuse at Columbia University (CASA) published a comprehensive study detailing how drug abuse and addiction in New York City cost more than $20 billion in 1994. They estimated $5.1 billion in health care; $4.9 billion in productivity lost from the city's economy; $4.1 billion in police, courts, prisons and the rest of the criminal justice system; $3.5 billion in public and private social services including welfare, food stamps, and foster care; $1.6 billion in increased insurance, security and workers' compensation costs to business; and $835 million in property costs. Only $735 million (3.7 percent) of the $20 billion was spent on treating drug abuse and addiction, and only $80 million (0.4 percent) was spent to prevent it; the vast majority of the $20 billion ($19.2 billion) paid for the consequences of the problem (CASA, 1996). The authors believe that the $20 billion estimate for the cost of drug abuse and addiction for New York City, although staggering, may be underestimated by 10 to 15 percent because of under-reporting in household surveys, unreported crimes, inadequate health records, and the inability to quantify education costs (CASA, 1996). |
An example of the impact of the high economic costs of drug abuse in one U.S. city (New York City) is described in Box 2.1.
Comparison of Drug Addiction Costs with Costs of Other Diseases
The total cost to society of alcohol, nicotine, and illicit drug abuse totaled $257 billion in 1990, which was higher than the costs of other highly prevalent and costly diseases, such as mental disorders, diabetes, heart disease, cancer, stroke, and AIDS (see Table 2.3). For example, total costs of mental disorders in 1990 were estimated to be $148 billion, diabetes costs were $137 billion (does not include other related costs), heart diseases costs were $133 billion (does not include other related costs), and cancer costs were $96 billion (does not include other related costs). It is important to note that the costs of heart diseases and cancer include the costs of persons who are treated or die as a result of nicotine-related illness, so there is overlap between these categories.
INVESTMENTS
Investing in research focused on the causes, prevention, and treatment of addictive behavior, as well as in training new researchers and clinicians participating in the field, ultimately enables society to adequately assist those addicted,
TABLE 2.3 Costs of Illness for Selected Diseases and Conditions (billions of dollars)
|
Disease |
Year |
Total |
Direct |
Indirect |
Other Relateda |
|
Drug Addiction, Total |
1990 |
256.8 |
52.8 |
133.8 |
61.8 |
|
Alcoholb |
1990 |
98.6 |
10.5 |
70.3 |
15.8 |
|
Illicit Drugsc |
1990 |
66.9 |
3.2 |
11.4 |
46.0 |
|
Nicotine |
1990 |
91.3 |
39.1 |
52.1 |
n/a |
|
(IOM, 1995; Rice, 1995) |
|||||
|
Mental Disorders, Totald |
1990 |
147.8 |
67.0 |
74.8 |
6.0 |
|
Anxiety disorders |
1990 |
46.5 |
10.7 |
35.4 |
0.4 |
|
Schizophrenia |
1990 |
32.5 |
17.3 |
12.0 |
3.2 |
|
Affective disorders |
1990 |
30.4 |
19.2 |
9.9 |
1.3 |
|
Other disorders |
1990 |
38.4 |
19.7 |
17.6 |
1.1 |
|
(Rice and Miller, 1996) |
|||||
|
Diabetes |
1992 |
137.1 |
91.1 |
46.6 |
n/a |
|
(Varmus, 1995) |
|||||
|
Heart Diseases |
1993 |
133.2 |
71.9 |
61.3 |
n/a |
|
(NHLBI, 1994) |
|||||
|
Cancer (all sites) |
1990 |
96.1 |
27.5 |
68.7 |
n/a |
|
(Varmus, 1995) |
|||||
|
Stroke |
1993 |
35.5 |
21.9 |
13.6 |
n/a |
|
(NHLBI, 1994) |
|||||
|
AIDS |
1992 |
n/a |
10.3 |
n/a |
n/a |
|
(Varmus, 1995) |
|||||
|
NOTE: 1990 is used as the base year because it is the most recent date for which the total costs to society of substance addiction and mental disorders have been estimated. For comparison, cost estimates for diabetes, heart diseases, cancer, stroke, and AIDS are based on the years listed closest to 1990. However, given that the cost estimates were calculated by different sources, the numbers may not be directly comparable and serve only to provide an overview of the estimated cost of each illness to society. It should also be noted that when other related costs are subtracted from the total for drug addition, the cost ($186.6 billion) still exceeds all other estimates. n/a = not available. a Other related costs include crime, victims of crime, incarceration, motor vehicle crashes, fire destruction, and social welfare administration. b Total includes costs of fetal alcohol syndrome (FAS). c Total includes costs of AIDS. d Includes costs of adverse health effects of drugs. SOURCES: IOM (1995), NHLBI (1994), Rice (1995), Rice and Miller (1996), and Varmus (1995). |
|||||
prevent abuse and dependence, and reduce adverse individual and social consequences and associated costs (IOM, 1996). Adverse health consequences of addiction to illicit drugs, alcohol, or nicotine include increased transmission of human immunodeficiency virus (HIV), tuberculosis, morbidity, and mortality due to accidents, fetal alcohol syndrome (FAS), cirrhosis, and cancer—all of which exact an enormous social and economic burden on society. The total overall cost of illicit drug, alcohol, and nicotine use and abuse is approximately $257 billion (in 1990) exceeding the annual estimated cost of cancer ($104 billion in 1997) and coronary heart disease ($91 billion in 1997) (AHA, 1997; ACS, 1997; Rice 1995).
The federal government plays a leading role in providing funding for research, prevention, treatment, and law enforcement. In 1996, the federal government spent $13.5 billion dollars on drug abuse, with $609.2 million (4.5 percent of the total) for research and development. In comparison, $9.0 billion (67 percent of the FY 1996 budget) was spent on criminal justice programs; $2.6 billion (19 percent) on treatment of drug abuse and $1.4 billion (10 percent) on prevention efforts (see Figure 2.4) (ONDCP, 1997).
In 1996, the National Institute on Drug Abuse (NIDA) and National Institute on Alcohol Abuse and Alcoholism (NIAAA) spent a total of $504 million on drug addiction research and $16 million on training of drug addiction researchers (NIH, 1997). However, in comparison, the National Heart, Lung, and Blood Institute spent $983 million for research and $48 million for training, and the National Cancer Institute spent $1.215 billion for cancer research and $39 million to train cancer researchers in 1995 alone. Against this discrepancy, both NIDA and NIAAA continue to expand their research efforts in providing a greater understanding of the problem of addiction and how addiction can be prevented and treated; total NIDA and NIAAA investment in research and training for 1996 represent a 52 percent and 38 percent increase over 1990 spending levels (see Table 2.4 and 2.5).
The Substance Abuse and Mental Health Services Administration (SAMHSA), which includes a Center for Substance Abuse Prevention (CSAP) and a Center for Substance Abuse Treatment (CSAT), was created by statute in 1992 to focus on services for addiction and training of practitioners and others (e.g., counselors, program administrators) involved in addiction rather than on research. As part of the National Institutes of Health, NIDA, NIAAA, and the National Institute of Mental Health focus entirely on research related to basic research, prevention, diagnosis, treatment, and health services research, as well as on the training of researchers and clinicians interested in doing addiction research. SAMHSA and its centers provide funding for demonstration projects to prevent and treat drug abuse, but these projects have not been rigorously evaluated. In FY 1995, CSAP provided $16 million for training in substance abuse prevention and CSAT provided $6 million for training in addiction treatment. However, the training focused on service providers, rather than training in research and evaluation (SAMHSA, 1996b). In 1996, SAMHSA developed the Knowledge Development and Application Program (KDA) to develop new
TABLE 2.4 NIDA Funding History (1988–1997): Research Training Grants, Research Grants, and Total Budget (thousands of dollars)
|
|
Research Training Grants |
Research Grants |
|||
|
Year |
Amount |
Percentage of Total |
Amount |
Percentage of Total |
Total Budget Amount |
|
1988 |
$2,298 |
1.5 |
$104,658 |
67.0 |
$156,252 |
|
1989 |
$2,371 |
1.0 |
$165,613 |
72.6 |
$228,131 |
|
1990 |
$3,805 |
1.2 |
$234,968 |
71.3 |
$329,560 |
|
1991 |
$6,808 |
1.8 |
$278,727 |
72.7 |
$383,656 |
|
1992 |
$7,122 |
1.8 |
$289,877 |
72.6 |
$399,100 |
|
1993 |
$7,370 |
1.8 |
$293,208 |
72.7 |
$403,065 |
|
1994 |
$8,325 |
2.0 |
$316,665 |
74.6 |
$424,315 |
|
1995 |
$9,308 |
2.1 |
$329,718 |
75.5 |
$436,726 |
|
1996 |
$10,700 |
2.3 |
$352,172 |
76.9 |
$458,231 |
|
1997 (est.) |
$11,700 |
2.4 |
$377,767 |
76.3 |
$494,960 |
|
SOURCES: GAO (1994), NIDA (1994), NIH (1997). |
|||||
TABLE 2.5 NIAAA Funding History (1988–1997): Research Training Grants, Research Grants, and Total Budget (thousands of dollars)
|
|
Research Training Grants |
Research Grants |
|||
|
Year |
Amount |
Percentage of Total |
Amount |
Percentage of Total |
Total Budget Amount |
|
1988 |
$2,590 |
2.8 |
$65,454 |
70.1 |
$92,763 |
|
1989 |
$2,796 |
2.3 |
$88,659 |
73.9 |
$120,051 |
|
1990 |
$3,587 |
2.4 |
$110,899 |
74.3 |
$149,194 |
|
1991 |
$3,548 |
2.2 |
$117,647 |
74.4 |
$158,141 |
|
1992 |
$3,606 |
2.1 |
$128,369 |
74.9 |
$171,481 |
|
1993 |
$3,614 |
2.1 |
$131,167 |
74.5 |
$176,128 |
|
1994 |
$5,029 |
2.7 |
$138,180 |
74.5 |
$185,538 |
|
1995 |
$5,235 |
2.7 |
$142,365 |
74.7 |
$190,548 |
|
1996 |
$5,405 |
2.7 |
$152,238 |
76.7 |
$198,480 |
|
1997 (est.) |
$5,803 |
2.7 |
$164,845 |
78.0 |
$211,254 |
|
SOURCES: NIAAA (1996) and NIH (1997). |
|||||
knowledge about ways to improve the prevention and treatment of substance abuse, and to work with state and local governments as well as providers, families, and consumers to apply that knowledge effectively in everyday practice. Outcome measures and evaluation are integral components to each grant program (SAMHSA, 1997).
The private sector devotes even less money than the federal government to any kind of addiction research, training, or treatment development. Although a few foundations support programs related to substance abuse prevention and health services research, most do not. However, a recent survey of foundations did find an encouraging trend; 342 foundations spent a total of $57 million in 1993–1994 to fund prevention programs and media projects (The Foundation Center, 1995). This figure compares favorably with a report which found that during the entire five-year period from 1983 to 1987, 337 foundations awarded a total of $87 million to alcohol and drug abuse programs (The Foundation Center, 1989).
The money spent on research, training, and treatment is, however, a small proportion of the money spent to fight drug abuse and addiction. For example, much of the federal commitment to fight drug addiction is spent on ''other related costs" through the Department of Justice, Treasury, Defense, and ONDCP, such as interdiction, intelligence, and incarceration. All of these strategies are important, but there is evidence that treatment is much more cost effective than the kinds of law enforcement efforts that receive most federal funds. According to a RAND study of strategies to decrease drug use, cocaine consumption would be reduced by 1 percent for every $34 million spent on treatment. By contrast, controlling the source of drugs is far more costly; for example, almost $400 million would have to be spent on interdiction to achieve the same 1 percent decrease (RAND, 1994).
The California Drug and Alcohol Treatment Assessment (CALDATA) survey also concluded that treating substance abuse is both effective and cost beneficial indicating a return of $7 for every one dollar invested. Although the cost of treating approximately 150,000 individuals in 1992 totaled more than $200 million, the benefits and returned savings received during treatment and in the year following treatment totaled approximately $1.5 billion. The greatest savings were due mostly to reductions in crime with significant improvements in health and corresponding reductions in hospitalizations (Gerstein et al., 1994).
CONCLUSION
Substance abuse is a prevalent problem affecting millions of Americans. Of particular concern is the growing use of illicit drugs, alcohol, and nicotine by young people. As a result of this growing public health problem, the measurable economic costs of drug addiction clearly are enormous, totaling $257 billion in 1990. However, investments in preventing drug abuse and addiction and in
treating addiction appear disproportionately low compared to the resources spent on interdiction and through the criminal justice system—even though there is evidence that treatment is more cost-effective. Resources devoted to research on the causes, prevention, and treatment of addiction are also low compared to the costs of other diseases such as cancer and coronary heart disease. Given the prevalence and cost of addiction, investments in research provide opportunities for understanding the initiation and development of addiction and how addiction can best be prevented and treated, thus, contributing to a decrease in the magnitude of the problem and the cost to society. In order to accomplish this goal, additional resources will be need to attract and train the "best and the brightest" as addiction researchers.
REFERENCES
ACS (American Cancer Society). 1997. Cancer Facts and Figures, 1997 [http://www.cancer.org/97/facts.html]. March.
AHA (American Heart Association). 1997. Cardiovascular Disease and Economics [http//:www.amhrt.org/1997/stats]. March.
Berry RE, Bowland JP. 1977. The Economic Costs of Alcohol Abuse. New York: Free Press.
CASA (Center on Addiction and Substance Abuse at Columbia University). 1996. Substance Abuse and Urban America: Its Impact on an American City, New York . New York: Center on Addiction and Substance Abuse at Columbia University.
Chen K, Kandel DB. 1995. The natural history of drug use from adolescence to the mid-thirties in a general population sample. American Journal of Public Health 85(1):41–47.
Cruze AM, Harwood JH, Kristiansen PL, Collins JJ, Jones DC. 1981. Economic Costs to Society of Alcohol and Drug Abuse and Mental Illness, 1977. Vols. 1 and 2. Report RTI/1923/00-14F. Research Triangle Park, NC: Research Triangle Institute.
Doyle R. 1996. Deaths due to alcohol. Scientific American 275(6):30-31. December.
The Foundation Center. 1989. Alcohol and Drug Abuse Funding: An Analysis of Foundation Grants 1983–1987. New York: The Foundation Center.
The Foundation Center. 1995. Grants for Alcohol and Drug Abuse 1995–1996 . New York: The Foundation Center.
GAO (General Accounting Office). 1994. Drug Abuse Research: Federal Funding and Future Needs. Gaithersburg, MD: U.S. General Accounting Office.
Gerstein DR, Johnson RA, Harwood HJ, Fountain D, Suter N, Malloy K. 1994. Evaluating Recovery Services: The California Drug and Alchol Treatment Assessment (CALDATA)—General Report. Sacramento, CA: California Department of Drug and Alcohol Programs.
Harwood HJ, Napolitano DM, Kristiansen PL, Collins JJ. 1984. Economic Costs to Society of Alcohol and Drug Abuse and Mental Illness, 1980 . Report RTI/2734/00-01 FR. Research Triangle Park, NC: Research Triangle Institute.
Institute for Health Policy, Brandeis University. 1993. Substance Abuse: The Nation's Number One Health Problem, Key Indicators for Policy. Prepared for the Robert Wood Johnson Foundation, Princeton, NJ. October.
IOM (Institute of Medicine). 1995. The Development of Medications for the Treatment of Opiate and Cocaine Abuse: Issues for the Government and Private Sector. Washington, DC: National Academy Press.
IOM. 1996. Pathways of Addiction. Washington, DC: National Academy Press.
Johnston LD, O'Malley PM, Bachman JG. 1997. National Survey Results on Drug Use from the Monitoring the Future Study, 1975–1996. Ann Arbor, MI: Institute for Social Research, University of Michigan.
Libran CB, Smart RG. 1982. Drinking and drug use among Ontario Indian students. Drug and Alcohol Dependence 9:161–171.
May PA. 1989. Alcohol abuse and alcoholism among American Indians: An overview. In: Watts TD, Wright R, eds. Alcoholism in Minority Populations. Springfield, IL: Charles C. Thomas. Pp. 95–119.
May PA. 1996. Overview of alcohol abuse epidemiology for American Indian populations. In: Sandefur GD, Rundfuss RR, Cohen B, eds. Changing Numbers, Changing Needs: American Indian Demography and Public Health . Washington, DC: National Academy Press. Pp. 235–261.
May PA, Smith MB. 1988. Some Navajo Indian opinions about alcohol abuse and prohibition: A survey and recommendations for policy. Journal of Studies on Alcohol 49:324–334.
MMWR (Morbidity and Mortality Weekly Report). 1994. Medical-care expenditures attributable to cigarette smoking—United States, 1993. Morbidity and Mortality Weekly Report 43(26):469–472.
MMWR. 1996. Tobacco use and usual source of cigarettes among high school students—United States, 1995. Morbidity and Mortality Weekly Report 45(20):413–418.
NCHS (National Center for Health Statistics). 1996. Health, United States, 1995. Hyattsville, MD: Public Health Service, U.S. Department of Health and Human Services.
NHLBI (National Heart, Lung, and Blood Institute). 1994. Morbidity and Mortality: Chartbook on Cardiovascular, Lung, and Blood Diseases . Washington, DC: National Institutes of Health, Public Health Service, U.S. Department of Health and Human Services.
NIAAA (National Institute on Alcohol Abuse and Alcoholism). 1996. Research for IOM Committee on Raising the Profile of Drug Abuse and Alcoholism Research. Rockville, MD: National Institute on Alcohol Abuse and Alcoholism.
NIDA (National Institute on Drug Abuse). 1994. National Institute on Drug Abuse 1995 Budget Estimate. Rockville, MD: National Institute on Drug Abuse.
NIH (National Institutes of Health). 1997. Personal communication with Robert Feaga, Office of Financial Management. May 27.
ONDCP (Office of National Drug Control Policy). 1997. III. Drug Control Funding Tables [http://www.ncjrs.org/htm/tables.htm]. April 9.
OTA (Office of Technology Assessment). 1985. Smoking-Related Deaths and Financial Costs. Washington, DC: OTA Staff Memorandum, Health Program, U.S. Congress.
RAND. 1994. Controlling Cocaine: Supply Versus Demand Programs. Santa Monica, CA: RAND Publications.
Rice DP. 1993. The economic cost of alcohol abuse and alcohol dependence: 1990. Alcohol Health and Research World 45(1):61–67.
Rice DP. 1995. Personal communication to the Institute of Medicine. University of California at San Francisco. February.
Rice DP, Miller LS. 1996. Health Economics and Cost Implications of Anxiety and Other Mental Disorders in the United States. Presented at Satellite Symposium: X World Congress of Psychiatry. Madrid, Spain. August 25. Unpublished.
Rice DP, Hodgson TA, Sinsheimer P, Browner W, Kopstein AN. 1986. The economic costs of the health effects of smoking, 1984. The Milbank Quarterly 64(4):489–547.
Rice DP, Kelman S, Dunmeyer S. 1990. The Economic Costs of Alcohol and Drug Abuse, and Mental Illness: 1985. DHHS Publication No. (ADM) 90-1694. Washington, DC: Report submitted to the Office of Financing and Coverage Policy of the Alcohol, Drug Abuse, and Mental Health Administration, U.S. Department of Health and Human Services.
Rice DP, Kelman S, Miller LS. 1991a. Economic costs of drug abuse. In: Cartwright WS, Kaple JM, eds. Economic Costs, Cost-Effectiveness, Financing and Community-Based Drug Treatment. NIDA Research Monograph 113. Rockville, MD: National Institute on Drug Abuse. Pp. 10–32.
Rice DP, Kelman S, Miller LS. 1991b. Estimates of the economic costs of alcohol and drug abuse and mental illness, 1985 and 1988. Public Health Reports 106(3):281–292.
Rice DP, Kelman S, Miller L. 1991c. The economic costs of alcoholism. Alcohol Health and Research World 15(4):307–316.
Rice DP, Max W, Novotny T, Shultz J, Hodgson T. 1992. The Cost of Smoking Revisited: Preliminary Estimates. Paper presented at the American Public Health Association Annual Meeting. Washington, DC. November 23. Unpublished.
Shultz JM, Novotny TE, Rice DP. 1991a. Quantifying the disease impact of cigarette smoking with SAMMEC II software. Public Health Reports 106(3):326–333.
Shultz JM, Rice DP, Parker DL, Goodman RA, Stroh G, Chalmers N. 1991b. Quantifying the disease impact of alcohol use and misuse with ARDI software. Public Health Reports 106(4):443–450.
SAMHSA (Substance Abuse and Mental Health Services Administration). 1996a. Preliminary Estimates from the 1995 National Household Survey on Drug Abuse. Advance Report No. 18. Rockville, MD: Office of Applied Studies, Substance Abuse and Mental Health Services Administration. August.
SAMHSA. 1996b. Personal communication to the Institute of Medicine. Center for Substance Abuse Prevention. August.
SAMHSA. 1997. SAMHSA Funding Opportunities [http://www.samhsa.gov/grant]. March.
Welty TK, Lee ET, Yeh J, Cowan LD, Go O, et al. 1995. Cardiovascular disease risk factors among American Indians: The Strong Heart Study. American Journal of Epidemiology 142(3):269–287.
Whittaker JO. 1982. Alcohol and the Standing Rock Sioux Tribe: A twenty-year follow-up study. Journal of Studies on Alcohol 43:191–200.
Winfree LT, Griffiths CT. 1985. Trends in drug orientations and behavior: Changes in a rural community, 1975–1982. International Journal of the Addictions 20(10):1495–1508.
Winfree LT, Griffiths CT, Sellers CS. 1989. Social learning theory, drug use, and American Indian youths: A cross-cultural test. Justice Quarterly 6(3):395–417.
Varmus H. 1995. Disease-Specific Estimates of Direct and Indirect Costs of Illness and NIH Support. Bethesda, MD: Office of the Director, National Institutes of Health, Public Health Service, U.S. Department of Health and Human Services.


