
6
Dual-Energy X-Ray Absorptiometry: Research Issues and Equipment
Wendy M. Kohrt1
INTRODUCTION
The primary clinical application of dual-energy x-ray absorptiometry (DXA or DEXA) is the measurement of bone mineral content (BMC, g) and bone mineral density (BMD, g/cm2) of the lumbar spine and proximal femur to assess risk for osteoporosis. Additional applications of DXA that are relevant to nutrition research include: (1) the determination of total body bone mineral content (TBBM, g), which can be used as an adjunct measure for the assessment of body composition using multicompartment models; (2) the independent assessment by DXA of a three-compartment model of body composition
(TBBM, fat, and nonbone lean tissue); and (3) the evaluation of regional body composition.
EQUIPMENT
DXA instruments have been commercially available since 1987. Advantages of DXA compared to its predecessor, dual-photon absorptiometry (DPA), include reduced radiation exposure, stability of the energy source, faster data collection, and increased precision of measurements. The three major manufacturers of DXA instruments in the United States are Hologic (Waltham, Mass.), Lunar (Madison, Wis.), and Norland (Fort Atkinson, Wis.). Although the first generation of DXA instruments from these manufacturers was limited to the measurement of BMC and BMD of selected regions of the skeleton, all of the manufacturers now produce machines that can assess both total body and regional bone mineral and soft tissue masses. The principles of operation, methods of calibration, and other features of the various models of DXA instruments produced by each manufacturer have been reviewed by Lohman (1996).
ASSESSMENT OF BONE MINERAL DENSITY
Reliability and Precision
The short-and long-term reliability and precision of BMD measured by DXA have been shown to be excellent. Table 6-1 summarizes the findings of just a few of the studies that have assessed the short-term coefficient of variation (CV) in measuring BMD by DXA. It is apparent that there is good precision across manufacturers, instrument models, data collection modes, and measurement sites. Long-term precision of DXA, which is typically evaluated by measuring BMD of a spine phantom (a mechanical model for predicting irradiation dosage deep in the body), has been shown to be excellent, with CVs less than 1.0 percent (Lilley et al., 1991; Orwoll et al., 1993). The highly reproducible measurement of total body bone mineral content (Jensen et al., 1994; Mazess et al., 1990; Pritchard et al., 1993; Slosman et al., 1992; Snead et al., 1993; Svendsen et al., 1993) makes DXA particularly suitable for use in multicompartment models of body composition.
Validity
The validity of an instrument depends on how well it measures what it is intended to measure. In the case of the measurement of BMD by DXA, validity remains questionable because there is a wide disparity among BMD measures
TABLE 6-1 Coefficients of Variation of Measurement of Bone Mineral Density by Dual-Energy X-Ray Absorptiometry
|
Reference |
Scanner |
Manufacturer |
Site/Object |
CV (%) |
|
Kohrt and Birge, Jr., 1995 |
QDR-1000W |
Hologic |
Total body |
0.6 |
|
|
|
|
PA spine |
1.1 |
|
|
|
|
Femoral neck |
1.5 |
|
|
|
|
Trochanter |
1.1 |
|
|
|
|
Ward's |
3.2 |
|
|
|
|
Ultradistal wrist |
0.6 |
|
Jergas et al., 1995 |
QDR-2000 |
Hologic |
PA spine |
1.3 |
|
|
|
|
Lateral spine |
2.0 |
|
Mazess et al., 1992 |
DPX-L |
Lunar |
PA spine |
|
|
|
|
|
Fast* |
0.6 |
|
|
|
|
Medium† |
0.5 |
|
|
|
|
Femoral neck |
|
|
|
|
|
Fast |
1.0 |
|
|
|
|
Medium |
1.4 |
|
|
|
|
Trochanter |
|
|
|
|
|
Fast |
1.5 |
|
|
|
|
Medium |
2.0 |
|
|
|
|
Ward's |
|
|
|
|
|
Fast |
2.6 |
|
|
|
|
Medium |
2.3 |
|
Sievanen et al., 1992 |
XR-26 |
Norland |
PA spine |
1.7 |
|
|
|
|
Femoral neck |
1.3 |
|
|
|
|
Distal radius |
1.9 |
|
Tothill et al., 1994a |
QDR-1000W |
Hologic |
Nord phantom |
0.9 |
|
|
DPX |
Lunar |
(Nord, 1991) |
1.1 |
|
|
XR-26 |
Norland |
|
1.2 |
|
Eiken et al., 1994 |
QDR-1000W |
Hologic |
Spine phantom |
0.4 |
|
|
QDR-2000 single-beam x-ray |
Lunar |
|
0.5 |
|
|
QDR-2000 fanbeam x-ray |
Lunar |
|
0.5 |
|
NOTE: CV, coefficient of variation; PA, posterior⇒panterior. * 2-min scan time. † 4-min scan time. |
||||
obtained on different DXA scanners. In vivo assessments of the lumbar spine, proximal femur, and whole body and in vitro assessments of a number of different phantoms indicate that BMD values obtained from Lunar instruments are 12 to 24 percent higher (Genant et al., 1994; Horber et al., 1992; Lai et al., 1992; Pocock et al., 1992) than those from Hologic or Norland machines. Comparisons of Norland and Hologic instruments are variable, with differences in BMD ranging from -1 to 14 percent. Despite these differences, BMD values obtained on the three systems have consistently been shown to be highly correlated (r = 0.88).
The International DXA Standardization Committee has spearheaded efforts to standardize BMD measures across instruments (Genant et al., 1994). Using the European spine phantom, Genant et al. (1994) found that BMD values obtained on different machines were highly correlated (r > 0.99), but values were approximately 12 percent higher on Lunar than on Hologic or Norland machines. The differences in BMD values among the scanners were attributable both to differences in methods of calibration and to differences in the methods of edge detection (i.e., bone areas were smaller on Lunar instruments). This study indicated that Lunar overestimated the true BMD value of the phantom, while Hologic and Norland underestimated the true value. Equations were developed to predict true lumbar spine BMD from values measured on each instrument.
Although the attempt to standardize BMD values is laudable and the results are encouraging, investigators must be aware that features and options that emerge with each new generation of DXA may introduce additional sources of variance in BMD values. Some of the options currently available include x-ray beam configuration (single-beam vs. fan-beam), speed of data collection, the size of the collimator, and the software version used to analyze the scan. These factors have been shown to result in changes in BMD of up to approximately 4 percent (Blake et al., 1993; Eiken et al., 1994, 1995; Mazess et al., 1992). Table 6-2 illustrates the differences in BMD values obtained on different DXA models from the same manufacturer using either single-beam or fan-beam x-ray configurations. Obviously, controlling for these factors is of critical importance, particularly in prospective studies that involve serial assessments of BMD.
ASSESSMENT OF BODY COMPOSITION
Reliability and Precision
Because bone mineral, nonbone lean tissue, and fat have different x-ray attenuation properties, it is possible with some DXA instruments to acquire a three-compartment model of body composition. The measurement of total body BMC by DXA has a high degree of precision; CVs have been reported to be less than or equal to 1.5 percent (Jensen et al., 1994; Mazess et al., 1990; Pritchard et
TABLE 6-2 Comparisons of Bone Mineral Density and Body Composition Measures from Various Scanners and X-Ray Beam Configurations
|
|
DXA Instrument and X-Ray Configuration |
||
|
|
QDR-1000W (single-beam) |
QDR-2000 (single-beam) |
QDR-2000 (fan-beam) |
|
Whole-body BMD (g/cm2) |
1.206 |
1.196* |
1.164* |
|
L2–L4 BMD (g/cm2) |
1.094 |
1.109* |
1.077* |
|
Total mass (kg)† |
67.0 |
66.6* |
66.4* |
|
Body fat (%)† |
17.7 |
20.6* |
21.1* |
|
NOTE: DXA, dual-energy x-ray absorptiometry; BMD, bone mineral density; L2–L4, lumbar vertebrae 2–4. * Significantly different from the QDR-1000W; p < 0.05. † Corresponding values measured by hydrodensitometry were 67.1 kg and 17.2 percent body fat. SOURCE: W. M. Kohrt (Unpublished data, Washington University School of Medicine, St. Louis, Mo., 1995). |
|||
al., 1993; Slosman et al., 1992; Snead et al., 1993; Svendsen et al., 1993). The CVs of fat mass tend to be larger than those of total body mass or lean mass (Table 6-3), but this is largely due to the fact that the fat compartment has a smaller mass. In general, the standard deviations for repeat assessments of the total, fat, and lean compartments are approximately 0.4 to 0.7 kg.
Validity
The validity of the assessment of body composition by DXA remains questionable. Although some investigators have suggested that DXA is an accurate method of measuring body composition and that it can replace hydrodensitometry as the reference method for validating other techniques (Formica et al., 1993), others have suggested that this is premature (Kohrt, 1995; Roubenoff et al., 1993). There are a number of potential sources of error in the assessment of body composition by DXA, but the discussion of these errors requires at least a rudimentary understanding of the underlying principles.
TABLE 6-3 Coefficients of Variation of Body Composition Measurements by Dual-Energy X-Ray Absorptiometry
|
Reference |
Scanner |
Manufacturer |
Total Mass (%) |
Fat Mass (%) |
Lean Mass (%) |
|
Tothill et al., 1994b; in vivo |
QDR-1000W |
Hologic |
0.1 |
1.9 |
0.6 |
|
|
DPX |
Lunar |
0.1 |
2.6 |
1.1 |
|
|
XR-26 |
Norland |
1.2 |
2.7 |
1.4 |
|
Tothill et al., 1994b; phantom |
QDR-1000W |
Hologic |
0.2 |
3.2 |
0.6 |
|
|
DPX |
Lunar |
0.2 |
4.4 |
1.0 |
|
|
XR-26 |
Norland |
0.2 |
3.0 |
0.9 |
|
Pritchard et al., 1993 |
QDR-1000W |
Hologic |
|
2.1 |
0.6 |
|
Snead et al., 1993 |
QDR-1000W |
Hologic |
0.9 |
1.4 |
1.9 |
|
Svendsen et al., 1993 |
DPX |
Lunar |
|
4.6 |
1.5 |
Underlying Principles of Body Composition Assessment by DXA
The assessment of body composition by hydrodensitometry is based on the principle that the composition of an object can be determined if it comprises two materials that have different mass densities. Similarly, with DXA it is possible to determine the composition of an object if it comprises two materials that have different x-ray attenuation properties. In DXA, the x-ray attenuation of each pixel of the scan image is compared with that of the reference materials, which have x-ray attenuation properties similar to the biological tissues of interest (i.e., bone mineral, nonbone lean, and fat).
The x-ray attenuation coefficient of bone mineral is several orders of magnitude higher than that of either fat or lean soft tissue (Figure 6-1, Panel A) (Nord and Payne, 1990). Thus, bone pixels are readily distinguished from nonbone pixels, except when they contain a very small proportion of bone mineral (e.g., pixels that intersect the edges of bone). Because the x-ray attenuation coefficients of nonbone lean and fat tissues are also different (Figure 6-1, Panel B), the lean/fat composition of nonbone pixels can be quantified. Thus, in simplistic terms, the determination of body composition by DXA involves (1) the comparison of those pixels that contain bone mineral with the reference materials to determine bone mineral content, and (2) the comparison of nonbone pixels with the reference materials to determine lean and fat content.
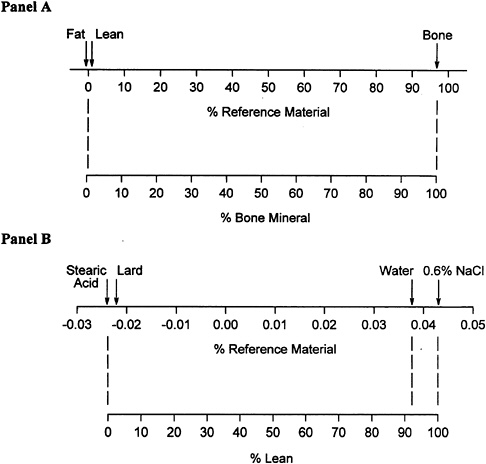
FIGURE 6-1 Overview of the general principles upon which the estimation of body composition by DXA is based. In those pixels that contain bone mineral, the x-ray attenuation is compared with attenuation characteristics of the appropriate reference materials for bone and nonbone tissue (Panel A). In those pixels that do not contain bone mineral, the x-ray attenuation is compared with attenuation characteristics of appropriate reference materials for nonbone lean and fat tissues (Panel B). SOURCE: Adapted from Nord and Payne (1990).
Sources of Error in the Assessment of Body Composition by DXA
Hydration Status. An acknowledged weakness in the assessment of body composition by hydrodensitometry is the requisite assumption that the fractional composition of the fat-free mass (i.e., percent water, protein, and mineral) is constant within and between individuals. Analogous to this is the assumption in DXA that nonbone lean tissue has fixed water and protein fractions. Thus, one source of error in the estimation of body composition by DXA is the hydration status of the subject.
The effects of hydration status have been studied in hemodialysis patients and in volunteers who ingest large volumes of fluid (Formica et al., 1993; Going et al., 1993; Horber et al., 1992). The removal of 0.9 to 4.4 kg or the ingestion of 0.4 to 2.4 kg of fluid were reflected by DXA as changes in nonbone lean mass; there were no significant changes in bone mineral or fat mass. These findings indicate that small fluctuations in hydration status were accurately assessed by DXA.
From a theoretical perspective, even large deviations from the assumed water fraction of fat-free mass should have a relatively small effect on body composition assessment by DXA. Based on x-ray attenuation properties, mineral-free water appears to be approximately 8 percent fat by DXA (Goodsitt, 1992) (as exemplified in Figure 6-1, Panel B). Thus, if the water content of fat-free mass was actually 83 percent rather than the assumed 73 percent, 8 percent of the ''extra" 10 percent water would be measured as fat rather than as lean mass (i.e., 0.08 × 0.10 × fat-free mass). In most individuals, the magnitude of error in fat or fat-free mass would not exceed 0.5 kg, even under conditions of extreme physiological variance in hydration status.
Tissue Thickness. DXA is subject to beam-hardening errors, which occur as a result of the preferential attenuation of low-energy x rays (Goodsitt, 1992). The magnitude of error varies with the thickness of the tissue, with thicker tissues yielding a lower effective attenuation coefficient and, therefore, a higher apparent fat content.
The effect of tissue thickness has been evaluated under in vitro conditions with biological tissues of known composition or materials that simulate biological tissues (Haarbo et al., 1991; Heymsfield et al., 1989; Laskey et al., 1992). Using a spine phantom in combination with varying amounts of water and lard to simulate lean and fat tissues, respectively, Laskey et al. (1992) found that large errors in the assessment of fat and lean masses occurred at tissue depths less than 10 cm and greater than 20 cm. Using a mixture of ox thigh and porcine lard at a depth of 15 cm, Haarbo and colleagues (1991) found that DXA underestimated fat content, which was verified by chemical analysis. Thus, even under controlled in vitro conditions, there appear to be inaccuracies in the assessment of tissue composition by DXA.
In contrast, the marked reduction in bone mass that has been shown to accompany weight loss in obese individuals does not appear to be an error associated with changing tissue thickness. In a unique study design, Jensen and colleagues (1994) positioned up to 23 kg of lard, which has an x-ray attenuation coefficient similar to that of fat tissue, on nonobese individuals undergoing DXA scans, with portions of the lard gradually removed for subsequent scans to imitate the loss of fat weight. In these subjects, the apparent reduction in bone mineral content was only 0.5 g/kg lard removed. Conversely, in obese patients who lost approximately 12 kg in 15 weeks, the loss of bone mineral averaged
16.5 g/kg fat loss. The results of this study suggest that changes in tissue thickness have a minimal effect on the assessment of bone mineral and that large reductions in body weight may result in a significant loss of bone mass. The extent to which changes in tissue thickness affected the assessment of soft tissue composition was not reported and is an issue that requires further investigation.
Soft Tissue Composition in Bone Regions. A limitation of DXA is that soft tissue within bone pixels, which constitute approximately 40 percent of the total pixels (Tothill and Nord, 1995), cannot be evaluated. Another source of error in the assessment of body composition is, therefore, the means by which the composition of soft tissue over-and underlying bone is estimated. This is of particular concern for regional assessments of the thoracic and pelvic regions, where the majority of the pixels contain bone mineral.
Some investigators have positioned packets of lard (Figure 6-1, Panel B) over various regions of the body to evaluate the accuracy of soft tissue assessment by DXA (Lohman, 1996; Snead et al., 1993). In these experiments, DXA accurately assessed the increase in fat mass when packets of lard were positioned on the legs. However, only approximately 50 percent of the added mass was identified as fat when the packets were positioned on the chest and abdomen. These studies, which utilized Hologic and Lunar instruments, suggest that the algorithms used to estimate the composition of soft tissue in regions that cannot be measured (i.e., regions that contain bone mineral) may be a source of significant error.
The extent to which these three sources of error (i.e., hydration status, beam-hardening effects, and the estimation of the composition of soft tissue in bone mineral-containing pixels) affect the assessment of body composition cannot be succinctly summarized. It is likely that the strategies used to adjust for or correct known sources of error vary among DXA manufacturers. Moreover, for a given manufacturer, it is likely that the accuracy of assessing body composition changes as new features or options become available on the hardware and as revisions are made in the software used to analyze body composition data. The success of these strategies in improving the assessment of body composition by DXA must be methodically tested by independent investigators.
Comparisons of DXA and Hydrodensitometry
Because hydrodensitometry has long been regarded as the reference method for the assessment of body composition, it has been used to assess the validity of DXA. It must be noted, however, that since both DXA and hydrodensitometry are indirect measures of body composition, there is no definitive way of determining which, if either, is valid. Some of the studies that have estimated
body fat content by DXA and by hydrodensitometry are summarized in Table 6-4. While estimates of body fat by DXA closely approximated those by hydrodensitometry in some study cohorts, wide discrepancies occurred in others. These inconsistencies are apparent both between and within the various DXA instruments; one factor may be the version of the software used to analyze the data, which was not always reported.
Even when there is apparently excellent agreement in the estimation of body composition by DXA and hydrodensitometry, results must be interpreted cautiously. For example, there were only small differences in the mean body fat levels estimated by DXA and hydrodensitometry in the relatively large cohorts studied by Hansen et al. (1993) and Wellens et al. (1994), and the correlations between the methods were strong (correlation coefficients > 0.86). However, the equations for the lines describing the relationships between percent body fat measured by DXA and hydrodensitometry (HW) were markedly different from the equation for the line of identity:
The wide variance in comparisons of DXA with hydrodensitometry, coupled with the findings that DXA does not accurately assess fat (i.e., lard experiments) in some regions of the body (Lohman, 1996; Snead et al., 1993), suggest that DXA is not yet a valid method of assessing body composition. Nevertheless, since DXA is less reliant on assumptions regarding the consistency of fat-free mass than is hydrodensitometry, it holds great potential for becoming the criterion method.
TABLE 6-4 Comparisons of Body Fat Content Measured by Dual-Energy X-Ray Absorptiometry and by Hydrostatic Weighing
|
|
|
|
|
Body Fat (%) |
||
|
Reference |
Subjects (N) Age (yr) |
Scanner (software version) |
Manufacturer |
DXA |
HW |
Δ |
|
Johansson et al., 1993 |
23 males 37 ± 10 |
DPX-L |
Lunar |
9.5 |
18.1 |
-8.6 |
|
Withers et al., 1992 |
12 males 22 ± 5 |
DPX-L |
Lunar |
6.8 |
9.7 |
-2.9 |
|
Van Loan and Mayclin, 1992 |
26 males 37 ± 10 |
DPX |
Lunar |
19.4 |
23.5 |
-4.1 |
|
|
23 females 36 ± 11 |
|
|
30.8 |
31.7 |
-0.9 |
|
|
|
|
|
Body Fat (%) |
||
|
Reference |
Subjects (N) Age (yr) |
Scanner (software version) |
Manufacturer |
DXA |
HW |
Δ |
|
Penn et al., 1994 |
10 males 28 ± 4 |
DPX |
Lunar |
20.5 |
20.8 |
-0.3 |
|
Hansen et al., 1993 |
100 females 34 ± 3 |
DPX (3.1) |
Lunar |
29.7 |
29.9 |
-0.2 |
|
Wellens et al., 1994 |
50 males 39 ± 14 |
DPX (3.4) |
Lunar |
21.7 |
22.5 |
-0.8 |
|
|
78 females 42 ± 14 |
|
|
34.6 |
33.2 |
+1.4 |
|
Clark et al., 1993 |
35 males 39 ± 14 |
XR-26 (2.0.1) |
Norland |
21.3 |
17.4 |
+3.9 |
|
Pritchard et al., 1993 |
14 males, and females 37 ± 13 |
DPX (3.4) |
Lunar |
24.1 |
19.4 |
+4.5 |
|
|
|
QDR-1000W (5.35) |
Hologic |
20.7 |
19.4 |
+1.3 |
|
Tothill et al., 1994b |
11 males and females |
DPX (3.6) |
Lunar |
26.8 |
23.6 |
+3.2 |
|
|
|
XR-26 (2.4) |
Norland |
29.5 |
23.6 |
+5.9 |
|
|
|
QDR-1000W (5.51p) |
Hologic |
23.1 |
23.6 |
-0.5 |
|
Snead et al., 1993 |
33 males and females 29 ± 5 |
QDR-1000W (5.50) |
Hologic |
12.7 |
13.9 |
-1.2 |
|
|
13 males 49 ± 6 |
|
|
19.0 |
22.3 |
-3.3 |
|
|
26 males 68 ± 4 |
|
|
21.3 |
26.6 |
-5.3 |
|
|
32 females 29 ± 5 |
|
|
22.7 |
21.3 |
+1.4 |
|
|
19 females 48 ± 6 |
|
|
27.6 |
27.8 |
-0.2 |
|
|
62 females 66 ± 3 |
|
|
34.5 |
38.2 |
-3.7 |
|
NOTE: DXA, dual-energy x-ray absorptiometry; HW, hydrostatic weighing. |
||||||
ASSESSMENT OF REGIONAL BODY COMPOSITION
A distinct advantage of DXA over hydrodensitometry is that it can be used to assess the composition of specific regions of the body. However, until the validity of soft tissue assessment by DXA is established, this technique is not suitable for use in research. An exception to this is the comparison of regional assessment of body composition by DXA and some other method, such as magnetic resonance imaging (MRI) or computed tomography (CT), as a means of evaluating the validity of DXA.
In one such study, Jensen and colleagues (1995) evaluated whether DXA could be combined with anthropometry to estimate abdominal and visceral fat volumes, which also were measured by CT. Subcutaneous abdominal fat was estimated from circumference and skinfold thickness measurements. Visceral fat was assumed to be the difference between total abdominal fat measured by DXA and subcutaneous abdominal fat. The estimation of visceral fat by DXA was poor, yielding negative values in one-third of the study cohort. Estimates of total abdominal fat by DXA and CT were similar (8,448 ± 5,005 ml vs. 8,066 ± 5,354 ml, respectively; r = 0.98). However, since CT incorporates the nonfat constituents of adipose tissue, whereas DXA does not, it was expected that total fat would be approximately 15 percent higher by CT. The authors suggested that DXA is not yet appropriate for use in research studies that require an accurate quantification of adipose tissue.
AUTHOR'S CONCLUSIONS AND RECOMMENDATIONS
For the measurement of both bone and soft tissue masses, there are several advantages of DXA: (1) it provides reliable and precise data; (2) the data acquisition process is fast, easy to perform, involves minimal radiation exposure, and is easily tolerated by subjects; (3) the data analysis process is fast, versatile, and easy to perform; and (4) the assessment of body composition by DXA appears to be less reliant on underlying assumptions than most other methods.
A major disadvantage of DXA is that currently there is a lack of standardization in bone and soft tissue measurements. There are large discrepancies in measurements obtained on instruments from the three major manufacturers of DXA machines. Moreover, for a given manufacturer, results may vary by the model of the instrument, the mode of operation (e.g., single-beam vs. fan-beam or normal speed vs. fast speed), or the version of the software used to analyze the data. Nevertheless, it is encouraging that bone measurements obtained on different machines or in different operation modes are consistently found to be highly correlated, suggesting that the standardization of results is possible. Although currently available data suggest that soft tissue measurements are not accurate, it seems likely, at least from a theoretical perspective, that DXA has the potential to become the reference method of assessing body composition.
Whether this will occur depends largely on the manufacturers and whether the demand for this application of DXA is sufficient to justify the costs of research and development.
Most of the expense associated with the use of DXA is in the cost of the instrument itself, which is likely to be in excess of $100,000. Although DXA is best suited for laboratory-based research, as opposed to field testing, transportable models of DXA instruments are available.
The following conclusions can be drawn regarding the advantages and disadvantages of DXA:
-
For research that requires the assessment of bone mass, DXA is superior to any other available methodology.
-
The highly reliable and precise measurement of total body bone mineral mass by DXA makes it an excellent adjunct for multicompartment modeling of body composition.
-
Although DXA is an attractive means by which to obtain an independent, three-compartment model of body composition, there is considerable evidence that the results are not accurate.
-
The regional assessment of body composition by DXA is inferior to MRI and CT.
REFERENCES
Blake, G.M., J.C. Parker, F.M.A. Buxton, and I. Fogelman 1993 Dual x-ray absorptiometry: A comparison between fan beam and pencil beam scans. Br. J. Radiol. 66:902–906.
Clark, R.R., J.M. Kuta, and J.C. Sullivan 1993 Prediction of percent body fat in adult males using dual energy x-ray absorptiometry, skinfolds, and hydrostatic weighing. Med. Sci. Sports Exerc. 25:528–535.
Eiken, P., O. Bärenholdt, L. Bjorn Jensen, J. Gram, and S. Pors Nielsen 1994 Switching from DXA pencil-beam to fan-beam. I: Studies in vitro at four centers . Bone 15:667–670.
Eiken, P., N. Kolthoff, O. Bärenholdt, F. Hermansen, and S. Pors Nielsen 1995 Switching from DXA pencil-beam to fan-beam. II: Studies in vivo. Bone 15:671–676.
Formica, C., M.G. Atkinson, I. Nyulasi, J. McKay, W. Heale, and E. Seeman 1993 Body composition following hemodialysis: Studies using dual-energy x-ray absorptiometry and bioelectrical impedance analysis. Osteoporos. Int. 3:192–197.
Genant, H.K., S. Grampp, C.C. Glüer, K.G. Faulkner, M. Jergas, K. Engelke, S. Hagiwara, and C. Van Kuijk 1994 Universal standardization for dual x-ray absorptiometry: Patient and phantom cross-calibration results. J. Bone Miner. Res. 9:1503–1514.
Going, S.B., M.P. Massett, M.C. Hall, L.A. Bare, P.A. Root, D.P. Williams, and T.G. Lohman 1993 Detection of small changes in body composition by dual-energy x-ray absorptiometry . Am. J. Clin. Nutr. 57:845–850.
Goodsitt, M.M. 1992 Evaluation of a new set of calibration standards for the measurement of fat content via DPA and DXA. Med. Phys. 19:35–44.
Haarbo, J., A. Gotfredsen, C. Hassager, and C. Christiansen 1991 Validation of body composition by dual energy x-ray absorptiometry (DEXA). Clin. Physiol. 11:331–341.
Hansen, N.J., T.G. Lohman, S.B. Going, M.C. Hall, R.W. Pamenter, L.A. Bare, T.W. Boyden, and L.B. Houtkooper 1993 Prediction of body composition in premenopausal females from dual-energy x-ray absorptiometry. J. Appl. Physiol. 75:1637–1641.
Heymsfield, S.B., J. Wang, S. Heshka, J.J. Kehayias, and R.N. Pierson, Jr. 1989 Dual-photon absorptiometry: Comparison of bone mineral and soft tissue mass measurements in vivo with established methods. Am. J. Clin. Nutr. 49:1282–1289.
Horber, F.F., F. Thomi, J.P. Casez, J. Fonteille, and P. Jaeger 1992 Impact of hydration status on body composition as measured by dual energy x-ray absorptiometry in normal volunteers and patients on haemodialysis. Br. J. Radiol. 65:895–900.
Jensen, L.B., F. Quaade, and O.H. Sorensen 1994 Bone loss accompanying voluntary weight loss in obese humans. J. Bone Miner. Res. 9:459–463.
Jensen, M.D., J.A. Kanaley, J.E. Reed, and P.F. Sheedy 1995 Measurement of abdominal and visceral fat with computed tomography and dual-energy x-ray absorptiometry. Am. J. Clin. Nutr. 61:274–278.
Jergas, M., M. Breitenseher, C.C. Glüer, W. Yu, and H.K. Genant 1995 Estimates of volumetric bone density from projectional measurements improve the discriminatory capability of dual x-ray absorptiometry. J. Bone Miner. Res. 10:1101–1110.
Johansson, A.G., A. Forslund, A. Sjodin, H. Mallmin, L. Hambraeus, and S. Ljunghall 1993 Determination of body composition—a comparison of dual-energy x-ray absorptiometry and hydrodensitometry. Am. J. Clin. Nutr. 57:323–326.
Kohrt, W.M. 1995 Body composition by DXA: Tried and true? Med. Sci. Sports Exerc. 27(10):1349–1353.
Kohrt, W.M., and S.J. Birge, Jr. 1995 Differential effects of estrogen treatment on bone mineral density of the spine, hip, wrist, and total body in late postmenopausal women. Osteoporos. Int. 5(3):150–155.
Lai, K.C., M.M. Goodsitt, R. Murano, and C.H. Chesnut III 1992 A comparison of two dual-energy x-ray absorptiometry systems for spinal bone mineral measurement. Calcif. Tissue Int. 50:203–208.
Laskey, M.A., K.D. Lyttle, M.E. Flaxman, and R.W. Barber 1992 The influence of tissue depth and composition on the performance of the Lunar dual-energy x-ray absorptiometer whole-body scanning mode. Eur. J. Clin. Nutr. 46:39–45.
Lilley, J., B.G. Walters, D.A. Heath, and Z. Drolc 1991 In vivo and in vitro precision for bone density measured by dual-energy x-ray absorption. Osteoporos. Int. 1:141–146.
Lohman, T.G. 1996 Dual energy x-ray absorptiometry. Pp. 63–78 in Human Body Composition, A.F. Roche, S.B. Heymsfield, and T.G. Lohman, eds. Champaign, Ill.: Human Kinetics.
Mazess, R.B., H.S. Barden, J.P. Bisek, and J. Hanson 1990 Dual-energy x-ray absorptiometry for total-body and regional bone-mineral and soft-tissue composition. Am. J. Clin. Nutr. 51:1106–1112.
Mazess, R., C.H. Chesnut, III, M. McClung, and H. Genant 1992 Enhanced precision with dual-energy x-ray absorptiometry. Calcif. Tissue Int. 51:14–17.
Nord, R.H. 1991 Soft tissue composition phantom for DXA. Osteoporos. Int. 1:203.
Nord, R.H., and R.K. Payne 1990 Standards for body composition calibration in DEXA. Paper presented at the 2nd Annual Meeting of the Bath Conference on Bone Mineral Measurement, Bath, U.K.
Orwoll, E.S., S.K. Oviatt, and J.A. Biddle 1993 Precision of dual-energy x-ray absorptiometry: Development of quality control rules and their application in longitudinal studies. J. Bone Miner. Res. 8:693–699.
Penn, I-W., Z-M. Wang, K.M. Buhl, D.B. Allison, S.E. Burastero, and S.B. Heymsfield 1994 Body composition and two-compartment model assumptions in male long distance runners. Med. Sci. Sports Exerc. 26:392–397.
Pocock, N.A., P.N. Sambrook, T. Nguyen, P. Kelly, J. Freund, and J.A. Eisman 1992 Assessment of spinal and femoral bone density by dual x-ray absorptiometry: Comparison of Lunar and Hologic instruments. J. Bone Miner. Res. 7:1081–1084.
Pritchard, J.E., C.A. Nowson, B.J. Strauss, J.S. Carlson, B. Kaymakci, and J.D. Wark 1993 Evaluation of dual energy x-ray absorptiometry as a method of measurement of body fat. Eur. J. Clin. Nutr. 47:216–228.
Roubenoff, R., J.J. Kehayias, B. Dawson-Hughes, and S.B. Heymsfield 1993 Use of dual-energy x-ray absorptiometry in body composition studies: Not yet a "gold standard." Am. J. Clin. Nutr. 58:589–591.
Sievanen, H., P. Oja, and I. Vuori 1992 Precision of dual-energy x-ray absorptiometry in determining bone mineral density and content of various skeletal sites. J. Nucl. Med. 33:1137–1142.
Slosman, D.O., J-P. Casez, C. Pichard, T. Rochat, F. Fery, R. Rizzoli, J-P. Bonjour, A. Morabia, and A. Donath 1992 Assessment of whole-body composition with dual-energy x-ray absorptiometry. Radiology 185:593–598.
Snead, D.B., S.J. Birge, and W.M. Kohrt 1993 Age-related differences in body composition by hydrodensitometry and dual-energy x-ray absorptiometry. J. Appl. Physiol. 74:770–775.
Svendsen, O.L., J. Haarbo, C. Hassager, and C. Christiansen 1993 Accuracy of measurements of body composition by dual-energy x-ray absorptiometry in vivo. Am. J. Clin. Nutr. 57:605–608.
Tothill, P., and R.H. Nord 1995 Limitations of dual-energy x-ray absorptiometry [letter]. Am. J. Clin. Nutr. 61:398–399.
Tothill, P., A. Avenell, and D.M. Reid 1994a Precision and accuracy of measurements of whole-body bone mineral: Comparisons between Hologic, Lunar and Norland dual-energy x-ray absorptiometers. Br. J. Radiol. 67:1210–1217.
Tothill, P., A. Avenell, J. Love, and D.M. Reid 1994b Comparisons between Hologic, Lunar and Norland dual-energy x-ray absorptiometers and other techniques used for whole-body soft tissue measurements. Eur. J. Clin. Nutr. 48:781–794.
Van Loan, M.D., and P.L. Mayclin 1992 Body composition assessment: Dual-energy x-ray absorptiometry (DEXA) compared to reference methods. Eur. J. Clin. Nutr. 46:125–130.
Wellens, R., W.C. Chumlea, S. Guo, A.F. Roche, N.V. Reo, and R.M. Siervogel 1994 Body composition in white adults by dual-energy x-ray absorptiometry, densitometry, and total body water. Am. J. Clin. Nutr. 59:547–555.
Withers, R.T., D.A. Smith, B.E. Chatterton, C.G. Schultz, and R.D. Gaffney 1992 Comparison of four methods of estimating the body composition of male endurance athletes. Eur. J. Clin. Nutr. 46:773–784.
DISCUSSION
WM. CAMERON CHUMLEA: Wendy, you made a statement that DXA was less reliant on some of the underlying assumptions of body composition, but is it then more reliant on software assumptions, so that there is a wash, in a sense? I mean, Hologic went back in and massaged the software until they got the right answers for you, but does that just simply mean that the software package was sample specific?
WENDY KOHRT: Well, I will tell you, they did not do it just for me.
I am dealing with the software engineer at Hologic, who, in the very early stages of this work, went on the basic assumption that water was a minimal component of fat-free mass. We have had to go through all these transitions. I think they are really learning more about the biology of body composition. So, yes, validity is reliant on the technical aspects, but that is kind of a good feature, because those are things that are amenable to change. We can modify the hardware and the software to get it to where it is a valid measure of body composition.
DENNIS BIER: That is, if the biological basis of the software change is going to be open to the public. [You must] understand that this is a proprietary thing, and what you really have is a black box, and unless you can understand the biological basis for the calculations, you are left in the cold.
WENDY KOHRT: And that is a big problem. My experiences with Hologic have not all been favorable. When I was dealing with the software engineer, who had a vested interest in what he was doing and really wanted to know if it was right, my interactions were very useful, but in dealing with the people who wanted to sell machines, it was a different story.
DENNIS BIER: I can give you just a very practical example from mass spectrometry. We had an instrument from a company that met all of their specs until we took apart the software and found out that they calculated the numbers wrong so that they met their specs. We pointed that out to them, but if an investigator did not have the ability to do that, then he would not have discovered that discrepancy, so the machine functioned fine.
WENDY KOHRT: I think there are people working in this area who are trying to make the manufacturers much more accountable. Whether that will be successful, I do not know.
G. RICHARD JANSEN: If you took the initial cost and amortized it over a reasonable life of the machine and added in maintenance contracts, labor costs, and all the rest of it, and if you assume a certain level of use, have you calculated per analysis what it would cost?
WENDY KOHRT: I have not, but I will give you some idea. The new machines are in the neighborhood of $120,000. I think a full service contract on that is $9,000 a year. The cost to maintain it on a day-to-day basis is the normal cost of electricity, computer supplies, disks, and then the labor.
JAMES DeLANY: Have you had power problems with yours?
WENDY KOHRT: No.
JAMES DeLANY: Do you have a power conditioner on yours?
WENDY KOHRT: The DXA instrument is housed in a different hospital from where I am, so I am not sure about that.
DAVID SCHNAKENBERG: Just another thought for the Army people. Hologic has actually done a spec on a transportable machine, one that could be put in a large truck and taken around just as x rays were done for tuberculosis screening.
KARL FRIEDL: Yes, it has been taken to the field.


