
Appendix F Extending Data Series and Alternative Projection Results for Gulf of Maine Cod
The committee utilised the services of a consultant, Dr. Graeme Parkes of MRAG Americas Inc., to (1) attempt to replicate the National Marine Fisheries Service (NMFS) assessments (described in Chapter 2), (2) investigate the possibility of extending stock assessments backward in time, and (3) provide alternative evaluation of management strategies by using different recruitment scenarios.
Extending Data Series Back In Time
Task 2 was an investigation of whether the survey data before the period covered by the stock assessments could be used in conjunction with ADAPT stock assessment results to provide historical estimates of recruitment and spawning biomass. The reason it cannot be done is that there is no reliable age composition information from the harvest prior to the assessment periods now used.
The survey abundance indices (Ia, mean catch per tow by age a as input into ADAPT) and calibration coefficients (unbiased estimates of qa from ADAPT bootstrap results) were obtained. Estimates of absolute numbers at age Na for the spring (1968 to 1996) and autumn (1963 to 1996) survey series were made using the relationship Na = Ia/qa .
These estimates were used to calculate spawning stock biomass by using mean weights at age and maturity ogives from ADAPT. No mean weight-at-age data were available for years prior to the periods covered by ADAPT, so the arithmetic mean of the weights at age was used for these years. The maturity ogive for the earliest year in the ADAPT was used for all earlier years in the survey series.
This procedure provided estimates of recruitment (numbers at age), total numbers, and spawning stock biomass in all years of the survey time series. Figures F1.A-F1.E show plots of recruitment over time for each of the five stocks compared to ADAPT estimates (estimates of total numbers and spawning biomass have similar patterns and hence are not shown). Trajectories for the spring and autumn surveys are shown separately. For Gulf of Maine cod, the age 1 index was not used in ADAPT tuning, and therefore no estimate of q was provided. As a proxy, a rough estimate was calculated as the average of I1/N 1 for each survey series.
Recruitment estimates from application of this method are much more variable than those from ADAPT, showing the desirability of using an age-structured assessment model rather than converting survey estimates. Recruitment estimates from the period before the ADAPT assessments are generally higher on average than those during the assessment period, suggesting that recruitment, abundance, and biomass were higher prior to the period covered by the stock assessments.
Thus, better methods should be sought to extend assessments back in time in order to give a better historical perspective of the stocks. One method would be to construct or infer age frequencies
from any commercial catch samples collected prior to the current assessment period. Then, assessment using ADAPT would simply employ data from the extended period. For Georges Bank haddock, samples go back to 1931, which permit a long-term assessment. The second method would be to use different assessment methods such as Stock Synthesis or Auto differentiation (AD) Model Builder (see NRC, 1998, for a description of these models), which can take advantage of survey age composition data to extend the period without knowing the age composition of the commercial catch.
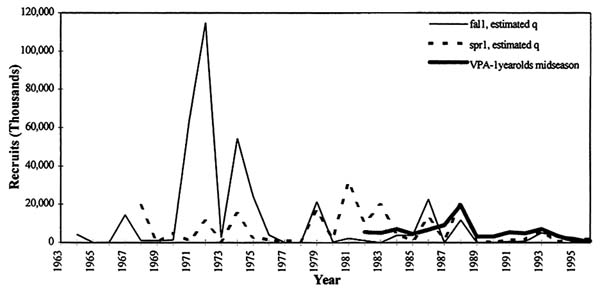
FIGURE F1-A Gulf of Maine (GOM) cod 1-year olds from autumn and spring surveys and virtual population analysis (midseason).

FIGURE F1-B Georges Bank (GB) cod 1-year olds from autumn and spring surveys and virtual population analysis (midseason).
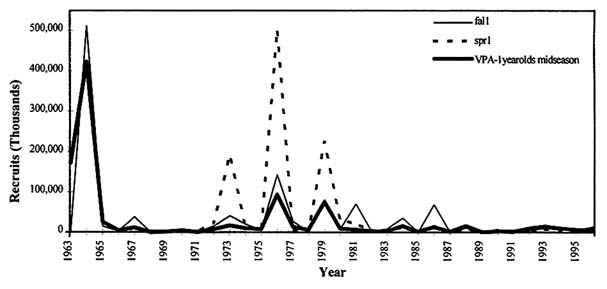
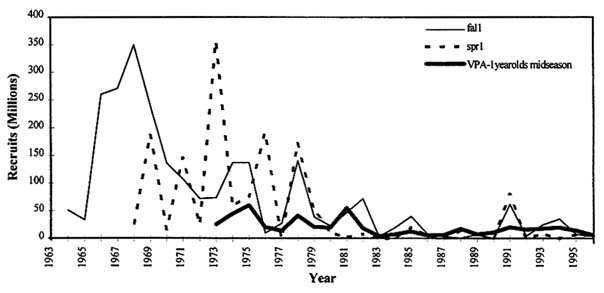
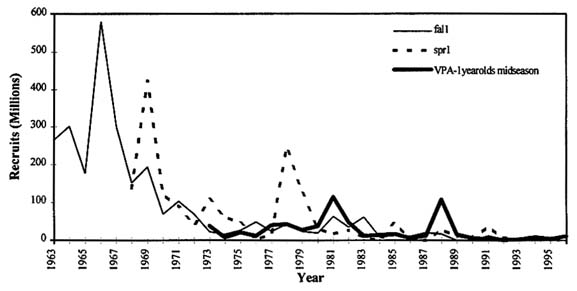
FIGURE F1-E Southern New England (SNE) yellowtail 1-year olds from autumn and spring surveys and virtual population analysis (midseason).
Alternative Projections
Task 3 was to develop alternative spawner-recruit relationships and use these to provide alternative forecasts of abundance over the standard 10-year period employed by NMFS. Initial projections were made by using a Beverton-Holt model, a constant recruitment model, and a density-independent model with recruitment proportional to spawning biomass. The alternative projections were stochastic so that probability distributions could be obtained. The first step in this analysis was to review the stock and recruitment data and Beverton-Holt parameter estimates presented in the SARC Working Paper Gen 2. The spawning stock-recruitment plots were regenerated for each stock from ADAPT results provided in the stock assessment papers. Spawning stock biomass (SSB) at the start of the spawning season in year t was matched with recruitment of 1-year olds at the start of year t + 1. A non-linear least-squares minimization routine (using Excel Solver, Systat, or Splus) was used to refit the parameters of the Beverton-Holt model to the ADAPT estimates in order to test the parameters estimated by NMFS. For Gulf of Maine cod, the estimated parameters and fitted curve were very different from those in Working Paper Gen 2, suggesting that it is difficult to get consistent parameter estimates with a Beverton-Holt model.
The stock-recruitment plots of data from ADAPT and fitted Beverton-Holt curves (NMFS and this study) are shown in Figures 2.1 through 2.5 of this report. These plots also show fit from the density-independent model.
A stochastic projection model was set up in Microsoft Excel, utilizing the add-in tool Crystal Ball, which enabled Monte Carlo simulations to be run and projection results presented in a spreadsheet format. This approach was favored to enhance the transparency of the method applied. After NMFS provided the ADAPT workspaces, the NMFS ADAPT bootstraps were rerun (see Chapter 2), which generated 200 vectors of stock abundance that were used as a seed for the projections. Rather than running 100 projections from each starting vector, as in the NMFS projections, a table lookup was generated which randomly selected one vector, with replacement, for each projection. A thousand
Other input data for the projections
SARC Working Paper Gen 2 indicated that selectivity at age (partial recruitment), weight at age, and maturity at age were ''generally" taken as the averages of estimates for 1994-1996. The same approach was used for the review projections. For maturity at age, this normally meant taking the average of three identical age vectors. For weight at age, the averages over 1994 to 1996 of the values in the ADAPT input/output for catch weight at age at the beginning of the year were used.
For selectivity at age, there was a vector cited as an ADAPT input that featured a flat-topped selectivity curve, and there was also the matrix of estimated partial recruitments at age and year in the ADAPT output. In most cases, these seemed to show evidence of a domed partial recruitment. Literal interpretation of the NMFS description would have led to taking simple averages of these age vectors over the specified period of years, as was done for the catch weights at age. This did not seem right, however, because the ADAPT calculations were done under the effective assumption of flat-topped partial recruitment. Therefore the following procedure was used: (1) Assume that on input the partial recruitment was flat-topped from ages 4 to 9, with 10 being a plus group, with F10 = F9 by assumption. This means that in the estimated partial recruitments in each year, average (PR4, . . + . , PR9) = 1.0. (2) Average the partial recruitment estimates for each of ages 1, 2, and 3, and then assume a partial recruitment for each projection of AvePR1, AvePR2, AvePR3, 1, 1, . . + . , .
After this procedure had been applied, it was noticed that the input vectors were cited for the yield-per-recruit calculations in one of the assessment papers. These values could have been used these if they were always cited, however, NMFS appeared to have followed a similar procedure to that outlined above, although the answers may not have been exactly the same. It would clearly have been very useful to have the input data included in the printout of the projection runs in SARC Working Paper Gen 2.
Output and Initial Projections
The spawning stock biomass was calculated at the start of the spawning season in accordance with the information provided in the ADAPT outputs (i.e., proportion of F and M before spawning). Projected recruitment values were constrained according to the methodology described in SARC Working Paper Gen 2 (using values of R/SSB10 and R/SSB90 for Gulf of Maine cod as amended in NEFSC (1997a, 27).
With five stocks, three recruitment models, and a variety of fishing mortality levels, the number of possible projections is very large. Projections were run with the Beverton-Holt model for each stock to determine whether the spreadsheet projection was providing results similar to the NMFS projection program (AGEPRO). The results were generally comparable with the projections presented in SARC Workin g Paper Gen 2. This paper evaluated the probability of rebuilding the spawning stock against agreed minimum threshold levels of spawning stock biomass. For other recruitment scenarios, the projections could be much different than those produced by NMFS, as illustrated in the following section.
Gulf of Maine Cod
After these initial projections, it was decided to conduct a limited set of simulations using Gulf of Maine cod, the only stock without an estimated decline in fishing mortality in the last two years. These projections were designed to illustrate how future stock responses to management can change for different stock-recruitment scenarios. The prior three recruitment scenarios were combined with an additional one reflecting the possibility of depensation, as defined below.
These models were postulated based on the assessment results:
-
the Beverton-Holt stock-recruitment model used in NMFS assessments;
-
recruitment will increase in proportion to stock size if spawning biomass is allowed to increase;
-
recruitment will stay constant on average at the historical mean value, independent of stock size; and
-
a depensatory spawner-recruit model in which the ratio R/S increases rather than decreases at small spawning biomass. As a result, a population at a very low biomass is likely to remain there for a long time until a positive recruitment event occurs. The spawner-recruit model is given by R = Sg / (1/a + 1/k Sg). The parameter estimates of g, a, and k are 3.42, 8.6 × 10⁻¹¹, and 7857, respectively, obtained by at least squares fit to recruit and spawner information from the ADAPT analysis.
In all cases, residual variance was assumed to be uncorrelated from year to year. Three levels of F were considered: 0.16 (F0.1), 0.29 (Fmax) and 1.04 (10-year mean). The four recruitment scenarios are illustrated in Figure F.2, along with the data points from the NMFS ADAPT results. Also indicated on this graph are levels of maximum R when SSB is greater than and less than the minimum observed level (in ADAPT results). When SSB is greater than the minimum observed level there is no practical limit on the level of R. When SSB falls below this level, however, R is restricted to values less than the lower of these two lines. In practice, this constraint had only a minor effect on projections except at the highest level of F (i.e., 1.04). The constraint on R was applied for all projections except those in which R is held constant, independent of stock size (scenario 3).
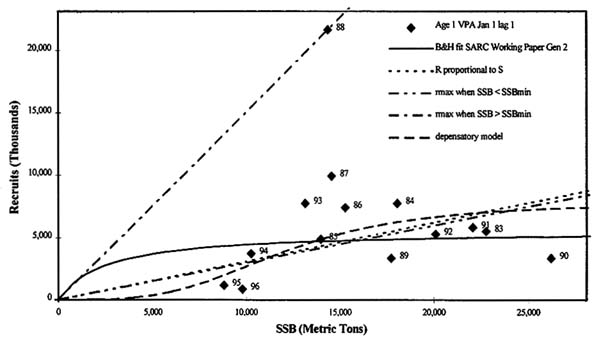
FIGURE F.2 Four recruitment scenarios for Gulf of Maine cod based on original NMFS VPA results 1983 to 1996.
The trend charts for spawning stock biomass, recruitment, and catch from the 12 projections (4 recruitment scenarios multiplied by 3 target Fs) are presented in Figures 2.9 through 2.12 of this report. An extra projection for R proportional to SSB at F = 1.04 was run without the constraint on R to demonstrate the effect that this constraint has at high levels of F (Figure 2.13). Discussion of the results of these projections is presented in the committee's report.
The results are summarised in a decision analysis table (Table 2.1 of this report), in which the consequences of alternative actions can be evaluated across different recruitment scenarios. To be even more useful in decisionmaking, such a table should be constructed using actual management tactics that could be employed to implement different target fishing mortalities rather than using the target fishing mortalities themselves.


